A compact dusty disk around the Herbig Ae star HR 5999 resolved with VLTI / MIDI††thanks: Based on observations with the ESO Very Large Telescope Interferometer at Paranal Observatory under programme IDs 073C-0248 and 073C-0720.
Abstract
Aims. We have used mid-infrared long-baseline interferometry to resolve the circumstellar material around the Herbig Ae star HR 5999, providing the first direct measurement of its angular size, and to derive constraints on the spatial distribution of the dust.
Methods. MIDI at the VLTI was used to obtain a set of ten spectrally dispersed (m) interferometric measurements of HR 5999 at different projected baseline lengths and position angles. To derive constraints on the geometrical distribution of the dust, we compared our interferometric measurements to 2D, frequency-dependent radiation transfer simulations of circumstellar disks and envelopes.
Results. The derived visibility values between 0.5 and 0.9 show that the mid-infrared emission from HR 5999 is clearly resolved. The characteristic size of the emission region depends on the projected baseline length and position angle, and it ranges between milliarcseconds (Gauss FWHM), corresponding to remarkably small physical sizes of AU. For disk models with radial power-law density distributions, the relatively weak but very extended emission from outer disk regions ( AU) leads to model visibilities that are significantly lower than the observed visibilities, making these models inconsistent with the MIDI data. Disk models in which the density is truncated at outer radii of AU, on the other hand, provide good agreement with the data.
Conclusions. A satisfactory fit to the observed MIDI visibilities of HR 5999 is found with a model of a geometrically thin disk that is truncated at AU and seen under an inclination angle of (i.e. closer to an edge-on view than to a face-on view). Neither models of a geometrically thin disk seen nearly edge-on, nor models of spherical dust shells can achieve agreement between the observed and predicted visibilities. The reason why the disk is so compact remains unclear; we speculate that it has been truncated by a close binary companion.
Key Words.:
techniques: interferometric – stars: individual: HR 5999 – stars: formation – stars: circumstellar disks1 Introduction
Herbig AeBe stars (HAEBEs; see Herbig 1960; Herbig 1994; Thé et al. 1994) are pre-main sequence stars of intermediate mass () that show broad emission lines, rapid variability, and excess infrared and millimeter-wavelength emission. These properties suggest the presence of substantial amounts of circumstellar dust and gas. The distribution of the circumstellar material is still a matter of debate. Since until recently the spatial scales of the inner circumstellar environment (a few AU, corresponding to ) were not accessible to optical and infrared imaging observations, conclusions drawn on the spatial distribution of the circumstellar material of the HAEBE stars were in most cases based entirely on the modeling of the spectral energy distribution (SED). However, fits to the observed SEDs are highly ambiguous (e.g. Men’shchikov & Henning 1994). For example, the SEDs of some HAEBEs could be equally well explained with such very different models as geometrically thin accretion disks and spherical envelopes (Hillenbrand et al. 1992; Miroshnichenko et al. 1997). More complex models, like envelopes with cavities produced by bipolar molecular outflows (Hartmann et al. 1993), geometrically thin and optically thick disks surrounded by a spherical envelope (Natta & Krügel 1995, Natta et al. 2001; Miroshnichenko et al. 1999), flared outer disks, puffed-up inner disk rims (Dullemond et al. 2001), and disk plus inner halo models (Vinkovic et al. 2006) have also been used to successfully fit the observed SEDs of HAEBEs. The strongest evidence for circumstellar disks around HAEBEs comes from millimeter interferometry (Mannings & Sargent 1997, 2000): flattened structures around several sources have been resolved on AU scales at millimeter wavelengths and detailed kinematic modeling of one source, MWC 480, is consistent with rotation in a Keplerian disk.
Speckle interferometry by Leinert et al. (2001) in the NIR reveals numerous examples of resolved halos on scales of (corresponding to several hundred AU). Bispectrum speckle interferometry revealed complex asymmetric structures on scales down to 70 mas in several intermediate- to high-mass young stellar objects (e.g. Schertl et al. 2000; Weigelt et al. 2002ab, 2006; Preibisch et al. 2001, 2002, 2003; Hofmann et al. 2004). Interferometric aperture masking Keck observations of the young system LkH 101 (Tuthill et al. 2001; 2002) revealed some details of the inner disk, which is seen nearly face-on. To make further progress on this topic, observations with even higher spatial resolution, at the level milli-arcseconds (mas), are needed to explore the inner circumstellar regions of these objects in detail. Such observations can only be performed with long-baseline interferometry.
The current generation of infrared long-baseline interferometers is sensitive to the distribution of dust around the nearest young stars on scales on the order of 1 AU, and it provides a powerful probe of the models of disks and envelopes of such stars. The first systematic study of HAEBEs using the technique of long-baseline interferometry in the near-infrared was conducted by Millan-Gabet et al. (2001), who could resolve the near-infrared emission of 11 of the 15 HAEBEs observed at the IOTA interferometer. The derived sizes of the observed structures are 0.5 to 6 AU, but no unique geometrical model could be determined for any of the sources due to the very sparse coverage of the -plane. A number of further studies have been obtained at different interferometers (e.g., Akeson et al. 2000; Wilkin & Akeson 2003; Eisner et al. 2004; Monnier et al. 2005). Most of the near-infrared interferometric data are consistent with a simple disk model possessing a central dust-free cavity, ringed by hot dust, but other geometries can often not be excluded, due to the poor sampling of these observations of the -plane.
The first long-baseline interferometric observations of HAEBEs at mid-infrared wavelengths were recently presented by Leinert et al. (2004). Their data, obtained with MIDI at the VLTI, trace the m emission from hot and warm dust in the inner disk regions and can be used to constrain the geometrical structure of the circumstellar material on angular scales of mas. They resolved the circumstellar material around all of the seven observed, nearby HAEBEs and derived characteristic dimensions of the emitting regions at m ranging from 1 AU to 10 AU, but, again, they could not determine the geometry of the dust distributions due to the limited -coverage of the observations.
HR 5999 (= HD 144668 = V856 Sco) is one of the best studied HAEBEs. It lies in the central part of the Lupus 3 dark cloud, which is part of the extended Lupus star-formation complex. HR 5999 has a spectral type of A7 III-IV and forms a wide proper-motion binary system with the A1.5 star HR 6000. The Hipparcos parallax for HR 5999 corresponds to a distance of pc. The spectral energy distribution of HR 5999 shows a clear infrared excess at wavelengths above m. IRAS detected HR 5999 at 12, 25, and 60m, but provided only an upper limit at 100m. Henning et al. (1994) found weak millimeter emission from HR 5999, but the detection was only at the significance level. The far-infrared and mm-emission of HR 5999 suggests the total mass of the circumstellar material to be on the order (Siebenmorgen et al. 2000). HR 5999 belongs to the “group I objects” as defined by Hillenbrand (1992); the infrared excess of these objects is thought to be from emission arising in a flat, optically thick accretion disk. The fit of the observed SED with a simple analytical model of an optically thick circumstellar disk yielded an outer radius of AU and a possible inner hole of AU. Siebenmorgen et al. (2000) analyzed mid-infrared ISO spectra of HR 5999 and found a broad silicate emission feature with a peak around m. With a ratio of peak- to continuum-flux of about 1.4, the intensity of this feature is relatively small. The broad and rather flat shape of the silicate feature indicates the presence of relatively large (m) silicate grains (cf. van Boekel et al. 2003).
The stellar parameters of HR 5999 suggest that the object is Myr old and has a mass of (van Boekel et al. 2005). HR 5999 will thus arrive at the main sequence as a mid B-type star. HR 5999 shows only moderate extinction ( mag) and is a fast rotator ( km/sec; Royer et al. 2002). The quasi-periodic and irregular photometric and spectroscopic variability of HR 5999 in the optical (see Perez et al. 1992) and in the UV range (see Perez et al. 1993) has been interpreted as due to instabilities in an optically thick circumstellar accretion disk. The detailed analysis of the UV emission lines in the IUE spectra of HR 5999 by Perez et al. (1993) revealed gas accreting onto the star with velocities as high as 300 km/sec (see also Blondel et al. 1993). Perez et al. (1993) also concluded that the observed double-peaked H and Mg II emission profiles strongly suggest that the circumstellar disk around HR 5999 is seen nearly edge-on. The average mass accretion rate was estimated to be , but the observed variability of the UV emission clearly suggests that the accretion process happens in a non-steady fashion.
To summarize, the existing data clearly show that HR 5999 is surrounded by circumstellar material, probably in the form of an accretion disk. The high and the double-peaked structure of the UV emission lines suggest that the system is seen under a relatively high inclination angle (i.e. close to edge on). This makes it an interesting target for a detailed interferometric study of the geometry of the circumstellar dust. Grady et al. (2005) presented HST STIS white-light coronographic imaging results for HR 5999, found no indication of nebulosity at AU, and concluded that the disk around HR 5999 must be geometrically small.
HR 5999 has a close visual companion, Rossiter 3930 (see Stecklum et al. 1995, and references therein), with and , at a projected separation of , corresponding to a projected distance of about 300 AU. Since Rossiter 3930 shows strong H emission, it is very likely a T Tauri star. If Rossiter 3930 is actually physically related to HR 5999 and not a chance projection, it may be responsible for the rather low (sub-)mm emission and corresponding low mass of the circumstellar material of HR 5999 due to the mechanism of dynamic disk clearing by gravitational binary interaction (e.g. Arymowicz & Lubow 1994).
2 Observations and data analysis
| UT date & time | B | PA | Obs. |
|---|---|---|---|
| [m] | [deg] | name | |
| 2004-04-10 02:44:34 | 46.34 | 173.37 | 46m/173° |
| 2004-04-10 05:23:56 | 46.60 | 21.57 | 46m/21° |
| 2004-04-11 05:16:58 | 46.59 | 20.74 | 46m/20° |
| 2004-04-11 09:09:04 | 42.42 | 52.12 | 42m/52° |
| 2004-04-12 09:46:20 | 39.76 | 56.36 | 39m/56° |
| 2004-06-28 00:15:43 | 102.38 | 15.35 | 102m/15° |
| 2004-06-28 02:06:06 | 100.76 | 30.90 | 100m/30° |
| 2004-06-28 04:26:08 | 90.89 | 46.10 | 90m/46° |
| 2004-06-28 05:22:28 | 83.22 | 50.57 | 83m/50° |
| 2004-09-30 00:02:18 | 63.50 | 123.74 | 63m/123° |
| Calibrator | (mas) | night | (UTC) |
| HD number | (2004) | ||
| 81797 | 2004-04-10 | 00:41:19 | |
| 2004-04-11 | 03:56:19 | ||
| 107446 | 2004-04-10 | 02:13:31 | |
| 2004-04-11 | 23:55:03 | ||
| 2004-04-12 | 01:24:27 | ||
| 109379 | 2004-06-27 | 23:27:48 | |
| 129456 | 2004-04-10 | 05:46:05 | |
| 2004-04-12 | 08:37:42 | ||
| 2004-04-12 | 10:09:08 | ||
| 2004-06-28 | 00:43:13 | ||
| 134505 | 2004-06-28 | 01:43:12 | |
| 139127 | 2004-04-11 | 05:35:48 | |
| 2004-04-11 | 09:36:42 | ||
| 2004-04-12 | 07:09:25 | ||
| 2004-06-28 | 02:48:50 | ||
| 2004-06-28 | 05:43:29 | ||
| 152885 | 2004-04-10 | 07:13:48 | |
| 2004-04-12 | 05:57:26 | ||
| 2004-04-12 | 09:24:41 | ||
| 161892 | 2004-04-12 | 04:42:03 | |
| 2004-04-12 | 05:02:42 | ||
| 168723 | 2004-04-10 | 09:29:56 | |
| 2004-04-10 | 10:12:13 | ||
| 2004-09-30 | 01:22:01 | ||
| 169916 | 2004-04-12 | 07:57:12 | |
| 176411 | 2004-04-10 | 08:08:34 | |
| 2004-04-10 | 08:45:41 | ||
| 188512 | 2004-09-30 | 03:13:45 |

The observations discussed in this paper were obtained with the MIDI instrument at the VLTI during several observing runs between April and September 2004. In total, ten MIDI measurements of HR 5999 were performed: six visibility measurements for observing program 073C-0248 (PI: Preibisch) and four visibility measurements for program 073C-0720 (PI: van Boekel). The combined data set is analyzed in this paper. The observation dates, the projected baseline lengths, the position angles of the projected baseline on the sky, and the abbreviated data set names used in the following text are summarized in Table 1. Our observations cover a range of projected baseline lengths from 39 m to 102 m and position angles ranging from 15∘ to 173∘, and, therefore, provide a relatively good coverage of the plane.
The fringes were scanned by applying rapid internal optical path difference (OPD) changes of a few wavelengths around the point of zero OPD. A prism with a spectral resolution of was used to obtain spectrally dispersed fringes in the range of 8 to 13 m. Immediately after a recording of interferometric data, photometric calibration data were obtained by blocking each of the two beams alternately. Chopping with a frequency of 2 Hz was applied to obtain the data for the sky background subtraction. A more detailed description of the observing procedure is given in Przygodda et al. (przygodda03 (2003)), Leinert et al. (2004), Chesneau et al. (2005a , 2005b ), and Ohnaka et al. (ohnaka05 (2005)).
Calibration stars with known angular diameter were observed for the calibration of the raw visibilities. Table LABEL:table_calib gives an overview of these calibration stars, their uniform-disk diameters as given in the CalVin list111available from ESO at http://www.eso.org/observing/etc/, and the MIDI observations that we used for the calibration of the raw visibilities of HR 5999.
We utilized two different MIDI data reduction packages: MIA developed at the Max-Planck-Institute for Astronomy and EWS developed at the Leiden Observatory. While the MIA package is based on the power spectrum analysis and measures the total power of the observed fringes, the EWS package first corrects for OPDs (instrumental, as well as atmospheric delays) in each scan, and then the interferograms are averaged. A more detailed description of the MIA and EWS packages can be found in Leinert et al. (2004) and Jaffe (jaffe04 (2004)), respectively. In our analysis of the HR 5999 data, we found good agreement between the results of both packages within the error bars. In the following discussion we always refer only to the results obtained with the MIA software.
The errors of the calibrated visibility were estimated from the scatter of the visibilities calibrated with all individual data sets of a night. In addition, to account for systematic error contributions (e.g. due to imperfect beam overlap), we assumed a minimum visibility error of 15%. One of the ten visibility measurements, the 46m/ data set, was affected by strong variations in the transfer function around the time of the measurement. This particular data set could not be calibrated well; we decided to drop it from the following analysis.
3 Observed visibilities
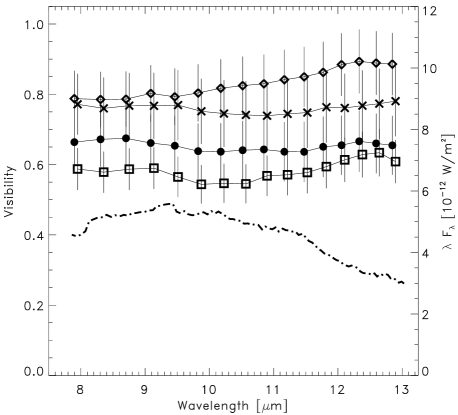

As the first step of the analysis, we consider the dependence of the observed visibilities on the wavelength, the projected baseline length, and the baseline position angle. Figure 2 shows the wavelength-dependence of the visibilities of HR 5999. All visibility curves are rather flat, i.e. the observed visibilities show no strong dependence on the wavelength.

Figure 3 shows the observed m visibilities as a function of projected baseline length. One can see that the data are not consistent with simple uniform-disk or Gaussian brightness distribution models.
3.1 Size of the emission region

In order to derive an initial rough estimate of the size of the resolved emission region, we fitted each observed visibility value with two simple models: first, a uniform-disk model, and second, a Gaussian brightness distribution. The resulting diameters range between 10 and 25 milliarcseconds (corresponding to AU at the distance of 208 AU) for the uniform disk model and mas ( AU) for the Gauss model (FWHM). The Gauss-fit diameters as a function of wavelength for the different MIDI observations are shown in Fig. 4. For all data sets, the diameters increase with increasing wavelength in the MIDI band. This effect can be understood as a consequence of the fact that the emission at longer wavelengths comes from cooler material, which is located at larger distances from the central star than the warmer material radiating at shorter wavelengths. Typically, the diameters at m are larger than at m.
Another notable effect is the trend that the longest baselines give the smallest diameters. Although one must not ignore that the different observations were obtained at different position angles (see next paragraph), this suggests a complex geometry for the emission region, as discussed in the next section.
3.2 Shape of the emission region

In Fig. 5 we plot the Gauss-fit radii (at wavelength 10.5 m) as a function of the position angle of the observation. The plot suggests that the structure of the emission region is not described well by a spherically symmetric distribution, i.e. seems to be asymmetric. An inclined ellipse with axis ratio 1:1.56 apparently yields better agreement to the data than a circle, but does not provide a particularly good fit either. The data suggest that the emission has a more complicated structure, probably with substructure at different size scales. A more detailed analysis of size and shape of the emission region is described below in Section 4.
3.3 Comparison to MIDI data of other HAEBEs
The visibilities measured for HR 5999 differ from those obtained by Leinert et al. (2004) for a sample of seven HAEBEs in two ways. First, all MIDI measurements of HR 5999 give visibilities , whereas six of the seven HAEBEs in the Leinert et al. (2004) sample show much lower visibility values, in the m to m wavelength range. Only 51 Oph shows visibility values similar to what we find for HR 5999. This implies that the angular extent of the mid-infrared emission from HR 5999 is smaller than that of most HAEBEs in the Leinert sample.
The second difference is the wavelength dependence of the visibilities. While the visibility for HR 5999 is essentially flat over the m to m wavelength range, most of the HAEBE stars in the Leinert sample show a rather strong drop in the visibility between m and m, in some cases followed by a slight increase towards longer wavelengths. The latter wavelength dependence of the visibility is expected for objects with significant m silicate emission features (a strong emission feature in the spectrum produces a minimum in the visibility due to optical depth effects, because the apparently larger object size in the center of the emission line yields lower visibilities). The flat visibility curves of HR 5999 are probably related to its very weak silicate emission feature, which does not contribute enough to produce a significant dependence of the visibility (apparent object size) on wavelength over this feature.
4 Constraints on the source shape from 2D radiative transfer simulations
The true morphology of the mid-infrared emission is most likely more complex than simple geometrical models for the brightness distribution, like uniform-disk or Gauss models. For example, the existence of a dust-free hole inwards of the dust sublimation radius already implies that the brightness distribution cannot have a steadily decreasing profile. In order to see how much information on the spatial distribution of circumstellar material can be deduced from our MIDI data, we performed 2D radiation transfer calculations. We believe that this approach provides more realistic constraints than the use of simple analytical models. Our radiative transfer modeling also includes a self-consistent determination of the dust sublimation radius, i.e. the inner disk edge, which is a crucial ingredient in any realistic modeling attempt. Note that the aim of the modeling in this paper is an exploration of different geometries for the dust distribution and not a detailed disk modeling (which is not warranted considering the rather large uncertainties of the measured visibilities).
4.1 Modeling procedure
For our simulations we used the 2D radiation transfer code described in detail by Sonnhalter et al. (1995). In this code, the distribution of dust temperatures and radiation intensities in an axially symmetric dusty circumstellar environment around a central radiation source is calculated within the framework of the flux-limited diffusion approximation (Levermore & Pomraning 1981). The equations are discretized on a quadratic, equally spaced grid. As the density distribution is assumed to be axially symmetric with respect to the -axis and mirror symmetric with respect to the plane , cylindrical coordinates are used, because the symmetry reduces the relevant information to the first quadrant of the plane. To improve resolution and convergence, a system of 5 nested grids with decreasing grid spacing is used. The differential equations for the radiation field are iterated together with the temperature equations until a self-consistent equilibrium configuration is reached. At the end of the iteration procedure, the total radiation flux (integrated over all frequencies) through the outermost grid cells was always within 1% of the stellar luminosity for all computed models. We note that any non-spherical density distribution results in non-spherically symmetric temperature distributions. For example, in models of a circumstellar disk, the disk surface is generally found to be warmer than the disk midplane at the same radial distance from the star.
After determination of the dust temperatures for a multi-component dust model, a ray-tracing procedure is used to calculate intensity maps for the appearance of the central object and its circumstellar environment at varying inclinations for selected frequencies. The simulated images are then used to compute visibility maps in the plane, which finally can be compared to the MIDI measurements. We used 64 wavelength points between m and 5 mm for our modeling of HR 5999. The size of the numerical grid was set to AU, which resulted in a spatial resolution (i.e. the grid point spacing for the innermost grid) of 0.016 AU. As a final check on the numerical accuracy, we used images computed with the ray-tracing procedure at a large number of different inclination angles to determine the total flux (integrated over all wavelengths) as a function of the inclination angle. Integration of these fluxes over all inclination angles then gives the total model luminosity, which finally can be compared to the input luminosity. For the geometrical models described below, we find typical deviations of in the case of spherical and thick disk models, increasing up to for the thinnest disk models (when the vertical thickness of the inner disk gets similar to the numerical grid resolution).
Note that our radiative transfer code not only accounts for extinction by and emission from dust grains, but also treats scattering by dust grains; isotropic scattering is implicitly assumed. Although the scattering efficiency of dust grains is quite low at mid-infrared wavelengths, scattering of optical/UV photons in the region above and below the disk plane can lead to significantly increased heating of the outer disk regions; this can result in more extended thermal emission at mid-infrared wavelengths. If scattering is neglected (as is sometimes done in other radiation transfer simulations), the extent of the emission can be significantly underestimated.
Our radiative transfer modeling assumes the disk is passive (i.e. the temperature at each point is determined by the local radiation field) and does not take into account possible viscous disk heating by accretion. This is appropriate because the stellar parameters and the estimated accretion rate (see §1) suggest that accretion does not contribute more than to the total luminosity.
A self-consistent radiation transfer model should, of course, reproduce not only the observed visibilities, but also the broad-band spectral energy distribution (SED). We therefore constructed the SED of HR 5999 from the UV to mm wavelengths from literature data (Hillenbrand et al. 1992; Henning et al. 1994; Acke & van den Ancker 2004). A complication arises from the presence of the companion Rossiter 3930, which has an angular separation of only from HR 5999. The fluxes for the SED points, which were obtained from seeing-limited observations, therefore represent the sum of the fluxes from HR 5999 and Rossiter 3930. The adaptive optics study by Stecklum et al. (1995) showed that the flux of Rossiter 3930 is considerably smaller than that of HR 5999 at optical and near-infrared wavelengths; they determined mag. At longer wavelengths, however, Rossiter 3930 may well contribute a larger fraction to the total flux, and it cannot even be excluded that it may dominate the total flux, as is the case for the several well-known “infrared companions” in binary T Tauri star systems (e.g. Chelli et al. 1988). Although the latter possibility does not appear to be very likely in the case of HR 5999 (since there is no strong increase in the flux contribution from Rossiter 3930 from the optical to the near-infrared range), all SED points longward of m can only be considered as upper limits to the flux of HR 5999. In our radiation transfer modeling we therefore cannot require that the model SED matches the observed SED longward of m, but only that it does not exceed the observed SED. We note that the companion does not affect our MIDI data of HR 5999 since the interferometric field-of-view is smaller than the separation222To be sure, we inspected the acquisition images and found no indication of another source in the MIDI field-of-view..
As input for the radiation transfer calculations one has to specify the luminosity and effective temperature of the central radiation source (we used and K following van Boekel et al. 2005), the optical properties of the dust, and the density structure of the circumstellar material. The dust composition around HR 5999 was recently investigated by van Boekel et al. (2005), who found that the m spectrum is dominated by large silicate (olivine) grains. Guided by their results, we used a dust model here that consists of silicate and carbon grains with sizes of m. The sublimation temperature of both grain species is taken to be 1500 K. In the radiation transfer code, the destruction of grains through sublimation is simulated by setting the number density of the grains to zero, if the temperature of that particular grain species, which is calculated simultaneously with the radiation field, exceeds the sublimation temperature.
Model images were computed with the radiation transfer code for those 15 wavelengths between m and m for which the visibilities were determined from the MIDI data. We then calculated visibility maps from the model images and compared them to the measured visibilities for HR 5999. Since the orientation of the disk (i.e. the angle between the disk axis and the north-south direction on the sky, measured counter-clock wise and denoted here as the position angle ) is unknown, an fitting procedure was used to determine the position angle that results in the best agreement between measured and simulated visibilities. For this we used all 9 visibility curves, each consisting of 15 wavelengths points, i.e. 135 individual data points.
4.2 Models for the density distribution
We consider here two different classes of models for the density distribution of the circumstellar material, disk models, and spherical envelope models.


4.2.1 Extended disk (Model D)
We started with models of a quasi-Keplerian disk (i.e. the disk structure is determined by the gravitationally dominating central star), with the following density distribution:
| (1) |
We used for the radial density power-law index, and for the radial dependence of the vertical disk scale height we assumed , i.e. a slightly flaring disk shape. The parameter fixes the relative geometrical thickness of the disk.
In our modeling we considered different values for the relative disk thickness (from very thin disks with to very thick disks with ), different inclination angles (from for a face-on view and for an edge-on view), and also tried different values for the radial density power-law index . For each combination of model parameters, the density is restricted by the requirement that the model SED should agree with the observed SED points for wavelengths m and must not exceed the observed fluxes for longer wavelengths (where the observed SED points contain an unknown flux contribution from the binary companion).
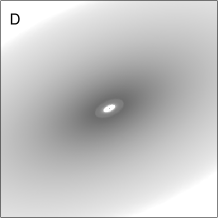
The resulting brightness distribution in the simulated images is dominated by the central star and the inner disk region of a few AU (see Fig. 6). The peak brightness is found at the inner rim of the dusty disk at the dust sublimation radius, and it drops smoothly outwards. Despite the quite compact appearance of the simulated images, the weak emission from the outer parts of the disk contributes a significant fraction of the total flux at mid-infrared wavelengths. This extended emission leads to a large effective size of the emission and yields model visibilities that are considerably lower than some of the observed visibilities. The characteristic size of the model brightness distributions is up to twice as large as the sizes derived from the observed visibilities. Even if we change the power-law exponent for the radial density law (to values as steep as ) or the thickness of the disk, the extent of the emission in the model images is still considerably too large and inconsistent with the observed visibilities.
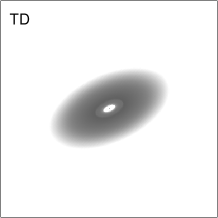
4.2.2 Truncated disk (Model TD)
One possibility for decreasing the amount of extended emission in the outer parts of the images is to limit the circumstellar mass distribution to a certain outer radius. For this, we used the disk model describe above (Equ. 1) and truncated the density distribution at the outer radius . This truncation is performed by multiplying the density distribution with a Fermi-type function:
| (2) |
where is the density distribution given in Equ. (1), is the radial distance from the origin, while determines the width of the transition zone of the Fermi-type function; we used .
With these models we were able to find acceptable fits to the observed SED up to m (see Fig. 7) and the observed visibilities for truncation radii in the range AU, inclination angles of , and position angles of . The vertical thickness of the disk (governed by the parameter ) is nearly unconstrained by the data (thin and moderately thick disks seen under intermediate inclination angles “look” very similar).
In Fig. 6 we show a model with parameters , AU, , and , which yields an acceptable (albeit not perfect) fit to the data with . The V-band optical depth of this model along the disk plane is . Although models with larger vertical disk scale height give marginally better fits to the visibilities (for example, for a disk with ), we prefer this specific thin-disk model because the vertical scale height of the dusty disk agrees with the formal condition of vertical hydrostatic equilibrium (see, e.g., Equ. 7. in Chiang & Goldreich 1997).
For comparison, we note that a model for the same disk parameters but without the truncation factor (model D in Fig. 6) yields .

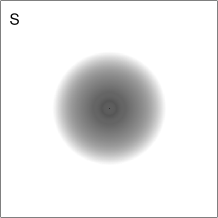
4.2.3 Spherical shell (Model S)
As already shown in §3.2, the observed visibilities suggest that the brightness distribution is not spherically symmetric but rather somewhat elongated. In order to assess quantitatively how much the truncated disk model provides a better description to the data than spherical shell models, we also considered models with a spherically symmetric power-law density distribution, in which the density distributions were again truncated at radius :
| (3) |
We found that spherical shell models always provide poorer fits to the data than the truncated disk models. A spherical model (model S in Fig. 6) with the same radial density power-law and truncation radius as in the truncated disk model described above yields .
4.3 Conclusions from the radiative transfer modeling
We find that dust distributions in which the radial density follows a power law (with exponents in the range ) produce brightness distributions that are much too extended to be consistent with our set of MIDI data. Disk models in which the density is truncated at outer radii of AU, on the other hand, provide reasonably good fits to the MIDI data.
Given the large number of free parameters in the radiative transfer models and the relatively large visibility errors, which do not allow us to constrain model parameters very well, it was not our aim to scan the full multi-dimensional parameter space in order to find the overall “best fit” model. We instead proceed the other way round and summarize here those model categories that can be ruled out by our data and modeling. The following cases are inconsistent with the MIDI data:
-
•
Spherical shells – The observed visibilities suggest that the brightness distribution is not circular symmetric but rather somewhat elongated. This is confirmed by our radiative transfer modeling, which shows that spherically symmetric shell models cannot produce good fits to the observed data.
-
•
Disks seen at low inclination angles (, i.e. nearly “face-on”) – Such models produce a nearly circular symmetric brightness distribution and thus do not fit the data well.
-
•
Very thick disks () – Such models also produce only very slightly elongated, nearly circular symmetric brightness distributions.
-
•
Geometrically thin disks () seen close to edge-on () – Such models predict strongly elongated brightness distributions, which are inconsistent with the moderate amount of asymmetry suggested by the MIDI data.
Finally, we note that there may be other ways to explain the compact brightness distribution. One possibility for decreasing the amount of extended emission in the outer parts of the images may be to introduce a dense puffed-up wall at the inner edge of the dust distribution that casts a shadow on the outer parts of the disk. Such a shadow leads to a much steeper temperature profile in the disk regions behind the rim, and therefore the region containing warm enough dust that radiates significantly in the mid-infrared is smaller than without an inner rim. Models of this kind have, for example, been used by Dullemond et al. (2001) to fit the observed SEDs of HAEBEs. The resulting brightness distribution will depend on the detailed shape of the inner rim, which is not well known (see, e.g., discussion in Isella & Natta 2005). Since such models introduce several additional free parameters for the radiative transfer modeling, they are beyond the scope of the present study and will be the topic of a forthcoming paper.
5 Summary and conclusions
Our MIDI interferometric study has, for the first time, resolved the mid-infrared emission around the Herbig Ae star HR 5999. The most remarkable result is the compactness of the m emission, which has a characteristic radius of only AU. The data also suggest that the emitting region is elongated. Our radiative transfer modeling shows that a moderately thick disk with outer edge at AU, seen under an intermediate inclination angle, provides a reasonably good description of the data. We also find that disk models provide better fits to the data than spherical shell models.
The derived outer disk radius of AU is considerably smaller than canonical assumptions of disk sizes around young stellar objects. This leaves us with the question of why the disk around HR 5999 is so compact. One possible reason may be that the disk was truncated by the gravitational effect of a companion to HR 5999. Dynamical disk clearing is expected to truncate the disks around the stars in a binary system to roughly of the orbital separation of the components (see, e.g., the numerical simulations by Pichardo et al. 2005). The presence of the companion Rossiter 3930 is interesting in this context, but the quite large projected separation between HR 5999 and Rossiter 3930 of AU would require an extremely elliptical orbit in order to explain a disk truncation radius of only AU. A more likely possibility would be the presence of another, yet undetected, companion at close separation ( AU) from HR 5999. The MIDI data provide no hint of the existence of a close companion, but we note that it would essentially be undetectable in the MIDI data if its mid-infrared emission333 We performed a number of simulations to get a realistic estimate of the MIDI detectability of a possible companion in the following way: To our ”best fit” model images (for the truncated disk model) we artificially added a ”companion” at a separation of 50 mas from the central star. We considered a range from 1:100 to 1:1 for the flux ratio between the emission from the companion and the photospheric emission from the primary star. We then computed the wavelength-dependent visibilities for the points of our MIDI observations from these images, and finally determined the difference to the visibilities without the simulated companion. As a general result, we found that the effect of the simulated companion on the visibilities is very small. Even in the case of a very bright companion (flux ratio 1:1), the maximal change in the visibilities was less than 3%, i.e. well below the uncertainty of the MIDI visibilities. We note that, for example, a companion with an age of about 1 Myr would yield a photospheric flux ratio of 1:9. Thus, even if the companion had mid-infrared excess due to its own disk at a level of 10 times the photospheric flux, it would be undetectable in the MIDI data. is less than a few percent of that from the material around HR 5999.
Acknowledgements.
We would like to thank the referee for detailed comments that helped to improve this paper.References
- (1) Acke, B., van den Ancker, M.E., 2004, A&A 426, 151
- (2) Akeson, R.L., Ciardi, D.R., van Belle, G.T., Creech-Eakman, M.J., Lada, E.A., 2000, ApJ 543, 313
- (3) Artymowicz, P., Lubow, S.H., 1994, ApJ 421, 651
- (4) Blondel, P.F.C., Talavera, A., Tjin A Djie, H.R.E., 1993, A&A 268, 624
- (5) Chiang, E.I., & Goldreich, P., 1997, ApJ, 490, 368
- (6) Chelli, A., Cruz-Gonzalez, I., Zinnecker, H., Carrasco, L., Perrier, C., 1988, A&A, 207, 46
- (7) Chesneau, O., Meilland, A., Rivinius, T., et al. 2005a, A&A, 435, 275
- (8) Chesneau, O., Verhoelst, T., Lopez, B., et al. 2005b, A&A, 435, 563
- (9) Dullemond, C.P., Dominik, C., Natta, A., 2001, ApJ, 560, 957
- (10) Eisner, J.A., Lane, B.F., Akeson, R.L., Hillenbrand, L.A., Sargent, A.I., 2003, ApJ 588, 360
- (11) Eisner, J.A., Lane, B.F., Hillenbrand, L.A., Akeson, R.L., Sargent, A.I., 2004, ApJ 613, 1049
- (12) Grady, C.A., Woodgate, B.E., Bowers, C.W., et al., 2005, ApJ 630, 958
- (13) Hartmann, L., Kenyon, S.J., Calvet, N., 1993, ApJ 407, 219
- (14) Henning, Th., Launhardt, R., Steinacker, J., Thamm, E., 1994, A&A 291, 546
- (15) Herbig, G.H., 1960, ApJS, 4, 337
- (16) Herbig, G.H., 1994, in: The Nature and Evolutionary Status of Herbig Ae/Be Stars, eds. P.S. Thé, M.R. Pérez & E.P.J. van den Heuvel, ASP Conf. Series
- (17) Hillenbrand, L.A., Strom, S.E., Vrba, F.J., Keene, J., 1992, ApJ 397, 613
- (18) Hofmann, K.-H., Balega, Y., Preibisch, Th., Weigelt, G. 2004, A&A 417,981
- (19) Isella, A., Natta, A., 2005, A&A, 438, 899
- (20) Jaffe, W. 2004, SPIE Proc., 5491, p.715
- (21) Leinert Ch., Haas, M., Abraham, P., Richichi, A., 2001, A&A 375, 927
- Leinert et al. (2004) Leinert, Ch., van Boekel, R., Waters, L. B. F. M., et al. 2004, A&A, 423, 537
- (23) Levermore, C.D., & Pomraning, G.C. 1981, ApJ 248, 321
- (24) Mannings, V., & Sargent, A.I., 1997, ApJ 490, 792
- (25) Mannings, V., & Sargent, A.I., 2000, ApJ 529, 391
- (26) Men’shchikov, A.B., & Henning, Th., 1994, in: Circumstellar Dust Disks and Planet Formation, eds. R. Ferlet & A. Vidal-Madjar, Editions Frontieres, p. 381
- (27) Millan-Gabet, R., Schloerb, F.P., & Traub, W.A., 2001, ApJ 546, 358
- (28) Miroshnichenko, A., Ivezix , Z., Elitzur, M., 1997, ApJ 475, L41 (erratum in ApJ 479, L153)
- (29) Miroshnichenko, A., Ivezix , Z., Vinkovic, D., Elitzur, M., 1999, ApJ 520, L115
- (30) Monnier, J.D., Millan-Gabet, R., 2002, ApJ, 579, 694
- (31) Monnier, J.D., Millan-Gabet, R., Billmeier, R., et al., 2005, ApJ, 624, 832
- (32) Natta, A., Krügel, E., 1995, A&A 302, 849
- (33) Natta, A., Prusti, T., Neri, R., Wooden, D., Grinin, V.P., Mannings, V., 2001, A&A 371, 186
- (34) Ohnaka, K., Bergeat, J., Driebe, T., et al. 2005, A&A, 429, 1057
- (35) Perez, M.R., Webb, J.R., The, P.S., 1992, A&A 257, 209
- (36) Perez, M.R., Grady, C.A., The, P.S., 1993, A&A 274, 381
- (37) Pichardo, B., Sparke, L.S., Aguilar, L.A., 2005, MNRAS 359, 521
- (38) Preibisch, Th., Balega, Y.Y., Schertl, D., Smith, M.D., Weigelt, G. 2001, A&A 378, 539
- (39) Preibisch, Th., Balega, Y., Schertl, D., Weigelt, G. 2002, A&A 392,945
- (40) Preibisch, Th., Balega, Y., Schertl, D., Weigelt, G. 2003, A&A 412,735
- (41) Przygodda, F., Chesneau, O., Graser, U., et al. 2003, Ap&SS, 286, 85
- (42) Royer, F., Grenier, S., Baylac, M.-O., Gomez, A.E., Zorec, J., 2002, A&A 393, 897
- (43) Schertl, D., Balega, Y., Hannemann, T., et al. 2000, A&A 361,L29
- (44) Siebenmorgen, R., Prusti, T., Natta, A., Müller, T.G., 2000, A&A 361, 258
- (45) Sonnhalter, C., Preibisch, Th., Yorke, H.W. 1995, A&A 299,545
- (46) Stecklum B., Eckart, A., Henning, T., Loewe, M., 1995, A&A 296, 463
- (47) Thé, P.S., de Winter, D., & Pérez, M.R., 1994, A&AS 104, 315
- (48) Tuthill, P.G., Monnier, J.D., Danchi, W.C., 2001, Nature 409, 1012
- (49) Tuthill, P.G., Monnier, J.D., Danchi, W.C., Hale, D.D.S., Townes, C.H., 2002, ApJ 577, 826
- (50) van Boekel, R., Waters, L.B.F.M., Dominik, C., et al. 2003, A&A 400, L21
- (51) van Boekel, R., Min, M., Leinert, Ch., et al. 2004, Nature 432, 479
- (52) van Boekel, R., Min, M., Waters, L.B.F.M., et al. 2005, A&A 437, 189
- (53) Vinkovic, D., Ivezic, Z., Jurkic, T., Elitzur, M. 2006, ApJ 636, 348
- (54) Weigelt, G., Preibisch, Th., Schertl, D., Balega, Y.Y., Smith, M.D. 2002a, A&A 381, 905
- (55) Weigelt, G., Balega, Y., Hofmann, K.-H., Preibisch, Th. 2002, 2002b, A&A 392, 937
- (56) Weigelt, G., Beuther, H., Hofmann, K.-H., et al., 2006, A&A 447, 655
- (57) Wilkin, F.P., & Akeson, R.L., 2003, Ap&SS 286, 145