Discovery and analysis of three faint dwarf galaxies and a globular cluster in the outer halo of the Andromeda galaxy8
Abstract
We present the discovery of three faint dwarf galaxies and a globular cluster in the halo of the Andromeda galaxy (M31), found in our MegaCam survey that spans the southern quadrant of M31, from a projected distance of to . Though the survey covers 57 sq. degrees, the four satellites lie within of one another. From the tip of the red giant branch, we estimate that the globular cluster lies at a distance of from the Milky Way and along with a projected distance from M31 we derive a total distance of from its host, making it the farthest M31 globular cluster known. It also shows the typical characteristics of a bright globular cluster, with a half-light radius of and an absolute magnitude in the band of . Isochrone fitting reveals it is dominated by a very old population with a metallicity of . The three dwarf galaxies are revealed as overdensities of stars that are aligned along red giant branch tracks in their color-magnitude diagrams. These satellites are all very faint, with absolute magnitudes in the range , and show strikingly similar characteristics with metallicities of and half-light radii of , making these dwarf galaxies two to three times smaller than the smallest previously known satellites of M31. Given their faintness, their distance is difficult to constrain, but we estimate them to be between 740 and which places them well within the virial radius of the host galaxy. The panoramic view of the MegaCam survey can provide an unbiased view of the satellite distribution of the Andromeda galaxy and, extrapolating from its coverage of the halo, we estimate that up to satellites brighter than should be orbiting M31. Hence faint dwarf galaxies cannot alone account for the missing satellites that are predicted by CDM models, unless they reside in dark matter mini-halos that are more massive than the typical masse of currently inferred from their central radial velocity dispersion.
keywords:
galaxies: structure – galaxies: dwarf – galaxies: formation – galaxies: individuals (And XI, And XII, And XIII)1 Introduction
88footnotetext: Based on observations obtained with MegaPrime/MegaCam, a joint project of CFHT and CEA/DAPNIA, at the Canada-France-Hawaii Telescope (CFHT) which is operated by the National Research Council (NRC) of Canada, the Institut National des Science de l’Univers of the Centre National de la Recherche Scientifique (CNRS) of France, and the University of Hawaii.A generic prediction of Cold Dark Matter (CDM) cosmology is the existence of copious sub-structure in gravitationally collapsed structures such as galaxy clusters, galaxy halos and even dwarf galaxies (Klypin et al., 1999; Moore et al., 1999a, 2001). On the scale of large spiral galaxies like the Milky Way and the Andromeda galaxy (M31), upwards of 500 dense dwarf galaxy-mass clumps are expected to orbit in the halo. These structures have very dense cores, with a very steep radial profile (Navarro, Frenk & White, 1997; Moore et al., 1999b), which renders them essentially impervious to Galactic tides. However, more than two orders of magnitude fewer luminous dwarf galaxies have so far been found in the Local Group.
Several studies have investigated the effect of reionization on the early evolution of small structures (e.g. Bullock, Kravstov & Weinberg, 2000; Sommerville, 2002; Tully et al., 2002). Any gas that is not in deep potential wells is lost from the protogalaxies as the first ionizing sources turn on. This “squelching” of star-formation could solve the CDM satellite over-production problem by rendering low-mass galaxies invisible, or at least very dark, depending on the gas fraction that managed to cool to dense molecular form before reionization. Generally, the observed distribution of dwarf satellites can be brought into agreement with CDM if dwarf galaxies reside in large dark matter halos (Stoehr et al., 2002), but it opens up the possibility that lower mass dwarfs are being missed.
The recent discoveries of faint dwarf galaxies around both the Andromeda galaxy and our own Milky Way could be the first step in uncovering such satellites. Andromeda IX (And IX, Zucker et al. 2004; Chapman et al. 2005; Harbeck et al. 2005), Andromeda X (And X, Zucker et al. 2006a), Ursa Major (UMa, Willman et al. 2005), Canes Venatici (CVn, Zucker et al. 2006b) and Bootes (Boo, Belokurov et al. 2006) are all fainter than but show characteristics typical of dwarf galaxies. Radial velocity measurements show that at least And IX (Chapman et al., 2005), UMa (Kleyna et al., 2005) and Boo (Muñoz et al., 2006) appear to be highly dark matter dominated and could correspond to the dark matter sub-structures that are found in the CDM models. The discovery of all these faint dwarf galaxies within wide-field surveys (the Sloan Digital Sky Survey and the INT Wide Field Camera survey of the inner halo of M31; Ibata et al. 2001 and Ferguson et al. 2002) revealed the need to conduct systematic surveys of large regions of the halos of the Milky Way or the Andromeda galaxy in order to properly constrain the low luminosity end of their satellite distribution with adequate statistics.
Even though the M31 galaxy is located at (McConnachie et al., 2005) from the Sun, surveying the Andromeda galaxy halo has the advantage of requiring to map a much smaller area to have a panoramic view of its halo compared to the Milky Way within which we sit and whose disk and bulge significantly hamper observations at low latitude. Hence we undertook a systematic survey of the outer part of the M31 halo that extends the inner halo survey conducted by our team, which has revealed a flurry of substructures (Ibata et al., 2001; Ferguson et al., 2002; McConnachie et al., 2004; Ibata et al., 2005). The new survey was conducted with the wide field camera MegaCam mounted on the Canada-France-Hawaii Telescope and spans the whole Southern quadrant of the M31 halo. Covering 57 square degrees, it extends from a projected distance of to at the distance of M31.
In this paper, we present the discovery of the three new faint dwarf galaxies that appear in this survey, revealed by an overdensity of stars on the sky that follow red giant branch (RGB) tracks at the distance of M31. The farthest globular cluster in the halo of M31 is also reported. The dataset is presented in section 2 and the characteristics of the four new satellites are derived in section 3 and discussed in section 4. We conclude in section 5. We refer the reader to a companion paper (Ibata et al., 2006) for the search and analysis of large scale structures in the MegaCam survey.
2 Observations and reduction
The MegaCam instrument is a wide field camera composed of a mosaic of 36 CCDs that cover a total area of . Each CCD is composed of pixels of 0.187 arcseconds. The camera is mounted on the 3.6 m Canada-France-Hawaii Telescope on Mauna Kea, ensuring excellent image quality. Each of the 63 fields of the survey was observed in the and bands with an exposure time of 1450 s per filter in seeing better than . This yielded limiting magnitudes of and in the and bands, respectively.
The raw images were pre-processed by the CFHT team using the Elixir system111http://www.cfht.hawaii.edu/Instruments/Imaging/MegaPrime/dataprocessing.html in order to correct for the instrumental signature across the whole mosaic. Then we reduced the data using a version of the CASU pipeline (Irwin & Lewis, 2001) adapted for MegaCam observations to produce catalogues of magnitudes, colors and object morphological classifications. The and magnitudes are de-reddened using the values from Schlegel, Finkbeiner & Davis (1998) IRAS maps as follows: and where and are the de-reddened magnitudes. The extinction values however remain low () and do not vary over the small regions of a few arcminutes considered here (see also Ibata et al. 2006).
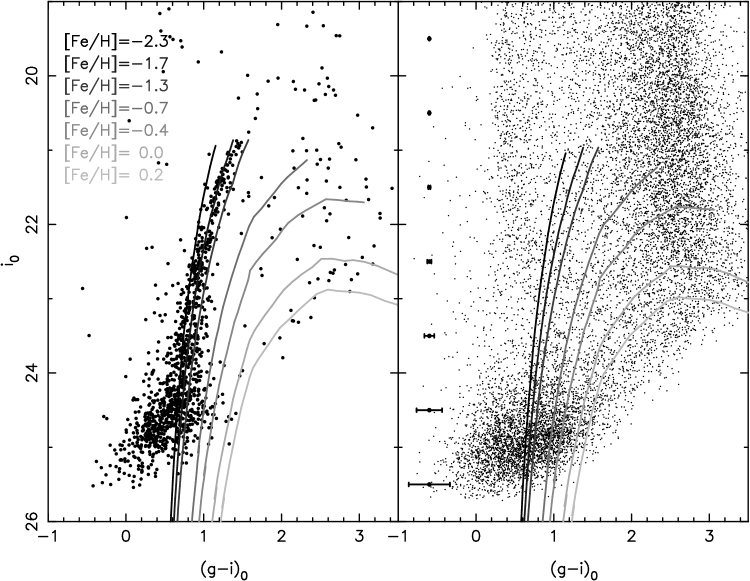
Comparing the observed RGB stars of the new satellites with isochrones is essential for deriving their parameters. We use the Girardi et al. (2004) isochrones for comparison since they are available in the SDSS and system. To avoid age-metallicity degeneracy, we choose to use only old isochrones (14 Gyr) as halo globular clusters and the dominant dwarf galaxy stellar populations are generally found to be old (see e.g. Mackey & Gilmore 2004 for Galactic halo globular clusters and Grebel 2001 for dwarf galaxies). To check the applicability of these isochrones we first compared them to the Andromeda III dwarf galaxy. The color-magnitude diagram (CMD) of stars within of the center of the dwarf galaxy is shown on the left panel of Figure 1. The Girardi et al. (2004) isochrones have been overlaid on the CMD at the distance of the dwarf (, McConnachie et al., 2005) and are in good agreement with the metallicity of And III (, McConnachie et al. 2005). In the following, an estimate of the metallicity of each RGB star at the distance of M31 is provided by the ratio of the distances in the CMD from this star to the two closest isochrones. Even though this will only be a crude estimation of the metallicity of this star, a more precise determination is not possible given the uncertainties on the distance and age of the stars.
The right panel of Figure 1 shows the CMD of a typical outer halo field of the MegaCam survey. The isochrones are placed at the distance of M31 (; McConnachie et al., 2005) and reveal that the Galactic contamination coming from disk stars at and and halo stars at and is mainly avoided, especially for the typical color of the stellar populations found in the new satellites.
3 Four new M31 companions
The four new M31 companions were discovered directly during a visual inspection of the CMDs and sky maps of the 63 fields of the survey. They correspond to groups of stars that are at the same time clumped on the sky and aligned along a RGB track. An automatic search to detect more diffuse substructures or those that could remain hidden in a denser background population (e.g. in the giant stream that is also present in the survey region; Ibata et al. 2001, 2006) will be presented in a companion paper (Martin et al., in prep). The four satellites described here are all recovered with a high signal-over-noise ratio in the automatic search.
Among the four satellites, one is a bright globular cluster (GC) and three have the characteristics of faint dwarf galaxies. Following the naming convention adopted by Armandroff, Davies & Jacoby (1998) and Armandroff, Jacoby & Davies (1999), we call these And XI, XII and XIII. Surprisingly, they all lie within two degrees of one another (see Figure 2). The derived parameters of the four objects are summarized in Table 1.

| And XI | And XII | And XIII | GC | |
|---|---|---|---|---|
| (J2000) | ||||
| (J2000) | ||||
| - | ||||
| (pc) | ||||
| median | ||||
| 24.47 (M31)a | 24.47 (M31)a | 24.47 (M31)a |
a The low number of stars in these dwarfs makes it difficult to determine their distance modulus, which
is taken as the one of the M31 galaxy. See also section 4 down below.
b The metallicity value for GC is derived from isochrone fitting.
3.1 And XI
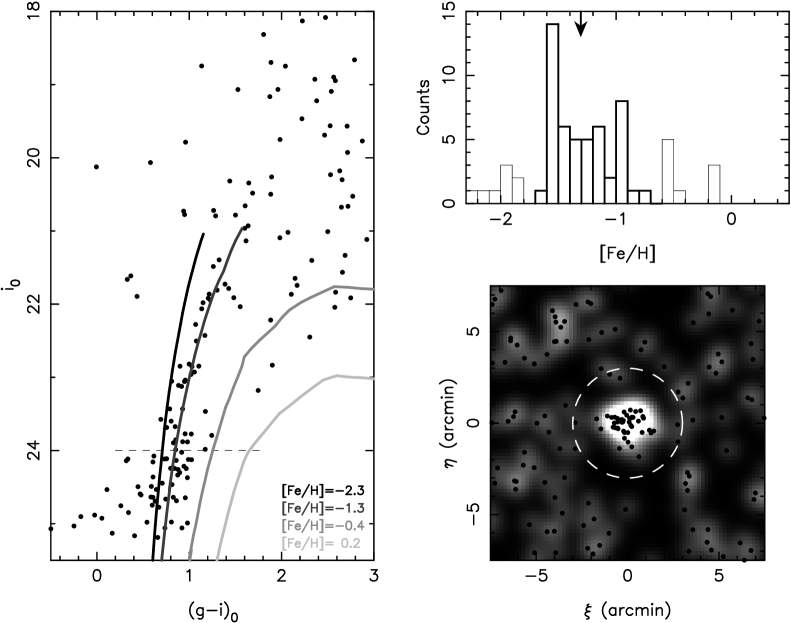
This satellite is the most luminous of the three new dwarf galaxies found around M31. It is however so faint that the MegaCam image observed in the band does not show any visible dwarf, although it does correspond to an overdensity of stars (bottom right panel of Figure 3). The CMD of the region within 3 arcminutes of the central position of the dwarf is constructed in the left panel of Figure 3 and shows a RGB, composed of stars with an implied metallicity of . The metallicity distribution of stars with (top right panel of the same Figure) indeed shows a higher number of stars around the median value of . Only stars within this peak, that is with that populate the RGB (thick histogram) are considered as And XI stars and used to determine the parameters of the dwarf. However, the low number of RGB stars makes these determinations quite uncertain. In particular, the location of the tip of the red giant branch (TRGB), often used to determine the distance of galaxies, is hard to pinpoint among the contaminating stars from the Galactic foreground and the Andromeda halo. The absence of a clear horizontal branch in the MegaCam data conspires to prevent a proper determination of the distance (even though the group of stars at and could represent such a horizontal branch). Hence, we use the distance of M31 as the distance of And XI (, McConnachie et al. 2005; but see section 4 below).
The center of the dwarf, determined as the mean of the stars within 3 arcminutes and with is . The luminosity profiles of the dwarf in both the and bands are constructed from this center by adding the flux contribution of each star, corrected from the background contaminating flux that is determined from stars within an annulus between 4 and 10 arcminutes. The light profiles become flat within 2 to 4 arcminutes (confirming that there should not be many stars from the dwarf that are missed by the cut) and yield an average half-light radius of . The uncertainties are determined from a bootstrap method, randomly re-generating the flux of each star from the flux distribution of And XI stars. Since these uncertainties do not take into account the uncertainty on the background flux or the uncertainties on the metallicity and distance cuts, we double them to yield a more realistic value . At the distance of M31, this converts to .
The MegaCam dataset can also be used to determine a lower limit on the absolute magnitude of the dwarf from the top three magnitudes of the RGB. Summing up the flux of all And XI stars yields and in the and bands respectively. Using the color equations between MegaCam magnitudes and INT magnitudes described in Ibata et al. (2006), and the INT color equations222http://www.ast.cam.ac.uk/~wfcsur/technical/photom/colours/ to derive Landolt magnitudes, yields in the Landolt V band generally used for such measures. Although a significant part of the dwarf galaxy luminosity is not taken into account by considering only the top of the RGB, this value can be normalized by comparison with the MegaCam derived magnitude of And III with the value of measured by McConnachie et al. (2005) (in doing so, we assume that both And III and And XI have a similar luminosity function shape). MegaCam observations yield , a difference of 2.3 magnitudes compared to the McConnachie et al. (2005) value. The absolute magnitude of And XI should therefore approximately be . Obviously uncertainties on this value are significant but a comparison of the CMD of Figure 3 with that of And IX and X (Zucker et al., 2004, 2006a) and Ursa Major (Willman et al., 2005) shows the RGB of And XI is less populated than that of these two other M31 satellites but more populated than that of UMa. Hence, And XI can naively be expected to be less luminous than And IX and X that have magnitudes of and but more luminous than UMa that has . This is indeed what we find, yielding confidence in the measured value and suggesting an uncertainty of the order of mag.
3.2 And XII
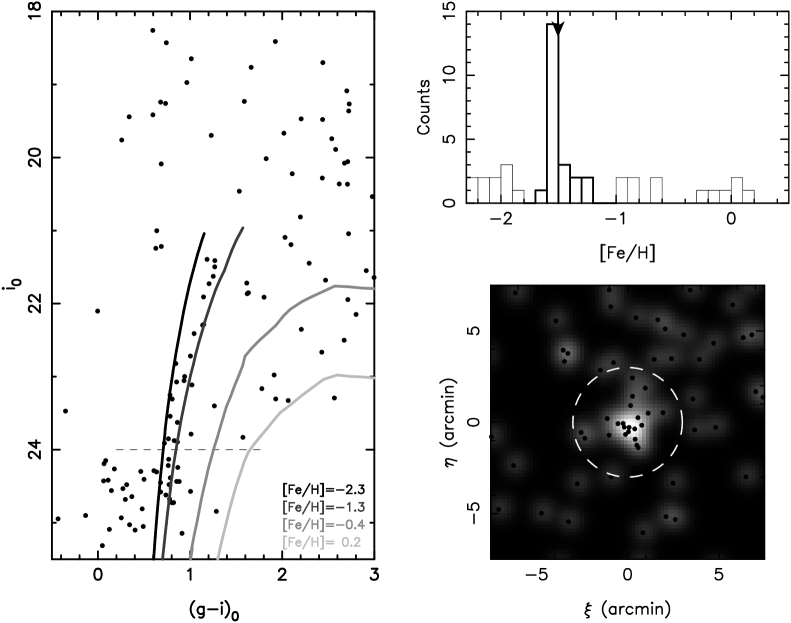
Among the three dwarf galaxies presented in this paper, And XII is the one with the least populated RGB with only stars. The CMD of stars within of its central position is shown in the left panel of Figure 4 and contains a well defined RGB between the isochrones of metallicities and . The metallicity distribution once again contains a strong peak, with a median value of . In the following only stars within the metallicity range are considered to belong to the dwarf. The distribution of these stars on the sky (bottom right panel of the same Figure) shows that, even though there are not many stars in this region of the sky, they do correspond to an overdensity, centered on . The probability that a group of stars are at the same time clustered on the sky and along a RGB is very low (see section 4), strengthening the hypothesis that And XII is a dwarf even though it is not directly visible on the MegaCam images.
The derived parameters are also consistent with those of a dwarf, though a very faint one. The half-light radius is determined as for And XI from the luminosity profiles that yield , corresponding to assuming the same distance as M31. The absolute magnitude in the Landolt V band, determined as before from the MegaCam data, is which is normalized to . A comparison with UMa ensures this value is sensible since both dwarfs contain a similar number of stars along their RGB and yield a similar absolute magnitude. However, given the low number of stars, this value has high uncertainties, of the order of .
3.3 And XIII
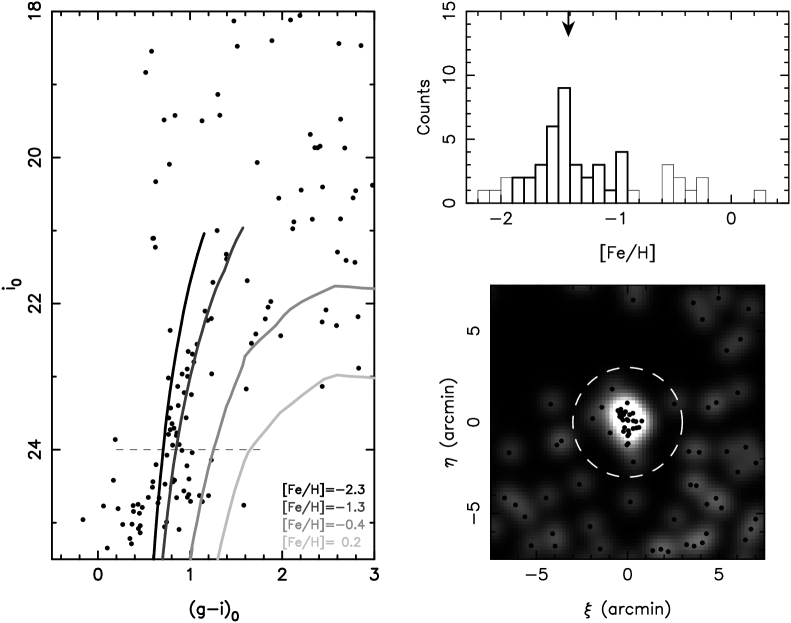
The third faint dwarf galaxy that appears in the survey is presented in Figure 5. Once again, the CMD shows a RGB populated with stars within of the central position of the dwarf. The metallicity distribution is also well peaked, with a median value of . Since this peak has no clear limits, especially of the low metallicity side, we select And XIII stars within dex of the median value. The distribution of these stars on the sky (bottom right panel of Figure 5) reveals a roughly elliptical overdensity. Even if some contaminants are not taken out of the sample with this metallicity cut, the background correction that is performed using stars with the same metallicity in an annulus between and should correct for these. The mean position of this sample of stars is and is taken as the center of the dwarf.
The number of stars in And XIII is only a little higher than in And XII, and so the parameters of the dwarf are also difficult to derive precisely. As above, we use the distance of M31 for the dwarf to account for the difficulty of determining the tip of the sparsely populated RGB. The half-light radius is determined to be , that is . The absolute magnitude in the V band, determined from the top three magnitudes of the RGB, is which is normalized as before to .
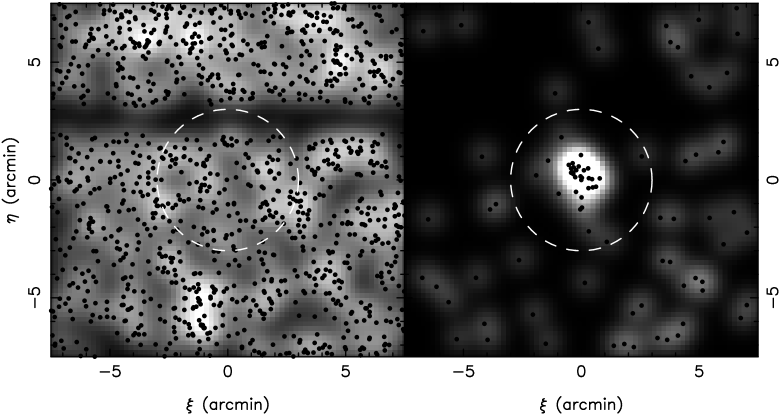
Since the only visible feature of the observed images near And XIII is a cluster of galaxies, we check that the dwarf is not artificially created by misidentified background galaxies. It is reassuring that the distribution of galaxies within a few arcminutes of And XIII is very different from that of stars (see Figure 6). A two dimension Kolmogorov-Smirnov test (Press et al., 1992) yields a very low probability () that both maps trace the same population and given that it is highly improbable that galaxies would align along a RGB, the presence of a background galaxy cluster close to the center of the dwarf has to be a coincidence and the dwarf is most certainly a genuine association of stars.
3.4 GC
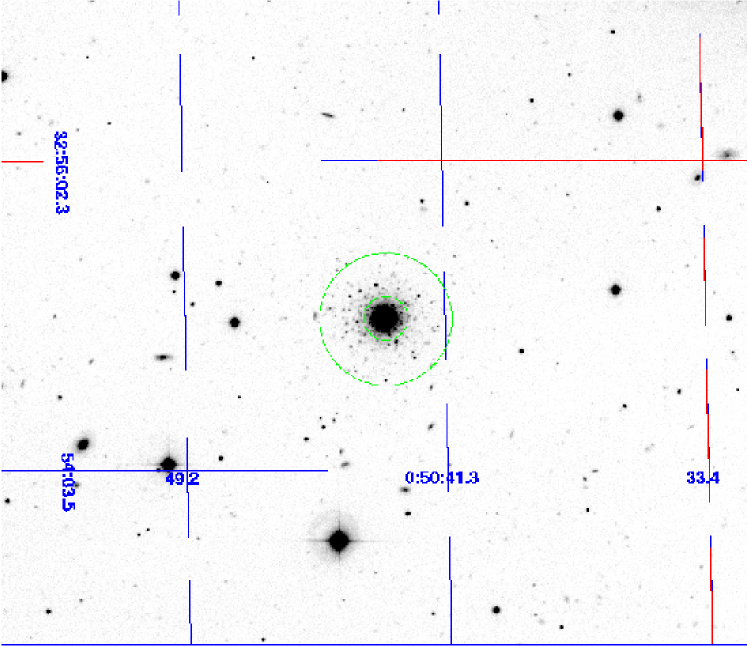
The new globular cluster discovered in the MegaCam survey is located at . Since the CASU pipeline is not well suited for separating overlapping stars in crowded regions, the region of the survey around the globular cluster was re-reduced using the Allstar package (Stetson, 1994). The Allstar reduction is used for the region between 50 and 140 pixels (that is to of the center of the cluster) with objects with considered to be stars. The CASU reduction is used over 140 pixels from the cluster to have a galaxy/star separation that is homogeneous with the rest of the survey (see the top panel of Figure 7).
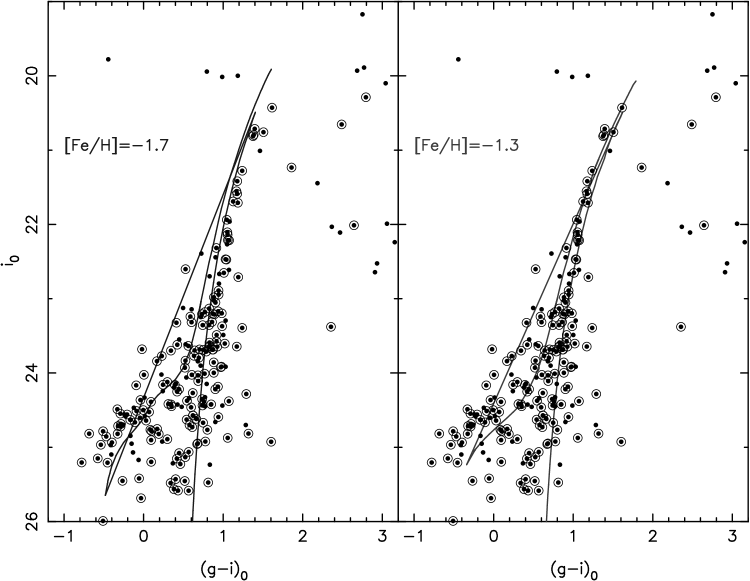
The resulting CMD is presented in Figure 7 for a region of around the cluster. Stars recovered with the Allstar reduction, which are closer to the center, are circled and help populate the RGB. Contrary to the new dwarf galaxies, the TRGB is easy to determine and the most luminous star of the branch (an Allstar object) appears to have a magnitude of . Converting this value to the Landolt band where the TRGB is mainly invariant with metallicity (see e.g. Bellazzini, Ferraro & Pancino 2001) yields 333If this star is a contaminant, the next star along the RGB has , yielding a greater distance of . However, using this distance yields a poor isochrone fit to the horizontal branch of the cluster. Hence, we prefer using as the magnitude of the tip.. Assuming a metallicity of for the cluster (see below), the absolute magnitude of the tip is (Bellazzini, Ferraro & Pancino, 2001), we derive a distance modulus of . This converts to a distance of and at a projected distance of from M31, that places the cluster at a distance of from the Andromeda galaxy which makes it the most remote M31 globular cluster currently known, but places it well within the M31 virial radius.
In addition to the well populated RGB, the CMD also shows a horizontal branch from to . Even though these magnitudes are near the limits of the MegaCam data, the absence of similar features in the CMDs of Figures 3, 4 and 5 that correspond to larger regions indicates that it is related to the cluster. This horizontal branch, along with the TRGB can be used to determine the age and metallicity of the cluster from comparison with the Girardi et al. (2004) isochrones. The best two fits are shown in the two panels of Figure 7 and correspond to the oldest isochrones available, with an age of 17.8 Gyr, and with metallicities of and assuming no enhancement. The fit with produces the best results and even though an age of 17.8 Gyr is of course improbable, younger isochrones cannot reproduce the extent of the horizontal branch, meaning the cluster contains a very old population, as is expected for a globular cluster.
To derive the absolute magnitude of the cluster, we assume most of the luminosity comes from the integrated light in the inner regions. Hence, a wide aperture is used to derive the magnitude of the cluster as a single object, yielding background corrected magnitudes of and . In this region of the sky, the extinction maps of Schlegel, Finkbeiner & Davis (1998) give , thus we obtain and . These values convert to where the uncertainties account for the color equations between MegaCam and Landolt magnitudes and the few stars in the outskirts of the cluster that are not taken into account by this method. Along with the distance modulus of obtained previously, the absolute magnitude of GC is . The half-light radius of the cluster is derived at the same time as which converts to at . Hence, GC shows typical parameters for a bright globular cluster (see e.g. Figure 7 of Huxor et al. 2004).
4 Discussion

Although the globular cluster GC is clearly visible in the MegaCam images, it is not the case for the three dwarf galaxies so it is natural to wonder if the corresponding overdensities could be only random associations of stars. To test this possibility, we generate square degrees of artificial survey with the photometric characteristics of the 9 MegaCam fields in the outer regions of the M31 halo where no stream and/or structure is apparent. These fields have an average density of 3050 stars in the CMD region that corresponds to M31 RGB stars. The number of neighbors within of each star in the artificial survey is determined and compared to the 24 and 34 stars within the same radius at the center of And XII and XIII. Figure 8 shows that the smaller of these two overdensities, And XII, is expected to be found randomly less than times in a square-degree of the survey. So even in the whole 57 square-degrees of the MegaCam survey, only such structures are expected. Moreover, this quick simulation does not take into account the clustering of stars along RGBs which means that randomly finding an And XII-like structure in the survey is even less probable. Since And XI and And XII contain more stars, we confidently conclude that the three stellar overdensities are dwarf galaxies and not random associations of stars.

Given their faintness, a detailed comparison of these dwarf galaxies with the other M31 satellites is premature and requires deeper observations. However, a few interesting points can already be discussed here. Firstly, the three dwarfs do not seem to extend the relation that is followed by the Andromeda satellites (Figure 9, left panel). The lack of other faint M31 satellites as well as the sparse RGB of the new dwarfs and the different techniques used to derive the metallicities of the various dwarfs make it hard to ascertain the extent of this offset or if it is due to a flattening of the relation. Nonetheless, at least for the Milky Way where the faint Boo and CVn dwarfs have recently been found (Belokurov et al., 2006; Zucker et al., 2006b), fainter dwarfs show more metal-poor populations. Alternatively, if as proposed by Ricotti & Gnedin (2005), these objects correspond to “true fossil” galaxies for which star formation was mainly suppressed after reionization, their simulations show that such objects are expected to have a wide metallicity spread of about 1.0 dex at the luminosity of And XI, XII and XIII (a few ). This could explain their high metallicity compared to other Andromeda satellites they tag as “true fossils” (e.g. And I, II, III, V or VI) but deeper observations are required in order to ascertain this classification by comparison with the other parameters they determine in their simulations (surface brightness, core radius, central luminosity density).
A significant difference between the new dwarfs and the other M31 satellites is their small size. Indeed, as can be seen on the right panel of Figure 9, they are two to three times smaller than the smallest previously-known Andromeda dwarfs. Although the values we derive here and recall in Table 1 have high uncertainties, these cannot account for this difference. A similar difference is observed between Andromeda and Milky Way satellites and has been proposed by McConnachie et al. (2005) to be due to differences in the formation and/or evolution of the dwarfs. In particular, Oh, Lin & Aarseth (1995) showed that a dwarf galaxy, of mass and on an orbit with semi-major axis , and that lies in the logarithmic potential of its host has a tidal radius that is proportional to where is the mass of the host halo within 444In fact, also depends on the eccentricity of the orbit of the dwarf but this dependency is weak.. Even though a precise determination of the tidal radius of the new dwarfs requires deeper observations, the measured can be used as an indicator of the size of the objects. Indeed, dwarf galaxies with a small half-light radius tend to have a small tidal radius (see e.g. Figure 5 of McConnachie et al. 2005). If And XI, XII and XIII have been lying in the M31 halo along with the other Andromeda satellites, their projected distance from M31 () makes their semi-major axis at least which is of the order of the semi-major axis of the other M31 dwarfs, implying that the observed difference in would be related to a difference in mass that should be about 10 to 30 times smaller than the other Andromeda dwarfs. While this could be due to their faintness, it has to be noted that measurements of the mass of the faint And IX (Chapman et al., 2005) and UMa (Kleyna et al., 2005) does not make them much less massive than brighter dwarfs (). Alternatively, the small size of And XI, XII and XIII could be the telltale sign of different formation and/or evolution compared to the other M31 satellites. For instance, they could have been brought into the M31 halo as satellites of a recently merged or accreted galaxy. This scenario is all the more interesting since the new dwarfs all lie within only of one another which could be an indication that they form a linked sub-group. The presence of a newly found diffuse stellar stream with not far from the three dwarfs in the M31 halo (see Ibata et al., 2006) also lends weight to this scenario, although the question of the survival of the dwarfs in such a merger remains open. The radial velocity of the dwarfs is obviously required to determine if they are linked but their faintness makes them very challenging even for spectrographs on the largest current telescopes.

If we assume that the galaxies are indeed linked, they should be at about the same distance. Under this assumption we sum up their CMDs and measure the RGB tip. This is done on Figure 10 where the MegaCam magnitudes have been converted to Landolt magnitudes. The three RGBs follow strikingly indistinguishable tracks, suggesting that these three dwarfs, apart from their luminosities, are very similar. The TRGB remains approximative but it can be determined to be within and depending on whether the four stars (3 And XI stars and one And XIII star) between the two values are considered to belong to the dwarfs or not. Assuming as before, this yields a distance of 740 to 955 kpc. In any case, this puts the dwarfs well within the virial radius of M31. Fitting the Girardi et al. (2004) isochrones with the two values derived for the tip yields metallicities of and respectively. The uncertainty on the distance modulus () will of course add to the uncertainties on the absolute magnitude and half-light radius of the dwarfs but that will not change the general conclusions presented here.
Finally, the panoramic view of the MegaCam survey can be used to provide some constraints on the missing satellite problem. Five dwarf galaxies with luminosity are found in the survey (And II, And III, And XI, And XII and And XIII). Assuming a Poissonian distribution, the survey would therefore contains satellites within the given magnitude limit. Moreover, the integration of a NFW profile along the line of sight using suitable parameters for M31 (concentration of and virial radius of 313 kpc; Klypin, Zhao & Sommerville 2002) shows that the survey covers 11% of the total M31 halo. Since satellites in the central regions of the halo tend to be harassed by tidal interaction and are more easily destroyed, the maximum number of satellites of the Andromeda galaxy with can therefore be estimated to be . Even if we assume these objects reside in massive dark matter halos of as has been measured for Ursa Major (Kleyna et al., 2005), And IX (Chapman et al., 2005) and Boo (Muñoz et al., 2006), this number is still one order of magnitude smaller than the number of CDM satellites (e.g. Stoehr et al., 2002). Thus, it seems faint dwarf galaxies cannot alone account for the so-called missing satellites except if their currently measured masses are underestimated by a factor of , for instance if they have dark matter halos that extend beyond their luminous counterpart. It has to be noted however, that larger and more diffuse structures could be missed by the visual inspection that led to the discovery of the new dwarfs. A search for these sub-structures is under way and will be presented in an up-coming paper (Martin et al., in prep.).
5 Conclusions
The inspection of the 57 square-degrees of our MegaCam survey of a quadrant of the M31 halo, from a projected distance of 50 kpc to 150 kpc, reveals the presence of four new satellites of the Andromeda galaxy down to . One of these is the farthest M31 globular cluster currently known. The other three satellites are faint dwarf galaxies that all lie within two degrees of one another, have a similar metallicity and are two to three times smaller than the smallest of previously-known M31 satellite galaxies. All these characteristics may indicate that they are linked together, have a common origin and were brought in the M31 halo by the same mechanism. Radial velocity measurements are necessary to confirm that they are kinematically associated and could also be used to determine if they exhibit the same high mass-to-light ratio that is found for the faint And IX (Chapman et al., 2005), UMa (Kleyna et al., 2005) and Boo (Muñoz et al., 2006). The sparsely populated RGBs of these new dwarfs will however prove a challenge for current telescopes. Deeper photometric observations are also required to better characterize the new structures, constrain their parameters and their stellar populations and search for tidal features in their outskirts. Their relation to the asymmetric distribution of M31 satellites (McConnachie & Irwin, 2006) would also be very interesting to study.
The MegaCam survey also gives the first opportunity to study a significant portion of a galactic halo in search of substructures without any of the bias, such as projection effects and foreground contamination, that plague Milky Way studies. From the surveyed area, we estimate that a maximum of satellites with orbit around the Andromeda galaxy, which is one order of magnitude smaller than the number of substructures expected from CDM models, except if they reside in more massive halos than currently measured. The missing satellites thus do not seem to be highly dark matter dominated dwarf galaxies unless many are even fainter or more extended than those found here.
Acknowledgments
We wish to thank the CFHT staff for performing the MegaCam observations in queue mode.
References
- Armandroff, Davies & Jacoby (1998) Armandroff T. E., Davies J. E. & Jacoby G. H. 1998, AJ 116, 2287
- Armandroff, Jacoby & Davies (1999) Armandroff T. E., Jacoby G. H. & Davies J. E. 1999, AJ 118, 1220
- Bellazzini, Ferraro & Pancino (2001) Bellazzini M., Ferraro F. R. & Pancino E. 2001, ApJ 556, 635
- Belokurov et al. (2006) Belokurov et al. 2006, ApJ submitted, astro-ph/0604355
- Bullock, Kravstov & Weinberg (2000) Bullock J. S., Kravstov A. V. & Weinberg D. H. 2000, ApJ 539, 517
- Chapman et al. (2005) Chapman S., Ibata R., Ferguson A. M. N., Lewis G., Irwin M. & Tanvir N. 2005, ApJ submitted
- Ferguson et al. (2002) Ferguson A. M. N., Irwin M. J., Ibata R. A., Lewis G. F. & Tanvir N. R. 2002, AJ 124, 1452
- Girardi et al. (2004) Girardi L., Grebel E. K. Odenkirchen M. & Choisi C. 2004, A&A 422, 205
- Grebel (2001) Grebel E. K. 2001, Ap&SS 277, 231
- Harbeck et al. (2005) Harbeck D., Gallagher J. S., Grebel E. K., Koch A. & Zucker D. B. 2005, ApJ 623, 159
- Huxor et al. (2004) Huxor A. P., Tanvir N. R., Irwin M. J., Ibata R. A., Collett J. L., Ferguson A. M. N., Bridges T. & Lewis G. F. 2004, MNRAS 360, 1007
- Ibata et al. (2001) Ibata R. A., Irwin M. J., Lewis G. F., Ferguson A. M. N. & Tanvir N. R. 2001, Nature 412, 49
- Ibata et al. (2005) Ibata R. A., Chapman S. C., Ferguson A. M. N., Lewis G. F., Irwin M. J. & Tanvir N. R. 2005, ApJ 634, 287
- Ibata et al. (2006) Ibata R. A., Martin N. F., Chapman S. C., Ferguson A. M. N., Irwin M. J., Lewis G. F. & Tanvir N. R. 2006, MNRAS submitted
- Irwin & Lewis (2001) Irwin M. & Lewis J. 2001, New Astronomy Review, 45, 105
- Kleyna et al. (2005) Kleyna J. T., Wilkinson M. I., Evans N. W. & Gilmore G. 2005, ApJ 630, L141
- Klypin et al. (1999) Klypin A., Kravstov A. V., Velenzuela O. & Prada F. 1999, ApJ 522, 82
- Klypin, Zhao & Sommerville (2002) Klypin A., Zhao H. & Sommerville R. S. 2002, ApJ 573, 597
- Mackey & Gilmore (2004) Mackey A. D. & Gilmore G. 2004, MNRAS 355, 504
- Mateo (1998) Mateo M. 1998, ARAA 36, 435
- McConnachie et al. (2004) McConnachie A. W., Irwin M. J., Lewis G. F., Ibata R. A., Chapman S. C., Ferguson A. M. N. & Tanvir N. 2004, MNRAS 351, L94
- McConnachie et al. (2005) McConnachie A. W., Irwin M. J., Ferguson A. M. N., Ibata R. A., Lewis G. F. & Tanvir N. 2005, MNRAS 356, 979
- McConnachie & Irwin (2006) McConnachie A. W. & Irwin M. J. 2006, MNRAS 365, 902
- Moore et al. (1999a) Moore B., Ghigna S., Governato F., Lake G., Quinn T., Stadel J. & Tozzi P. 1999a, ApJ 524, L19
- Moore et al. (1999b) Moore B., Quinn T., Governato F., Stadel J. & Lake G. 1999b, MNRAS 310, 1147
- Moore et al. (2001) Moore B., Calcáneo-Roldán C., Stadel J., Quinn T., Lake G., Ghigna S. & Governato F. 2001, Phys Rev D 64, 3508
- Muñoz et al. (2006) Muñoz R. R., Carlin J. L., Frinchaboy P. M., Nidever D. L., Majewski S. R. & Patterson R. J. 2006, ApJ submitted, astro-ph/0606271
- Navarro, Frenk & White (1997) Navarro J. F., Frenk C. S. & White S. D. M. 1997, ApJ 490, 493
- Oh, Lin & Aarseth (1995) Oh K. S., Lin D. N. C. & Aarseth S. J. 1995, ApJ 442, 142
- Press et al. (1992) Press W. H., Flannery B. P., Teukolsky S. A., Vetterling W. T. 1992, Numerical Recipes. Cambridge Univ. Press, Cambridge
- Ricotti & Gnedin (2005) Ricotti M. & Gnedin N. 2005, ApJ 629, 259
- Schlegel, Finkbeiner & Davis (1998) Schlegel D., Finkbeiner D. & Davis M. 1998, ApJ 500, 525
- Sommerville (2002) Sommerville R. S. 2002, ApJ 572, L23
- Stetson (1994) Stetson P. B. 1994, PASP 106, 250
- Stoehr et al. (2002) Stoehr F., White S. D. M., Tormen G. & Springel V. 2002, MNRAS 335, L84
- Tully et al. (2002) Tully R. B., Sommerville R. S., Trentham N. and Verheijen M. A. W. 2002, ApJ 569, 573
- Willman et al. (2005) Willman et al. 2005, ApJ 626, L85
- Zucker et al. (2004) Zucker et al. 2004, ApJ 612, L121
- Zucker et al. (2006a) Zucker et al. 2006a, ApJ submitted, astro-ph/0601599
- Zucker et al. (2006b) Zucker et al. 2006b, ApJ 643, L103