RHESSI Results – Time For a Rethink?
Abstract
Hard X-rays and -rays are the most direct signatures of energetic electrons and ions in the sun’s atmosphere which is optically thin at these energies and their radiation involves no coherent processes. Being collisional they are complementary to gyro-radiation in probing atmospheric density as opposed to magnetic field and the electrons are primarily 10–100 keV in energy, complementing the (100 keV) electrons likely responsible for microwave bursts.
The pioneering results of the Ramaty High Energy Solar Spectroscopic Imager (RHESSI) are raising the first new major questions concerning solar energetic particles in many years. Some highlights of these results are discussed – primarily around RHESSI topics on which the authors have had direct research involvement – particularly when they are raising the need for re-thinking of entrenched ideas. Results and issues are broadly divided into discoveries in the spatial, temporal and spectral domains, with the main emphasis on flare hard X-rays/fast electrons but touching also on -rays/ions, non-flare emissions, and the relationship to radio bursts.
1 Introduction
Major observational results from RHESSI and instrumental details have been extensively described elsewhere (e.g. lin:al-02 and other articles in that volume, and den:al-05 ) and will not be repeated here. Based on results from numerous earlier spacecraft from OGOs, OSOs and TD1A through SMM, Hinotori and Yohkoh (these three giving the first HXR images), the conventional wisdom prior to RHESSI envisaged electron and ion acceleration high in a loop near a reconnection site. Most of the hard X-rays (HXRs) and -rays were believed to originate in two bright loop footpoints by collisional thick target deceleration of fast particles with a near power-law spectrum in the dense chromosphere bro-71 , plus occasional fainter emission at or above the looptop as seen in Yohkoh mas:al-94 and sometimes even higher as seen in limb occulted flares kan-83 . Until RHESSI, apart from one balloon flight lin:sch-87 , spectral resolution was very limited, particularly in images and in (non-imaged) -rays. RHESSI has transformed this via Ge detector spectrometry, yielding high resolution spectra and spectral images in HXRs, high resolution -ray line spectroscopy, and the first -ray line images. RHESSI also excels in having an unsaturated spectral range from a few keV to ten of MeV, thus yielding data on the hot SXR plasma as well as on fast particles (see articles in special issues of Solar Phys. vol. 210, 2002 and Astrophysical Journal Letters vol. 595, 2003). While many of the RHESSI data show events with some resemblance to the canonical thick target footpoint scenario, with near power-law spectra, there are many examples deviating from this simple picture. Here the main emphasis is on these new features as they are the driving force behind the need for a rethink.
2 Imaging Discoveries and Issues
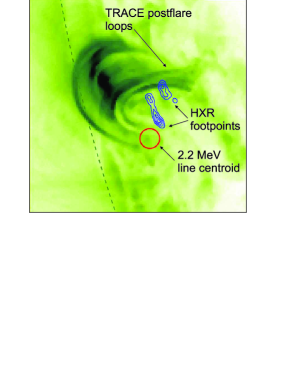
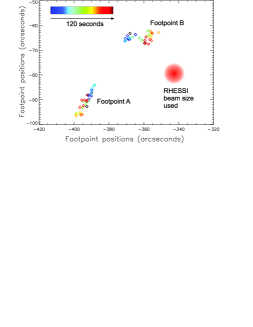
Probably the most exciting imaging discovery by RHESSI is the fact that, in at least one of the few strong -ray line events seen by RHESSI, the 2.2 MeV neutron capture line comes from a spatial location quite distinct from the source of HXRs – Figure 1 hur:al-03 . Cross-field transport is unable to explain this spatial separation and it seems it must be due to acceleration of electrons and of ions in or into quite distinct magnetic loops. The only explanation offered to date is that by Emslie, Miller and Brown ems:al-04 where the longer/shorter Alfvén travel time in larger/smaller loops favours respectively the stochastic acceleration of ions/electrons. The Doppler profiles of the -ray lines also help constrain the geometry of the loop in which the same ions move.
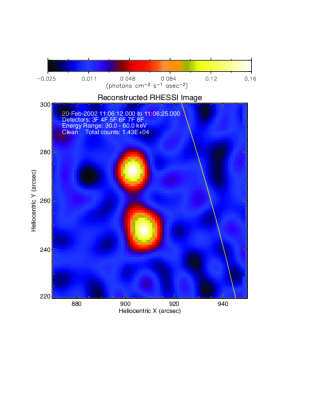
Those events which do show a classic 2-footpoint structure (e.g. Figure 2), at least within the spatial resolution limits of RHESSI, can in principle be compared with the predictions of the thick target model in terms of the spectral variation of the footpoint structure. Qualitatively, the highest energy electrons penetrate deepest so that the hardest HXR footpoints should lie lowest, and furthest apart in the loop, to an extent depending on the variation of electron energy loss rate with electron energy. On the conventional assumption of collision-dominated energy losses, Brown, Aschwanden and Kontar bro:al-02 and Aschwanden, Brown and Kontar asc:al-02 , determined the atmospheric density structure needed for the thick target model to produce the observed spectral image structure, with the results shown for one event in Figure 3 (February 20, 2002; for a HXR map see Figure 2). These show that collisions are a substantial factor in electron transport and may be the dominant factor if flare is similar to spicules (Figure 3). A lower structure requires some non-collisional energy losses to fit the model to the data. This modeling needs improving to allow for pitch angle changes and for the variation of collision cross section as the target ionisation decreases, before firm conclusions are drawn.

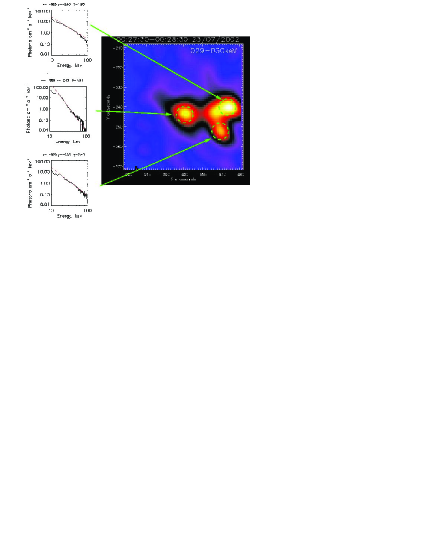
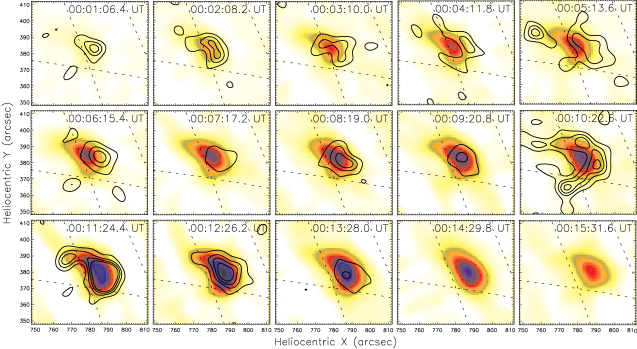
Some events show more complex HXR structure though this is in part due to higher photon fluxes enabling detection of fainter components. An example is the extensively studied event of July 23, 2002, already shown in broad context in Figure 1. Figure 4 shows that in the deka-keV HXR range the source comprises two bright footpoints, with hard spectra, and possibly a third, or at least one extended, footpoint, with a distinct fainter and softer source, possibly at or near the looptop. This event is one of those subjected most thoroughly so far to spectral image reconstruction ems:al-03 though that facet of RHESSI data reduction is still being refined.
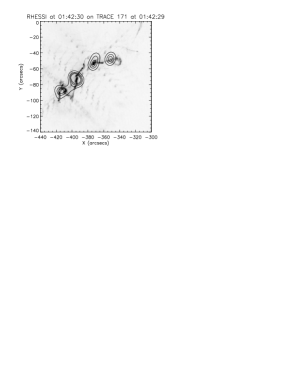
Fletcher and Hudson fle:hud-02 have studied the location and motion of RHESSI HXR ‘footpoints’ and compared them with those seen by TRACE in the XUV range and at other wavelengths (Figures 5 and 6). This reveals a relatively complex situation, as yet to be properly understood. The HXR patches are rather large, being seen as extended even at this limited resolution (8′′) but nevertheless at any moment occupied only a small part of the overall flare ribbon extent (Figure 5), their centroids moving along it as the flare progressed (Figure 6). The TRACE brightpoints are much smaller/better resolved and some of them more or less track the HXR patch centroids. Fletcher and Hudson interpret this motion as reflecting the progression of the momentarily reconnecting field lines which direct particles to the chromosphere. While this may be true, and their observed sizes the result of ‘motion’ of even smaller sources during the integration time, it is impossible in the conventional thick target model for HXR source electrons to be concentrated in regions anywhere near as small as a bundle of field lines near the very thin reconnection sheet. An intense burst requires a beam rate s-1 or a beam density where cm2 is the beam area which requires an impossible large for (1′′ square).
Veronig and Brown ver:bro-04 discovered a new class of bright coronal HXR source in which the loop (top) emission is hard and dominates to high energies, with little or no emission from the footpoints, in sharp contrast to Masuda coronal sources where the footpoints still dominate – Figure 7. Similar RHESSI events have been also studied by Sui et al. sui:al-04 .
Veronig and Brown interpret this as due to a high loop density ( m-3), consistent with the soft X-ray emission measure estimate , the coronal loop being then a collisionally thick target at electron energies up to 50–60 keV. The high loop density is also consistent with conductive evaporation driven by collisional heating in the loop top. Such an interpretation had in fact previously been hinted at for Yohkoh data kos:al-94 but such events seem to be rare and more easily seen with RHESSI’s large dynamic and spectral range.
An even more extreme class of high altitude source has been reported by Kane and Hurford kan:hur-03 where there is an elevated, long lasting, HXR source seemingly ‘detached’ from chromospheric emission. Kane, McTiernan and Hurley kan:al-04 report a particularly interesting case of coronal HXR emission seen by RHESSI for an occulted flare behind the limb, but wholly seen by Ulysses which was behind the sun.
The coronal source yields a significant fraction of the total flare HXR flux showing the presence of copious fast electrons somehow confined high in the atmosphere, somewhat akin to the long duration high altitude -ray events studied earlier by Ramaty et al. in ram:al-97 . Much work remains to be done on the detailed quantitative modelling and physical interpretation of this class of HXR event, using the much more comprehensive data available from RHESSI, Nobeyama etc. than was possible in Kane’s earlier ground-breaking stereo event studies kan-83 .
3 Temporal Domain Discoveries and Issues
The most important temporal information in RHESSI data is bound to be in the evolution of the spatial and spectral characteristics, as opposed to global light curves in single energy bands. Unravelling the raw data to produce an X-ray ‘multi-colour’ movie at high spectral and spatial resolution is computationally very demanding and can only be even remotely contemplated for intense events with ample photons. However, a great deal can be gleaned from more rudimentary temporal information such as comparison of image sequences in two well separated energy bands, whole sun light curves as a function of energy over hitherto unexplored energy ranges, and comparison of light curves/image sequences at soft and hard X-ray energies with data at wholly different energies. In these categories, among the ‘rethink’ provoking RHESSI discoveries are the following.
There has long been interest in the possibility of ‘nano’- or ‘micro’- flares being an ongoing solar coronal phenomenon, possibly involved in coronal heating. Much research in this area has been statistical in character but some papers have addressed the physics of micro-events including their possible role in supplying mass to the corona, as well as heating it. Brown et al. bro:al-00 claimed that micro-events in loops were not hot enough to provide their emission measure increase by conductive evaporation of the chromosphere. They proposed that energetic electrons of around 10 keV might instead be responsible and predicted that RHESSI might detect frequent low energy ‘hard’ X-ray micro-events from the non-flaring sun. One of RHESSI’s early discoveries was indeed that the ‘non-flaring’ sun exhibits micro HXR events of minutes’ duration at intervals of several minutes – Figure 8 kru:al-02 . The detailed physics of these remains to be investigated quantitatively but Krucker’s movies (http://sprg.ssl.berkeley.edu/~krucker) show them to be related to XUV surges seen by TRACE, and to Type III radio bursts and associated plasma waves, originating near the boundaries of HXR sources.

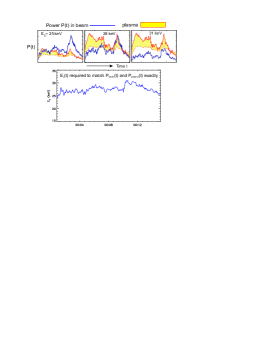
The interplay of spectral, spatial and temporal information from RHESSI is particularly clearly shown in the study by Veronig et al. ver:al-05 of the Neupert effect. The empirical Neupert effect is that the SXR light curve of a flare is well correlated with the time integral of the HXR light curve neu-68 ; den:zar-93 . The canonical interpretation is that the SXR plasma is heated by cumulative energy input from HXR emitting fast electrons. The Neupert effect has been observationally established for the impulsive phase of many flares, but in general the correlations are far from being perfect den:zar-93 ; lee:al-95 ; mct:al-99 ; ver:al-02 . These deviations were interpreted as the effect of plasma cooling and/or grounded on the idea that the physical Neupert effect should exist between the nonthermal and thermal energies and not between the HXR and SXR lightcurves. Veronig et al. quantitatively addressed this issue and suggested that the imperfect temporal correlation may be due to the fact that SXR flux depends on density and temperature, and not just on energy content, that HXR flux depends on beam spectrum as well as power, and that one must take account of plasma cooling by radiation and conduction during the event. There has of course been considerable theoretical/numerical work li:al-93 ; li:al-97 to see whether and how a Neupert effect is seen when one runs a model of the impulsive heating of a loop and follows its evolution allowing for hydrodynamics, evaporation, radiative and conductive cooling etc. The broad answer is, unsurprisingly, that one does, the Neupert effect being clearest when the loop takes longest to cool. However, such theoretical models are not the same thing as testing to see if the Neupert effect in real data can be physically attributed solely to beam heating of the hot gas after allowance for evaporation, cooling etc. That is, does the energetics of the beam input implied by real HXR data tally with the heating (or cooling) of the gas as inferred from real SXR data.
Using a rather crude model of energy transport, but one which should correct the light curves in the right sense at least, Veronig et al. ver:al-05 studied this for several flares and found the surprising result that the power into the SXR plasma is less well correlated with the beam power than are the raw SXR and HXR light curves – Figure 9. They then discuss reasons for this result including the possibility that models involving beam-heating of a single monolithic loop structure may be invalid. In line with the findings of Fletcher and Hudson fle:hud-02 mentioned in Section 2, multiple small loop events might offer an alternative and more realistic description of the global flare emission. These, however, also face serious problems since the instantaneous electron rate (s-1) is fixed by the HXR burst intensity and if one decreases the instantaneous area of injection to that of a small subloop elements one quickly reaches the point where there are simply not enough electrons for imaginable densities. In fact, filamentary beams cannot be less than around 0.1 of the loop radius thick for this reason, as well as such beams and/or their return currents being unstable. This is far thicker than the scale of current sheets.
4 Spectral Discoveries and Issues
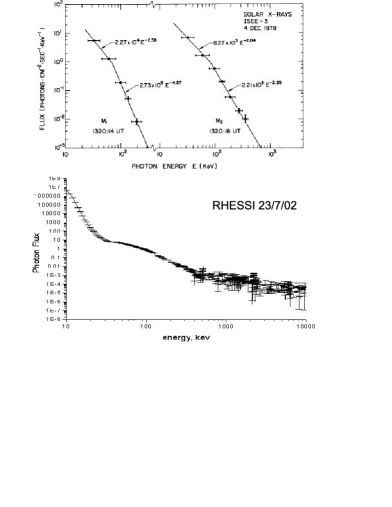
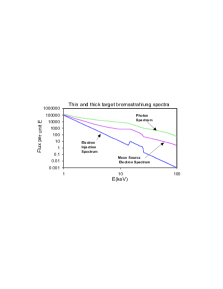
Figure 10 shows dramatically the sea-change which RHESSI’s Ge detectors have brought to flare HXR spectrometry, namely an increase in resolution from tens of keV to around 1 keV, enabling detailed spectral analysis of the bremsstrahlung continuum and resolution of individual -ray lines. The importance of this, emphasised for decades (e.g. cra:bro-86 ) lies in the fact that the mean source electron spectrum is essentially the derivative of the photon spectrum (deconvolved through the bremsstrahlung cross-section) and that the injected electron spectrum is the further deconvolution (differentiation) of the mean source electron spectrum through particle transport smearing effects.
To see this we summarise the derivation of these relationships here.
In the approximation of isotropic emission, the hard X-ray photon spectrum in solar flares is a convolution of the (density weighted volumetric) mean source electron spectrum and the cross-section for production of a photon of energy by an electron of energy , viz.
| (1) |
Thus to find from we have to solve/invert this integral equation which is always rather unstable to noise in . Put another way, the integral involved smears out features of in emitting the observable . A clear example is in the approximation (Kramers) which leads to the explicit derivative solution
| (2) |
and differentiating data always magnifies high frequency noise kon:mac-05 .
In turn, is related to the electron injection rate spectrum through the properties of electron propagation in the source. In the case of purely collisional transport the relation is bro:ems-88
| (3) |
(so that for a pure power law is two powers harder than ). Consequently details in are further smeared out in and the solution for for given is
| (4) |
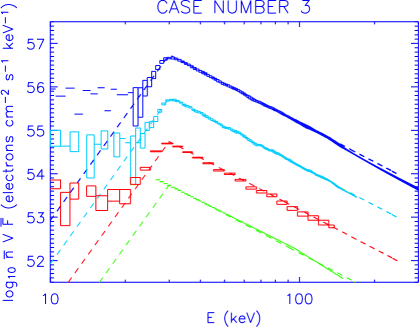
so that is sensitive to noise in and extremely sensitive to noise in This is illustrated in Figure 11 where a ‘top hat’ feature in the injected electron spectrum is seen to be smeared in the mean source spectrum and smeared further in the final observed bremsstrahlung photon spectrum.
Working backward from the photon data thus requires the careful use of regularisation algorithms to suppress the effects of spurious data noise amplification cra:bro-86 and a great deal of effort has gone into perfecting such methods tho:al-92 ; joh:lin-92 ; pia-94 ; pia:al-03 ; mas:al-03 . Recent work has aimed at testing the reliability of these methods kon:al-04 ; kon:al-05a by applying them ‘blind’ to hypothetical photon spectra generated by models of electron spectra unknown to the data analysers. Overall all the methods prove to be highly reliable, as can be seen from the example in Figure 12 the only problematic regimes being where the source electron spectrum has low electron numbers in some energy range. In such regimes the photon spectrum at energy is dominated by emission from electrons of energy , rather than , and so is a rather poor diagnostic of electron fluxes at such energies. In practice photon spectra and hence electron spectra are, on the whole, quite steeply decreasing at all energies so that the electron spectra should be quite well recovered at most for most events.
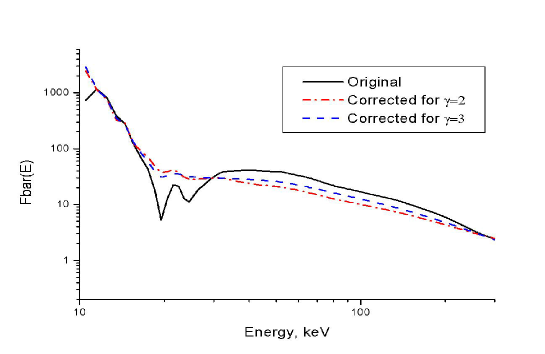
In a number of events, however, and most notably in the event of July 23, 2002, the observed HXR spectrum shows locally hard/small spectral index regions in the 30–60 keV range. When deconvolved, such photon spectra yield mean source electron spectra with a non-monotonic ‘dips’ of a kind hitherto totally unknown and of potentially great importance since their presence might rule out the canonical thick target model with purely collisional transport which can only produce a photon spectrum of local spectral index bro:ems-88 . It is therefore of vital importance to test the reality of such features as originating in the flare electrons themselves rather than in some secondary process. To date, instrumental origins such as pulse pile up have not been entirely ruled out while a major issue is the contribution to the photon spectrum of photospheric back scatter ale:bro-02 which is important in the 30–60 keV range. This arises from the Compton scattering and photoelectric absorption of downward directed photons from both free and bound electrons. Preliminary analysis of this effect by Kontar and others suggests that it can result in inference of a spurious electron spectral dip in the 30–40 keV range – Figure 13 – but that the July 23, 2002 feature 50–60 keV might be too high in energy to be attributable to albedo.
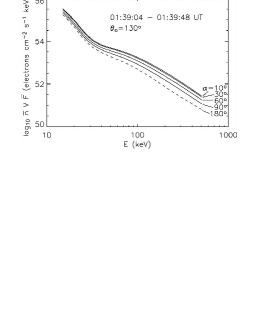
The importance of albedo in the observed signal also depends on the extent of the directivity (downward beaming) of the primary HXR source kan:al-80 . Even in the absence of albedo, source directivity affects the inferred slope and flux of the source electrons – Massone et al. mas:al-04 – Figure 14 – thus much work remains to be done before we can be confident of inferred electron spectra.
A wholly different but equally intriguing RHESSI ‘discovery’, demanding rethinking of ideas, is the relationship of the mean spectral slope of HXR spectra from HXR source electrons at the sun to the slope of interplanetary electrons at the earth. RHESSI and WIND have allowed Krucker and Kontar (private communication) to confirm, with much improved data, earlier results of Lin et al. lin:al-82 and Lin lin-85 ; lin-93 .
If all electrons are accelerated in the corona (as opposed to say separate acceleration sites in the corona and chromosphere) with spectral index then one would expect that: (a) upward interplanetary electrons would arrive at the earth with (scatter-free) index ; (b) HXR’s emitted from downward injection of such electrons into a dense collisional thick target bro-71 would produce HXRs of index ; (c) HXR’s emitted around the tenuous acceleration site would have thin target index . Krucker and Kontar, like Lin earlier, found that real flares are much closer to regime (c) than to regime (b).
This seeming violation of the predictions of the basic collisional thick target model is contrary to the RHESSI imaging results cited in Section 2 which seems in broad support of that thick target model – i.e. we do see footpoints. It is possible that interplanetary electron propagation is not scatter-free or that thick target electrons undergo non-collisional losses but in either interpretation it is strange that the transport effects are just such as to yield data close to thin target situation (c). Time indeed for some rethinking!
5 CONCLUSIONS
RHESSI data constitute the greatest breakthrough in flare fast particle studies since the first HXR detectors were launched over 30 years ago. The results will pose ‘rethink’ challenges for an entire new generation of solar physicists, all the more so when considered in the wider context of multi-wavelength data, especially in the complementary radio regime to which CESRA is dedicated.
Acknowledgements.
This work was supported by a PPARC Rolling Grant (JCB, EPK) and a Visitor Grant from the Royal Society of Edinburgh (AMV). We are grateful to Alec MacKinnon for help with the manuscript.References
- (1) R.P. Lin, B.R. Dennis, G.J. Hurford, D.M. Smith, A. Zehnder, P.R. Harvey, D.W. Curtis, D. Pankow, P. Turin, M. Bester, A. Csillaghy, M. Lewis, N. Madden, H.F. van Beek, M. Appleby, T. Raudorf, J. McTiernan, R. Ramaty, E. Schmahl, R. Schwartz, S. Krucker, R. Abiad, T. Quinn, P. Berg, M. Hashii, R. Sterling, R. Jackson, R. Pratt, R.D. Campbell, D. Malone, D. Landis, C.P. Barrington-Leigh, S. Slassi-Sennou, C. Cork, D. Clark, D. Amato, L. Orwig, R. Boyle, I.S. Banks, K. Shirey, A.K. Tolbert, D. Zarro, F. Snow, K. Thomsen, R. Henneck, A. Mchedlishvili, P. Ming, M. Fivian, J. Jordan, R. Wanner, J. Crubb, J. Preble, M. Matranga, A. Benz, H. Hudson, R.C. Canfield, G.D. Holman, C. Crannell, T. Kosugi, A.G. Emslie, N. Vilmer, J.C. Brown, C. Johns-Krull, M. Aschwanden, T. Metcalf, A. Conway: Solar Phys. 210, 3–32 (2002)
- (2) B.R. Dennis: “Review of selected RHESSI solar results”, in The High Energy Solar Corona: Waves, Eruptions, Particles (this volume)
- (3) J.C. Brown: Solar Phys. 18, 489 (1971)
- (4) S. Masuda, T. Kosugi, H. Hara, S. Tsuneta, Y. Ogawara: Nature 371, 495 (1994)
- (5) S.R. Kane: Solar Phys. 86, 355–365 (1983)
- (6) R.P. Lin, R.A. Schwartz: Astrophys. J. 312, 462–474 (1987)
- (7) G.J. Hurford, R.A. Schwartz, S. Krucker, R.P. Lin, D.M. Smith, N. Vilmer: Astrophys. J. Letts. 595, L77–L80 (2003)
- (8) A.G. Emslie, J.A. Miller, J.C. Brown: Astrophys. J. Letts. 602, L69–L72 (2004)
- (9) J.C. Brown, A.N. McClymont: Solar Phys. 49, 329–342 (1976)
- (10) A.L. MacKinnon, J.C. Brown, J. Hayward: Solar Phys. 99, 231–262 (1985)
- (11) J.C. Brown, M.J. Aschwanden, E.P. Kontar: Solar Phys. 210, 373–381 (2002)
- (12) M.J. Aschwanden, J.C. Brown, E.P. Kontar: Solar Phys. 210, 383–405 (2002)
- (13) A.G. Emslie, E.P. Kontar, S. Krucker, R.P. Lin: Astrophys. J. Letts. 595, L107–L110 (2003)
- (14) L. Fletcher, H.S. Hudson: Solar Phys. 210, 317–321 (2002)
- (15) A.M. Veronig, J.C. Brown: Astrophys. J. Letts. 603, L117–L120 (2004)
- (16) L. Sui, G.D. Holman, B.R. Dennis: Astrophys. J. 612, 546–556 (2004)
- (17) T. Kosugi, T. Sakao, S. Masuda, H. Hara, T. Shimizu, H.S. Hudson: “Hard and Soft X-ray Observations of a Super-Hot Thermal Flare of 6 February, 1992”, in Proceedings of Kofu Symposium (1994), pp. 127–129
- (18) S.R. Kane, G.J. Hurford: Advances in Space Research 32, 2489–2493 (2003)
- (19) S.R. Kane, J.M. McTiernan, K. Hurley: American Astronomical Society Meeting Abstracts 204 (2004)
- (20) R. Ramaty, N. Mandzhavidze, C. Barat, G. Trottet: Astrophys. J. 479, 458 (1997)
- (21) J.C. Brown, S. Krucker, M. Güdel, A.O. Benz: Astron. Astrophys. 359, 1185–1194 (2000)
- (22) S. Krucker, S. Christe, R.P. Lin, G.J. Hurford, R.A. Schwartz: Solar Phys. 210, 445–456 (2002)
- (23) A.M. Veronig, J.C. Brown, B.R. Dennis, R.A. Schwartz, L. Sui, A.K. Tolbert: Astrophys. J. 621, 482–497 (2005)
- (24) W.M. Neupert: Astrophys. J. Letts. 153, L59–64 (1968)
- (25) B.R. Dennis, D.M. Zarro: Solar Phys. 146, 177–190 (1993)
- (26) T.T. Lee, V. Petrosian, J.M. McTiernan: Astrophys. J. 448, 915–924 (1995)
- (27) J.M. McTiernan, G.H. Fisher, P. Li: Astrophys. J. 514, 472–483 (1999)
- (28) A. Veronig, B. Vršnak, B.R. Dennis, M. Temmer, A. Hanslmeier, J. Magdalenić: Astron. Astrophys. 392, 699–712 (2002)
- (29) P. Li, A.G. Emslie, J.T. Mariska: Astrophys. J. 417, 313–319 (1993)
- (30) P. Li, J.M. McTiernan, A.G. Emslie: Astrophys. J. 491, 395 (1997)
- (31) I.J.D. Craig, J.C. Brown: Inverse Problems in Astronomy (Adam Hilger, 1986)
- (32) J.C. Brown, A.G. Emslie, E.P. Kontar: Astrophys. J. Letts. 595, L115–L117 (2003)
- (33) E.P. Kontar, A.L. MacKinnon: Solar Phys. 227, 299–310 (2005)
- (34) J.C. Brown, A.G. Emslie: Astrophys. J. 331, 554–564 (1988)
- (35) A.M. Thompson, J.C. Brown, I.J.D. Craig, C. Fulber: Astron. Astrophys. 265, 278–288 (1992)
- (36) C.M. Johns, R.P. Lin: Solar Phys. 137, 121–140 (1992)
- (37) M. Piana: Astron. Astrophys. 288, 949–959 (1994)
- (38) M. Piana, A.M. Massone, E.P. Kontar, A.G. Emslie, J.C. Brown, R.A. Schwartz: Astrophys. J. Letts. 595, L127–L130 (2003)
- (39) A.M. Massone, M. Piana, A. Conway, B. Eves: Astron. Astrophys. 405, 325–330 (2003)
- (40) E.P. Kontar, M. Piana, A.M. Massone, A.G. Emslie, J.C. Brown: Solar Phys. 225, 293–309 (2004)
- (41) E.P. Kontar, A.G. Emslie, M. Piana, A.M. Massone, J.C. Brown: Solar Phys. 226, 317–325 (2005)
- (42) G.D. Holman: Astrophys. J. 586, 606–616 (2003)
- (43) R.C. Alexander, J.C. Brown: Solar Phys. 210, 407–418 (2002)
- (44) E.P. Kontar, A. MacKinnon, J.C. Brown: Astron. Astrophys. submitted (2005)
- (45) S.R. Kane, K.A. Anderson, W.D. Evans, R.W. Klebesadel, J.G. Laros: Astrophys. J. 239, L85–L88 (1980)
- (46) A.M. Massone, A.G. Emslie, E.P. Kontar, M. Piana, M. Prato, J.C. Brown: Astrophys. J. 613, 1233–1240 (2004)
- (47) R.P. Lin, R.A. Mewaldt, M.A.I. van Hollebeke: Astrophys. J. 253, 949–962 (1982)
- (48) R.P. Lin: Solar Phys. 100, 537–561 (1985)
- (49) R.P. Lin: Advances in Space Research 13, 265–273 (1993)