The energy dependence of burst oscillations from the accreting millisecond pulsar XTE J1814-338
Abstract
The nature of the asymmetry that gives rise to Type I X-ray burst oscillations on accreting neutron stars remains a matter of debate. Of particular interest is whether the burst oscillation mechanism differs between the bursting millisecond pulsars and the non-pulsing systems. One means to diagnose this is to study the energy dependence of the burst oscillations: here we present an analysis of oscillations from 28 bursts observed during the 2003 outburst of the accreting millisecond pulsar XTE J1814-338. We find that the fractional amplitude of the burst oscillations falls with energy, in contrast to the behaviour found by Muno et al. (2003) in the burst oscillations from a set of non-pulsing systems. The drop with energy mirrors that seen in the accretion-powered pulsations; in this respect XTE J1814-338 behaves like the other accreting millisecond pulsars. The burst oscillations show no evidence for either hard or soft lags, in contrast to the persistent pulsations, which show soft lags of up to 50 s. The fall in amplitude with energy is inconsistent with current surface mode and simple hot spot models of burst oscillations. We discuss improvements to the models and uncertainties in the physics that might resolve these issues.
keywords:
binaries: general—stars:individual (XTE J1814-338)—stars:neutron—stars:rotation—X-rays:binaries—X-rays:bursts1 Introduction
The neutron star Low Mass X-ray Binaries (LMXBs) are neutron stars accreting from low-mass companions that over-fill their Roche lobes. Of these systems some, the accreting millisecond pulsars, are also observed as X-ray pulsars. Of the 160 known non-pulsing LMXBs, nearly half exhibit Type I X-ray bursts due to unstable nuclear burning of accreting material. High frequency modulations of the X-ray lightcurve, known as burst oscillations, have now been detected in the bursts from twelve of these systems (see the recent review by Strohmayer & Bildsten (2006)). Of the seven known accreting millisecond pulsars, three exhibit bursts. Two of these systems, SAX J1808.4-3658 (hereafter J1808) and XTE J1814-338 (hereafter J1814), have burst oscillations.
For the pulsars, the burst oscillation frequency is at or very close to the known spin frequency of the star (Chakrabarty et al., 2003; Strohmayer et al., 2003). This suggests that the rotation modulates an asymmetry on the burning surface that is near-stationary in the corotating frame. For the non-pulsars the situation is less clear, because there is no independent measure of the spin frequency. The fact that the frequency is highly stable from burst to burst, however (Strohmayer et al., 1998; Muno, Özel & Chakrabarty, 2002), implies that there is at least a strong dependence on stellar spin. The detection of highly coherent oscillations lasting several hundred seconds during a superburst from the LMXB 4U 1636-356 adds further support to this hypothesis (Strohmayer & Markwardt, 2002a).
The precise nature of the brightness asymmetry is as yet unclear. The simplest possibility is uneven distribution of fuel, leading to patchy burning. For the pulsars we know that initial fuel distribution is asymmetric, but the fuel could spread rapidly over the surface. For the non-pulsars there is no evidence of asymmetric fuel deposition, although there are several mechanisms that might render this process (and the associated pulsations) undetectable (Brainerd & Lamb, 1987; Kylafis & Klimmis, 1987; Wood, Ftaclas & Kearney, 1988; Mészáros, Riffert & Berthiaume, 1988; Cumming, Zweibel & Bildsten, 2001; Titarchuk, Cui & Wood, 2002). Alternate mechanisms that do not rely on asymmetric fuel distribution include the development of vortices driven by the Coriolis force (Spitkovsky, Levin & Ushomirsky, 2002), or global modes in the burning surface layers (McDermott & Taam, 1987; Lee, 2004; Heyl, 2004; Lee & Strohmayer, 2005; Cumming, 2005; Piro & Bildsten, 2005).
One means of diagnosing the nature of the asymmetry is to study the energy dependence of the burst oscillations. One can study both the dependence of amplitude on energy, and the relative phases of the waveforms as a function of energy. A “soft lag” implies that the soft (low energy) pulse arrives later in phase than the hard (high energy) pulse, and vice versa. Muno, Özel & Chakrabarty (2003) examined the energy dependence expected for a simple hot spot model, generating simulated Rossi X-ray Timing Explorer (RXTE) Proportional Counter Array (PCA) lightcurves for neutron stars with a circular uniform temperature hot spot on a cooler background. The temperature contrast between the spot and the rest of the star, coupled with Doppler effects due to the star’s rotation, leads naturally to a rise in fractional amplitude with energy in the 3-20 keV band. The hot spot model also predicts soft lags. Models where the burst oscillations are caused by surface modes also predict a rise in fractional amplitude with energy (Heyl, 2005; Piro & Bildsten, 2006). In most cases the mode models predict soft lags, although Lee & Strohmayer (2005) found hard lags for a restricted subset of possible geometries.
The most comprehensive study to date of burst oscillations from the non-pulsing LMXBs, using RXTE PCA data, found that fractional amplitude rises with energy over the 3-20 keV energy band (Muno, Özel & Chakrabarty, 2003). The authors show that the observations are compatible with the simple hot spot model if the bulk of the stellar surface (away from the hot spot) emits in the lower part of the PCA energy band. The data are also compatible with surface mode models (Piro & Bildsten, 2006), provided that the required amplitudes can be excited.
Muno et al. also examined whether there were phase lags between soft and hard photons. For most bursts the data were consistent with there being no phase lag; for 13 of 54 bursts studied the data were inconsistent at the 90% confidence level with being constant. In these bursts the trend was for the hard photons to lag the soft photons by up to 0.12 cycles, whereas both simple hot spot and mode models predict soft lags. The authors considered several mechanisms that might reverse a soft lag. They concluded that inverse Compton scattering of soft photons to higher energies by a hot corona of electrons was the most likely candidate (Miller, 1995). The observational implications of such a corona, however, and its behaviour during a burst, remain to be worked out in detail.
To date there has been no study reporting the energy dependence of the burst oscillations of the accreting millisecond pulsars. Given the possibility that the burst oscillation mechanism may differ from that operating in the non-pulsing sources, this is clearly an omission. In this paper we attempt to rectify this by presenting an analysis of the energy dependence of the burst oscillations of J1814.
The source was first detected in outburst on 2003 June 3 by the RXTE Galactic bulge monitoring campaign. Its status as a millisecond pulsar was confirmed by a longer observation on June 5 (Markwardt & Swank, 2003). The pulsar has a spin frequency of 314.36 Hz, resides in a binary with orbital period 4.275 hr, and has a minimum companion mass of (Markwardt, Strohmayer & Swank, 2003). The binary orbit is the widest of the seven known accreting millisecond pulsars. J1814 remained in outburst until mid-July 2003, and in this time 28 Type I X-ray bursts were observed, all with detectable burst oscillations at the spin frequency (Strohmayer et al., 2003). The bursts show significant harmonic content, which could be used to constrain the equation of state and the system geometry (Bhattacharyya et al., 2005). A detailed study by Watts, Strohmayer & Markwardt (2005) found that there is no evidence for fractional amplitude variation or frequency shifts in any of the bursts apart from the one burst that appears to show photospheric radius expansion. For most of the bursts, fractional amplitude is consistent with that of the persistent pulsations, although there is a small population of bursts with amplitudes that are substantially lower. For the first harmonic, substantial differences between the burst and accretion-powered oscillations indicate that hot spot geometry is not the only factor giving rise to harmonic content in the latter. There are however no detectable phase shifts between the burst and accretion-powered pulsations (Strohmayer et al., 2003), suggesting a model where the presence of the magnetic field somehow leads to a temperature asymmetry centered on the polar cap when the burst ignites (by allowing additional fuel build-up, for example). In this complementary study we test the models further by examining the energy dependence of the burst oscillations, comparing the behaviour to that of the accretion-powered pulsations. Section 2 details our method of analysis and our results. In Section 3 we discuss our findings in the light of current burst oscillation models, and outline areas for future theoretical study.
2 Data analysis
2.1 Methodology
Almost all of the PCA data for the outburst is event mode data with 125 s time resolution and 64 energy bins covering the range 2 - 120 keV. The exception is the first burst, which was recorded in GoodXenon mode, which has higher time and energy resolution (1s and 256 energy bins). Event mode data overruns, which are often seen in the bursts of brighter sources, were not seen in any of the J1814 bursts. The data were barycentered prior to analysis, using the JPL DE405 ephemeris and the source position determined from PCA scans (Markwardt & Swank, 2003; Krauss et al., 2005).
Computation of fractional amplitudes is done in two ways. We start by using the statistic (Buccheri et al., 1983; Strohmayer & Markwardt, 2002b). This measure is very similar to the standard power spectrum computed from a Fourier transform, but does not require that the event data be binned. It is defined as
| (1) |
where is the number of harmonics summed (we use throughout this paper), is the total number of photons, and is an index applied to each photon. The phase calculated for each photon is
| (2) |
where is the frequency model and is the arrival time of the photon relative to some reference time. We use a frequency model in which the intrinsic spin rate is modified by orbital Doppler shifts using the best fit orbital ephemeris. Given a measured , which we call , the probability of the true signal power lying between 0 and is given by:
| (3) |
(Groth, 1975; Vaughan et al., 1994). We take the best estimate for to be that for which . Given this the RMS fractional amplitude is then given by
| (4) |
where is the number of photons due to background accumulated in the energy band of interest during the observation period. is estimated using the standard FTOOLS routine pcabackest and the PCA background models.
The second method used is to generate a folded pulse profile (using the frequency model) and then fit a sinusoidal model with as many harmonics as necessary. We use this method to check the fractional amplitudes computed using the statistic. Pulse profile fitting also allows us to calculate phase shifts between the different energy bands, something that is not possible using the statistic alone. A more extensive discussion of both of these methods is given in Section 2.1 of Watts, Strohmayer & Markwardt (2005).
The other issue to consider when computing fractional amplitudes for pulsar burst oscillations is that the accretion process may continue during the bursts. If this is the case then the measured fractional amplitude will contain contributions from both the burst process and the accretion process:
| (5) |
and are the number of source photons arising from the burst and accretion processes respectively, with and being the fractional amplitudes of the two different processes. The total number of source photons is . Since we are not always in the regime where we will need to estimate and in order to check whether differs substantially from that measured. We do this in Section 2.2.
2.2 Accretion-powered pulsations
We start by folding together data from the whole outburst to generate a high resolution plot of amplitude and phase lags against energy for the accretion-powered pulsations. Figure 1 shows the behaviour of amplitude against energy, for both the fundamental and first harmonic. There is a clear drop in amplitude with energy for the fundamental, of about 2% RMS over the 2-20 keV band. The amplitude of the first harmonic, by contrast, varies little with energy. Figure 2 shows the phase shifts between the different energy bands for the fundamental. Soft lags of up to 50 s ( 0.015 cycles) develop over the range 2-7 keV, with the lags levelling off at higher energies. The same behaviour is seen in the phase shifts computed using the first harmonic.


This behaviour mirrors that seen in the accretion-powered pulsations of the other millisecond pulsars: J1808 (Cui, Morgan & Titarchuk, 1998; Gierliński, Done & Barret, 2002), XTE J0929-314 (Galloway et al., 2002), XTE J1807-294 (Kirsch et al., 2004), IGR J00291+5934 (Galloway et al., 2005) and XTE J1751-305 (Gierliński & Poutanen, 2005) all show a drop of fractional amplitude with energy within the PCA energy band. The other sources also show soft lags, although at only 50 s the J1814 lags are smaller than those measured for the other systems. Detailed spectral modelling for J1808 by Gilfanov et al. (1998), Gierliński, Done & Barret (2002) and Poutanen & Gierliński (2003) suggests that the amplitude drop and lags can be explained by the presence of a hard Comptonized component due to boundary layer emission together with a softer blackbody component due to a hot spot at the footpoint of the accretion channel. Similar detailed modelling for J1814, which has a harder spectrum than J1808 (Markwardt, Strohmayer & Swank, 2003), has yet to be done.
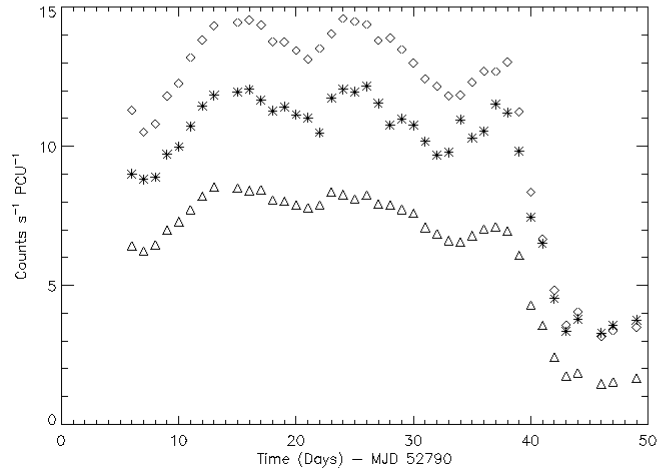
In order to correct for the accretion contribution recorded during the bursts, we also need to know whether the properties of the persistent pulsations vary over the course of the outburst. Figure 3 shows the change in the countrate (excluding bursts) for the three energy bands 2-5 keV, 5-10 keV, and 10-20 keV. The evolution of fractional amplitude (at the fundamental frequency) is shown in Figure 4. The trend of amplitude dropping with energy is apparent over the whole outburst, although the magnitude of the drop does vary between 1% and 3% RMS over the outburst. The phase shifts between the different energy bands are shown in Figure 5. Again the soft lags persist throughout, but get noticeably larger at the end of the outburst, when the accretion rate drops. It would be interesting to see if such a variation in phase lag with accretion rate is detected in any of the other millisecond pulsars.


2.3 Burst oscillations
The proportion of photons in the different energy bands for each of the bursts is shown in Figure 6. For most of the bursts the proportions are very similar. For the six faintest bursts, the proportions in the higher energy bands drop, as might be expected given that these bursts have lower peak temperatures (Strohmayer et al., 2003). Similarly, for the brightest burst, the proportion in the highest energy band rises. We define the duration of the burst as to be the time for which the countrate in a given energy band exceeds the ambient countrate by a factor of 1.5. Using this definition, burst duration is shorter at higher energies.

We start by considering each of the bursts separately, computing fractional amplitudes and phase shifts for the three energy bands 2-5 keV, 5-10 keV and 10-20 keV. The fractional amplitudes (at the fundamental frequency) for all of the bursts are shown in Figure 7, and summarized in columns 2-4 of Table 1 (for more general data on each burst see Table 1 of Watts, Strohmayer & Markwardt (2005)). More detailed plots for four example bursts are shown in Figure 8. We find that burst amplitude is lower in the 10-20 keV band than in the 2-5 keV band for 25 of the 28 bursts. Treating each burst as an independent test, we find that we can rule out the hypothesis that fractional amplitude is constant with energy at a level greater than 3. The hypothesis that fractional amplitude rises with energy can be ruled out with an even higher degree of confidence.
| Index | RMS fractional amplitude (%) | / | Accretion-corrected amplitudes | ||||||||
|---|---|---|---|---|---|---|---|---|---|---|---|
| 2-5 keV | 5-10 keV | 10-20 keV | 2-5 keV | 5-10 keV | 10-20 keV | 2-5 keV | 5-10 keV | 10-20 keV | |||
| 1 | 8.4 0.7 | 8.0 0.7 | 0.24 | 0.31 | 0.78 | 7.9 | 7.5 | 1.5 | |||
| 2 | 9.8 0.6 | 9.9 0.5 | 11.0 1.0 | 0.11 | 0.09 | 0.15 | 9.8 | 10.0 | 11.3 | ||
| 3 | 11.4 0.6 | 9.8 0.5 | 0.15 | 0.09 | 0.17 | 11.6 | 9.8 | 8.1 | |||
| 4 | 10.3 0.5 | 10.0 0.4 | 8.7 0.8 | 0.19 | 0.11 | 0.14 | 10.3 | 10.0 | 8.5 | ||
| 5 | 11.6 0.8 | 10.8 0.6 | 0.17 | 0.12 | 0.19 | 11.7 | 10.9 | 10.4 | |||
| 6 | 9.6 0.8 | 9.1 0.8 | 0.35 | 0.34 | 0.89 | 8.9 | 8.5 | 6.9 | |||
| 7 | 11.8 0.5 | 11.0 0.4 | 10.5 0.9 | 0.20 | 0.14 | 0.20 | 11.9 | 11.1 | 10.6 | ||
| 8 | 12.2 0.7 | 11.0 0.7 | 0.31 | 0.34 | 0.67 | 12.3 | 11.2 | 10.8 | |||
| 9 | 9.0 0.7 | 8.9 0.6 | 0.21 | 0.23 | 0.41 | 8.3 | 8.4 | 6.7 | |||
| 10 | 12.7 0.5 | 11.3 0.4 | 8.8 0.9 | 0.19 | 0.16 | 0.22 | 12.8 | 11.3 | 8.4 | ||
| 11 | 11.0 0.5 | 11.4 0.5 | 9.2 0.9 | 0.18 | 0.12 | 0.22 | 10.8 | 11.4 | 8.9 | ||
| 12 | 11.4 0.5 | 11.2 0.4 | 10.1 0.9 | 0.19 | 0.14 | 0.26 | 11.3 | 11.1 | 9.9 | ||
| 13 | 14.1 0.6 | 11.0 0.5 | 10.5 0.9 | 0.14 | 0.17 | 0.33 | 14.4 | 10.9 | 10.4 | ||
| 14 | 11.1 1.0 | 11.5 1.0 | 0.26 | 0.26 | 0.51 | 10.9 | 11.5 | 7.8 | |||
| 15 | 11.7 0.5 | 11.7 0.4 | 10.0 0.8 | 0.17 | 0.13 | 0.23 | 11.8 | 11.8 | 10.1 | ||
| 16 | 11.5 0.6 | 11.2 0.5 | 0.16 | 0.14 | 0.18 | 11.4 | 11.2 | 7.9 | |||
| 17 | 11.4 0.5 | 11.1 0.5 | 10.5 0.9 | 0.20 | 0.13 | 0.24 | 11.4 | 11.1 | 10.6 | ||
| 18 | 11.4 0.5 | 10.8 0.4 | 9.3 0.8 | 0.13 | 0.11 | 0.14 | 11.4 | 10.8 | 9.3 | ||
| 19 | 11.7 0.8 | 10.8 0.8 | 0.41 | 0.44 | 0.58 | 11.9 | 10.9 | 8.1 | |||
| 20 | 10.7 0.6 | 10.5 0.5 | 0.17 | 0.12 | 0.15 | 10.6 | 10.4 | 6.9 | |||
| 21 | 12.1 0.6 | 11.0 0.5 | 0.13 | 0.12 | 0.22 | 12.1 | 11.1 | 9.0 | |||
| 22 | 12.1 0.5 | 11.7 0.4 | 10.1 0.8 | 0.20 | 0.16 | 0.27 | 12.2 | 11.7 | 10.0 | ||
| 23 | 11.7 0.6 | 11.5 0.5 | 9.7 0.9 | 0.11 | 0.09 | 0.18 | 11.6 | 11.5 | 9.5 | ||
| 24 | 12.2 0.6 | 12.0 0.5 | 0.16 | 0.13 | 0.23 | 12.1 | 12.1 | 7.6 | |||
| 25 | 11.5 0.7 | 11.4 0.6 | 0.21 | 0.14 | 0.28 | 11.4 | 11.4 | 9.6 | |||
| 26 | 10.9 0.5 | 11.8 0.4 | 11.0 0.8 | 0.14 | 0.11 | 0.30 | 10.8 | 11.8 | 10.8 | ||
| 27 | 11.4 0.5 | 10.7 0.5 | 11.4 1.0 | 0.19 | 0.10 | 0.23 | 11.1 | 10.5 | 11.0 | ||
| 28 | 0.04 | 0.02 | 0.02 | 3.5 | 3.7 | 1.8 | |||||


The phase shifts between the different energy bands for each burst are shown in Figure 9. There is no evidence for either hard or soft lags; the data are compatible with there being no phase shift.

In order to verify these results, we folded together data from all of the bursts to generate a combined profile. We find a drop of fractional amplitude with energy of 3% RMS over the 2-20 keV band, a steeper drop than that seen in the persistent pulsations (Figure 10). The phase shifts of the combined profile, for two energy binnings, are shown in Figure 11. The data are consistent with there being no phase shift, and we can rule out at the 3 level hard or soft lags of greater than 0.015 cycles over the 2-20 keV band. We would have been sensitive to lags of the magnitude seen in the accretion-powered pulsations were such lags present.


3 Discussion
The burst oscillations of J1814 exhibit a drop in fractional amplitude with energy of a few percent RMS across the 2-20 keV band. In addition the bursts show no evidence for phase shifts between soft and hard photons; we can rule out at the 3 level shifts greater than 0.015 cycles over the 2-20 keV band. In this section we discuss these results in the context of the various burst oscillation models.
3.1 Consistency with existing burst oscillation models
We start by considering models where surface modes cause the brightness asymmetry. The mode models discussed by Heyl (2005); Lee & Strohmayer (2005) and Piro & Bildsten (2006) all predict a rise of amplitude with energy, although the gradient of the rise depends on various neutron star parameters. Since we can rule out a rise, or even a constant amplitude, with a high degree of confidence, the amplitude data are inconsistent with these models. The phase lag data do not provide any additional constraint, since the models of (for example) Lee & Strohmayer (2005) predict anything from hard lags of 0.04 cycles to soft lags of 0.1 cycle depending on the neutron star properties. Although we can rule out lags greater than 0.015 cycles there are still models that would fit the phase lag data.
The other class of models that have been studied in any detail are hot spot models. These models are purely phenomenological, in that the physics that might give rise to a hot spot remains as yet unclear. Like the mode models, the simple one-temperature hot spot models studied by Muno, Özel & Chakrabarty (2003) also predict a rise of amplitude with energy, although again the magnitude of the rise depends on the neutron star properties. The models studied by Muno et al. also predict soft lags of least 0.02 cycles over the RXTE energy band. Any phase lags present in the burst oscillations of J1814 are smaller than this limit.
We are therefore left with several options. One possibility is that the burst oscillation properties are consistent with existing mode/hot spot models but are masked by the presence of accretion-powered pulsations. We examine this in more detail in Section 3.2, and show that the accretion process would have to be disrupted substantially by the bursts to explain the observations. A second option is that existing models are not adequate to explain the observations. In Section 3.3 we explore whether a more complex surface temperature gradient might lead to consistency with the observations.
3.2 Masking by the accretion pulsations
Unless the accretion process is completely disrupted by the burst, the measured fractional amplitude will contain contributions from both accretion and burst pulsations. Separating the two contributions is not trivial because in this source they are phase-locked (Strohmayer et al., 2003). The persistent pulsations of J1814 do indeed show a drop in fractional amplitude with energy of 1-3% RMS over the 2-20 keV energy band (during the main portion of the outburst), so masking is not inconceivable. To proceed we need to estimate the magnitude of the accretion contribution to Equation (5).
We start by making the simple assumption that both the accretion rate and the amplitude/energy relation of the accretion-powered pulsations remain in their pre-burst state, as presented in Section 2.2, during a burst. Columns 5-7 of Table 1 give an estimate of the ratio of accretion to burst photons over the duration of the burst, computed from the daily average accretion rate at the time of the burst. In Columns 8-10 we combine this estimate with the daily average fractional amplitude for the accretion-powered pulsations to estimate , using Equation (5). Although the accretion correction does make some small quantitative changes, it does not change the qualitative behaviour with energy for any of the bursts. Unless the accretion contribution differs dramatically at the time of the bursts from that observed normally, the burst fractional amplitude still falls with energy. So let us now consider the magnitude of changes to the accretion pulsations, compared to the properties measured immediately prior to each bursts, that would be necessary to mask burst pulsations whose fractional amplitude rises with energy.
If the accretion rate remains at the pre-burst level, the fractional amplitude of the accretion pulsations must fall more steeply with energy during the burst than it does normally. Either the amplitude at low energies must rise, or the amplitude at higher energies fall, or both. For most of the bursts the ratio of accretion to burst photons is less than 0.3 (Table 1). The fractional amplitude would have to change by several % RMS to have the desired effect. Whether the burst process could lead to this level of disruption is not known, but it seems unlikely. A smaller change in fractional amplitude would be required if the accretion rate rose during a burst, boosting the ratio of accretion to burst photons. The effect of bursts on accretion rate is however unclear. Naively one might expect the radiation pressure to hinder the accretion process. But the radiation may also remove angular momentum, increasing the accretion rate (Walker & Mészáros, 1989; Walker, 1992; Miller & Lamb, 1993; Miller, 1995; Ballantyne & Everett, 2005). A substantial rise in accretion rate seems however unlikely, since the burst spectra are well-fit by a single temperature blackbody, and there is no spectral evidence for an enhanced accretion component.
The one-temperature hot spot models, and many of the mode models, predict burst oscillations with detectable soft lags. This could only be masked by the accretion process if the accretion-powered pulsations exhibit hard lags during bursts. This would be a reversal of the normal behaviour, requiring substantial disruption of the accretion process by the burst. Whether or not this is plausible is a topic for future study.
3.3 Hot spot with temperature gradient
The evidence presented in Strohmayer et al. (2003) and Watts, Strohmayer & Markwardt (2005) suggests that the most promising model for the burst oscillations of J1814 is a hot spot that develops at the magnetic footpoint, perhaps due to a disparity in fuel build-up in this region. We will therefore focus on the hot spot model in more detail, and ask whether some simple alterations to the one-temperature hot spot models of Muno, Özel & Chakrabarty (2003) might enable us to explain the energy-dependences reported in this paper.
Although most modelling to date has focused on uniform, single temperature hot spots, several processes involved in burst generation would seem to favour some degree of temperature variation across a hot spot. For example, we expect that burning must spread in some fashion such that regions which ignite first will have a longer time to cool than portions of a hot spot which ignite later. The time asymmetry introduced by spreading can thus lead to a temperature asymmetry. Alternatively, if accretion is substantially mediated by the magnetic field, then the quantity of fuel could vary in a systematic fashion in the vicinity of the magnetic footpoint. Such a fuel asymmetry could also impart a temperature gradient within the hot spot.
In order to explore the impact of a temperature gradient we have carried out model calculations using circular hot spots with a temperature profile across the spot. It is not our intention to fit detailed models to the data, only to examine whether a temperature gradient might allow us to fit the amplitude-energy relation. We use the model for emission of photons from a rotating neutron star surface described by Strohmayer (2004). The model includes bending of photon paths in a Schwarzschild geometry as well as relativistic beaming and gravitational red-shifts. Each surface element within the hot spot is assumed to emit, locally, a black body spectrum. The temperature distribution is azimuthally symmetric around the center of the hot spot, and is assumed to vary with the angle, , measured from the central axis of the spot. For the purposes of this exploratory calculation we use a simple linear variation of the temperature with angle, , where , , and are the central temperature, fractional temperature change, half-angle of the emitting point (measured from the spot centre) and maximum half-angular size of the hot spot, respectively. We compute a model photon energy spectrum at infinity, and then apply an RXTE/PCA response matrix to obtain count rates versus PCA energy channel. We then compute amplitudes as a function of energy channel that can be compared with the real data.

Two example models are shown in Figure 12. We have selected a geometry that gives an amplitude close to the observed values. As expected, and as shown by other authors, a uniform spot emitting a typical burst spectrum produces an increasing amplitude with energy in the PCA bandpass. Since in general a smaller hot spot produces a larger modulation amplitude, one would expect that in order to produce a drop in amplitude with increasing energy the temperature should increase away from the center of the spot. That is, the edge should be hotter than the center. This expectation is borne out in our modeling. In the example shown, adding a fractional temperature change of 10% produces a drop in amplitude with energy of similar magnitude to that observed.
We do not claim that the above geometry is unique in fitting this aspect of the data, and it is not clear that it would survive other constraints such as pulse profile fitting (see for example Bhattacharyya et al. (2005)). However, it does demonstrate that temperature gradients merit further study. How such systematic variations in temperature might arise is not clear, although we note that an asymmetry associated with spreading from the center of a hot spot would tend to produce a hotter edge (as the center has longer to cool). Constraints from theory on the magnitude and distribution of likely temperature variations would be extremely helpful.
4 Conclusions
In this paper we have presented an analysis of the energy dependence of burst oscillations from the accreting millisecond pulsar J1814. Our results are intriguing. The fractional amplitude of the pulsations falls with energy across the 2-20 keV RXTE band; we are able to rule out the amplitude being constant, or rising with energy, at a level greater than 3. This mirrors the behaviour seen in the persistent accretion-powered pulsations, but differs from that seen for the burst oscillations of the non-pulsing LMXBs by Muno, Özel & Chakrabarty (2003). The persistent pulsations, like those of the other accreting millisecond pulsars, show soft lags of 0.015 cycles over the 2-20 keV band; for the burst oscillations we can rule out lags or leads of this magnitude at the 3 level.
The energy dependence of J1814’s burst oscillations differs from that reported for LMXB burst oscillations in the most comprehensive study of these objects to date (Muno, Özel & Chakrabarty, 2003). It joins a list of properties that seem to differ between the two classes of objects. For the LMXBs, burst oscillations are only seen at high accretion rates; for the pulsars burst oscillations are seen even though the accretion rate never gets high (Muno, Galloway & Chakrabarty, 2004). LMXB burst oscillations show frequency shifts of up to 5Hz (see for example Muno et al. (2001)); for the pulsars frequency variation is only seen in the rises of those bursts that show PRE (Chakrabarty et al., 2003; Watts, Strohmayer & Markwardt, 2005; Bhattacharyya & Strohmayer, 2006). The LMXB burst oscillations also show amplitude variations (Muno, Özel & Chakrabarty, 2002); for J1814 no such variations are seen except during PRE (Watts, Strohmayer & Markwardt, 2005). Finally, the pulsar burst oscillations have detectable harmonic (Chakrabarty et al., 2003; Strohmayer et al., 2003), whereas the LMXB oscillations do not (Muno, Özel & Chakrabarty (2002), although see Bhattacharyya et al. (2005), which presents evidence for harmonic content in the rising phase of bursts from 4U 1636-536).
The differing properties suggest that the mechanism responsible for the burst oscillations may differ between the two classes of objects. Further study, however, is clearly required. There is now a much larger sample of LMXB burst oscillations in the RXTE archive, and it would be advisable to check whether the trends found in the studies by Muno and collaborators still hold for a larger sample. The energy dependence of the burst oscillations of the accreting millisecond pulsar J1808 also remains to be analysed. Our study also highlights the need to look at variations in properties over the course of the outburst; both accretion-powered and burst oscillation properties were found to vary for J1814. The technique of folding together multiple bursts, for example (used both in this paper and in the previous study by Muno, Özel & Chakrabarty (2003)), could obscure interesting variations.
The drop in fractional amplitude with energy observed in the burst oscillations of J1814 is inconsistent with the predictions of both surface mode and one-temperature hot spot models. If these models are correct then there must be substantial changes in the accretion process, triggered by the burst, that cause the accretion pulsations to mask this property of the thermonuclear pulsations. If we assume that the accretion process does not alter significantly during the burst then we must seek an alternative theory. One possibility is that the hot spot possesses a temperature gradient. In Section 3.3 we examined the magnitude of the gradient that might be required to explain the observations. It is substantial: a rise of 10% from center to edge. How such a gradient might be generated and whether it can meet other constraints posed by, for example, the pulse profile, are both interesting questions for future work. Other processes such as beaming due to a corona, however, may have to be invoked to explain the observations.
5 Acknowledgments
We are grateful to Tony Piro for encouraging us to look at this issue, and to Craig Markwardt for providing the orbital ephemeris for XTE J1814-338. We would also like to thank the referee, Mike Muno, for helpful comments and for discussing his own unpublished analysis of this data. ALW acknowledges partial support from the European Union FP5 Research Training Network ’Gamma-Ray Bursts: An Enigma and a Tool’. This research has made use of data obtained from the High Energy Astrophysics Science Archive Research Center (HEASARC) provided by NASA’s Goddard Space Flight Center.
References
- Ballantyne & Everett (2005) Ballantyne D.R., Everett J.E., 2005, ApJ, 626, 364
- Bhattacharyya et al. (2005) Bhattacharyya S., Strohmayer T.E., Miller M.C., Markwardt, C.B., 2005, ApJ, 619, 483
- Bhattacharyya & Strohmayer (2005) Bhattacharyya S., Strohmayer T.E., 2005, ApJ, 634, L157
- Bhattacharyya & Strohmayer (2006) Bhattacharyya S., Strohmayer T.E., 2006, ApJ, 642, L161
- Brainerd & Lamb (1987) Brainerd C.B., Lamb, F.K., 1987, ApJ, 317, L33
- Buccheri et al. (1983) Buccheri R. et al., 1993, A&A, 128, 245
- Chakrabarty et al. (2003) Chakrabarty D., Morgan E.H., Muno M.P., Galloway D.K., Wijnands R., van der Klis M., Markwardt, C.B., 2003, Nature, 424, 42
- Cui, Morgan & Titarchuk (1998) Cui W., Morgan E.H., Titarchuk L.G., 1998, ApJ, 504, L27
- Cumming (2005) Cumming A., 2005, ApJ, 630, 441
- Cumming, Zweibel & Bildsten (2001) Cumming A., Zweibel E., Bildsten L., 2001, ApJ, 557, 958
- Ford (2000) Ford E.D., 2000, ApJ, 535, L19
- Galloway et al. (2002) Galloway D.K., Chakrabarty D., Morgan E.H., Remillard R.A., 2002, ApJ, 576, L137
- Galloway et al. (2005) Galloway D.K., Markwardt C.B., Morgan E.H., Chakrabarty D., Strohmayer T.E., 2005, ApJ, 622, L45
- Gierliński, Done & Barret (2002) Gierliński M., Done C., Barret D., 2002, MNRAS, 331, 141
- Gierliński & Poutanen (2005) Gierliński M., Poutanen J., 2005, MNRAS, 359, 1261
- Gilfanov et al. (1998) Gilfanov M., Revnivtsev M., Sunyaev R.A., Churazov E., 1998, A&A, 338, L83
- Groth (1975) Groth E.J., 1975, ApJSS, 29, 285
- Heyl (2004) Heyl J., 2004, ApJ, 600, 939
- Heyl (2005) Heyl J., 2005, MNRAS, 361, 504
- Kirsch et al. (2004) Kirsch M.G.F., Mukerjee K., Breitfellner M.G., Djavidnia S., Freyberg M J., Kendziorra E., Smith M.J.S., 2004, A&A, 423, L9
- Krauss et al. (2005) Krauss M.I. et al., 2005, ApJ, 627, 910
- Kylafis & Klimmis (1987) Kylafis N.D., Klimmis G.S., 1987, ApJ, 323, 678
- Lee (2004) Lee U., 2004, ApJ, 600, 914
- Lee & Strohmayer (2005) Lee U., Strohmayer T.E., 2005, MNRAS, 558
- Markwardt & Swank (2003) Markwardt C.B., Swank J.H., 2003, IAU Circ., 8144, 1
- Markwardt, Strohmayer & Swank (2003) Markwardt C.B., Strohmayer T.E., Swank J.H., 2003, Atel 164
- McDermott & Taam (1987) McDermott P.N., Taam R.E., 1987, ApJ, 318, 278
- Mészáros, Riffert & Berthiaume (1988) Mészáros P., Riffert H., Berthiaume G., 1988, ApJ, 325, 204
- Miller (1995) Miller M.C., 1995, ApJ, 441, 770
- Miller & Lamb (1993) Miller M.C., Lamb F.K., 1993, ApJ, 413, L43
- Muno et al. (2001) Muno M.P., Chakrabarty D., Galloway D.K., Psaltis D., 2001, ApJ, 580, 1048
- Muno, Özel & Chakrabarty (2002) Muno M.P., Özel F., Chakrabarty D., 2002, ApJ, 581, 550
- Muno, Özel & Chakrabarty (2003) Muno M.P., Özel F., Chakrabarty D., 2003, ApJ, 595, 1066
- Muno, Galloway & Chakrabarty (2004) Muno M.P., Galloway D.K., Chakrabarty D., 2004, ApJ, 608, 930
- Piro & Bildsten (2005) Piro A.L., Bildsten L., 2005, ApJ, 629, 438
- Piro & Bildsten (2006) Piro A.L., Bildsten L., 2006, ApJ, 638, 968
- Poutanen & Gierliński (2003) Poutanen J., Gierliński M., 2003, MNRAS, 343, 1301
- Sazunov & Sunyaev (2001) Sazunov S.Y., Sunyaev R.A., 2001, A&A, 373, 241
- Spitkovsky, Levin & Ushomirsky (2002) Spitkovsky A., Levin Y., Ushomirsky G., 2002, ApJ, 566, 1018
- Strohmayer (2004) Strohmayer T.E., 2004, in Kaaret P., Lamb F.K., Swank J.H., eds, AIP Conf. Proc. Vol. 714, X-ray Timing 2003: Rossi and Beyond, Melville, New York, p.245
- Strohmayer & Bildsten (2006) Strohmayer T.E., Bildsten L., 2006, in Lewin W.H.G., van der Klis M., eds, Compact Stellar X-ray Sources, Cambridge University Press
- Strohmayer & Markwardt (2002a) Strohmayer T.E., Markwardt C.B., 2002, ApJ, 577, 337
- Strohmayer & Markwardt (2002b) Strohmayer T.E., Markwardt C.B., 2002, ApJ, 581, 577
- Strohmayer et al. (1998) Strohmayer T.E., Zhang W., Swank J.H., Lapidus I., 1998, ApJ, 503, L147
- Strohmayer et al. (2003) Strohmayer T.E., Markwardt C.B., Swank J.H., in’t Zand J.J.M., 2003, ApJ, 596, L67
- Titarchuk, Cui & Wood (2002) Titarchuk L.G., Cui W., Wood K., 2002, ApJ, 576, L49
- Vaughan et al. (1994) Vaughan B.A. et al., 1994, ApJ, 435, 362
- Walker (1992) Walker M.A., 1992, ApJ, 385, 642
- Walker & Mészáros (1989) Walker M.A., Mészáros P., 1989, ApJ, 346, 844
- Watts, Strohmayer & Markwardt (2005) Watts A.L., Strohmayer T.E., Markwardt C.B., 2005, ApJ, 634, 547
- Wood, Ftaclas & Kearney (1988) Wood K.S., Ftaclas C., Kearney M., 1988, ApJ, 324, L63