Inhomogeneous surface distribution of chemical elements in the eclipsing binary AR Aur: A new challenge for our understanding of HgMn stars††thanks: Based on observations obtained at the European Southern Observatory, Paranal, Chile (ESO programmes 268.D-5738(A), 076.D-0169(A), and 076.C-0170(A)).
Abstract
We present the results of a high spectral resolution study of the eclipsing binary AR Aur. AR Aur is the only known eclipsing binary with a HgMn primary star exactly on the ZAMS and a secondary star still contracting towards the ZAMS. We detect for the first time in the spectra of the primary star that for many elements the line profiles are variable over the rotation period. The strongest profile variations are found for the elements Pt, Hg, Sr, Y, Zr, He and Nd, while the line profiles of O, Na, Mg, Si, Ca, Ti, and Fe show only weak distortions over the rotation period. The slight variability of He and Y is also confirmed by the study of high resolution spectra of another HgMn star: And. A preliminary modelling of the inhomogeneous distribution has been carried out for Sr and Y. Our analysis shows that these elements are very likely concentrated in a fractured ring along the rotational equator. It may be an essential clue for the explanation of the origin of the chemical anomalies in HgMn stars (which are very frequently found in binary and multiple systems) that one large fraction of the ring is missing exactly on the surface area which is permanently facing the secondary, and another small one on the almost opposite side. The results presented about the inhomogeneous distribution of various chemical elements over the stellar surface of the primary suggest new directions for investigations to solve the question of the origin of abundance anomalies in B-type stars with HgMn peculiarity.
keywords:
binaries: general - binaries: eclipsing - binaries: spectroscopic - stars: chemically peculiar - stars: abundances - stars: individual (AR Aur, And)1 Introduction
The origin of the abundance anomalies observed in late B-type stars with HgMn peculiarity is still poorly understood. Observationally, these stars are characterized by low rotational velocities and weak or non-detectable magnetic fields. Intrinsic photometric variability has been difficult to detect. The most distinctive features of their atmospheres are an extreme overabundance of Hg (up to 6 dex) and/or Mn (up to 3 dex) and a deficiency of He. As more than 2/3 of the HgMn stars are known to belong to spectroscopic binaries (Hubrig & Mathys, 1995), the variation of spectral lines observed in any HgMn star is usually explained to be due to the orbital motion of the companion. The aspect of inhomogeneous distribution of some chemical elements over the surface of HgMn stars has been for the first time discussed by Hubrig & Mathys (1995). From the survey of HgMn stars in close SBs it was suggested that some chemical elements might be inhomogeneously distributed on the surface, with, in particular, preferential concentration of Hg along the equator. In close SB2 systems where the orbital plane has a small inclination to the line of sight, a rather large overabundance of Hg was found. By contrast, in stars with orbits almost perpendicular to the line of sight, mercury is not observed at all. The first definitively identified spectrum variability which is not caused by the companion has recently been reported for the binary HgMn star And by Wahlgren et al. (2001) and Adelman et al. (2002). They suggested that the spectral variations of the Hg II line at Å discovered in high-dispersion spectra are not due to the orbital motion of the companion, but produced by the combination of the 2.8 day period of rotation of the primary and a nonuniform surface distribution of mercury which is concentrated in the equatorial region, in good correspondence with the results of Hubrig & Mathys (1995).
The ZAMS (Zero-Age Main Sequence) eclipsing binary AR Aur (HD 34364, B9V+B9.5V) with an orbital period of 4.13 days at an age of only years belongs to the Aur OB1 association (Nordstrom & Johansen, 1994) and presents the best case for a study of evolutionary aspects of the chemical peculiarity phenomenon. This is the only eclipsing binary with HgMn peculiarity known to date. The primary and the secondary eclipses are nearly total since its orbital inclination is 88.5∘, and the radii of both stars are almost equal (Nordstrom & Johansen, 1994). Chochol et al. (1988) discovered a third body in the system. The existence of the as yet unseen third star with a mass of at least 0.51 M⊙ has been inferred from a light-time effect in the observed minima with a period of 25-27 years. Nordstrom & Johansen (1994) studied the parameters of this multiple system in detail through an analysis of the available light and radial velocity curves. They concluded that the secondary star is still contracting towards the ZAMS, while the primary star appears to be exactly on the ZAMS. Their data also confirmed the existence of a third body with an orbital period of 24 years and an orbital eccentricity of 0.17. Remarkably, Takeda et al. (1979) reported that AR Aur exhibits variations in the Hg II Å and Y II Å line profiles. Just before the mid-secondary minimum, the Hg II line suddenly became the strongest over all the observed phases, showing double-line structure. To explain the variations of mercury, Takada suggested that the primary star has some inhomogeneities such as a cloud, a spot, or stratification. Later, Zverko et al. (1997) reached a similar conclusion about the variable profiles of mercury. However, both studies used photographic observations at a low spectral resolution of about 30,000 or less and a S/N of 50. Certainly, a more rigorous study using high quality, high-resolution spectroscopy at a very high S/N ratio should provide convincing evidence that the Hg II and Y II line profiles are variable. Therefore, we decided to obtain high quality UVES spectra of this system to allow a careful study of the previously reported anomalous line profile characteristics of these elements.
2 Observations
Nine spectra of AR Aur have been recorded at ESO with the VLT UV-Visual Echelle Spectrograph UVES at UT2 in 2005. We used the UVES dichroic standard settings covering the spectral range from 3030 Å to 10,000 Å. The slit width was set to for the red arm, corresponding to a resolving power of . For the blue arm, we used a slit width of to achieve a resolving power of . The spectra have been reduced by the UVES pipeline Data Reduction Software (version 2.5; Ballester et al. 2000) and using IRAF. The signal-to-noise ratios of the resulting UVES spectra range from 210 to 380 per pixel in the one-dimensional spectrum around 3990 Å, with the maximum S/N of about 450 around 4500 Å. The summary of our spectroscopic observations of AR Aur is given in Table 1.
The theoretical value for synchronous rotation of AR Aur is about 22 km s-1 (Nordstrom & Johansen, 1994). The line widths in the spectra of both components are nearly identical. Our estimates using eleven Fe II and Ti II lines in the region Å result in km s-1. This value is consistent with the assumption of synchronous rotation. Therefore, the rotation phases have been calculated assuming days. The ephemeris have been taken from the most recent study of AR Aur by Albayrak et al. (2003). Unfortunately, since our observations have been carried out randomly in service mode, no spectrum was obtained at the phases of eclipses. Furthermore, three spectra have been taken around rotation phase 0.1 and two spectra around phase 0.8. Hence, we have only a coverage over six different rotation phases, which is not sufficient to perform a reconstruction of the surface abundance distribution from the rotationally modulated spectral line profiles using the Doppler Imaging technique. On the other hand, the observations we have obtained so far allow us to detect spectral line profile variations, if present, and to carry out modelling of spectral line profiles from test images with certain abundance distributions.
| JD | S/N | Phase | JD | S/N | Phase |
|---|---|---|---|---|---|
| - 2,450,000 | - 2,450,000 | ||||
| 3632.871 | 380 | 0.658 | 3724.613 | 210 | 0.846 |
| 3671.821 | 305 | 0.078 | 3725.621 | 360 | 0.091 |
| 3700.768 | 200 | 0.079 | 3728.587 | 240 | 0.807 |
| 3713.653 | 270 | 0.196 | 3730.589 | 250 | 0.292 |
| 3722.649 | 275 | 0.371 |
3 Spectral variability and modelling
The complete set of abundances in the atmospheres of both primary and secondary components of the AR Aur system can be found in the paper of Khokhlova et al. (1995). Of special interest is the fact that lines of Y, Zr, Nd, Pt, and Hg are only present in the spectra of the primary component. Remarkably, inspecting the behavior of spectral lines at different rotation phases we discovered that exactly these elements show a distinct spectral variability. The lines of a few other elements (O, Na, Mg, Si, Ca, Ti, Fe, Sr, and He) are present in the spectra of the primary and the secondary component, but they appear variable only in the spectra of the primary. No noticeable variability of any element has been detected in the spectra of the secondary star.
To study the behavior of the line profiles and to get a better idea about the distribution of various elements on the surface of the primary star, we decided to compute for a few elements, namely Y, Zr, Sr, and Fe, mean line profiles, where a set of unblended lines of similar strength is available. We note that mean profiles can not be used for Hg and Pt due to different isotopic and hyperfine structures of individual Hg and Pt lines. We also checked whether the discovered variability of spectral lines is not caused by mutual blending of lines originating in the individual binary components.
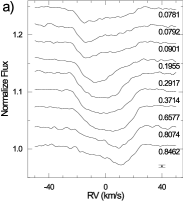
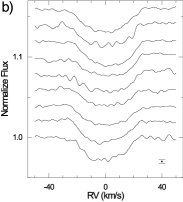
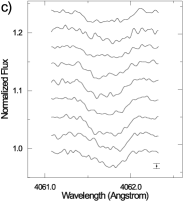
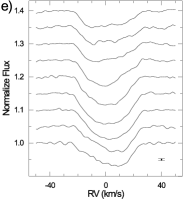
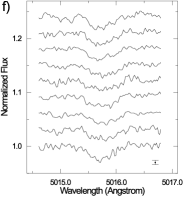
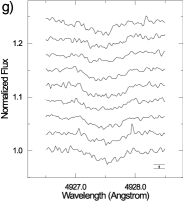
The problem of analyzing the component spectra in double-lined spectroscopic binaries is a tough one, but, fortunately, in the past few years several techniques for spectral disentangling have been developed. We applied the procedure of decomposition described in detail by González & Levato (2006) for each observed phase and could fully confirm the detected variability of the lines of all elements mentioned above. In Fig. 1 we show the behavior of the line profiles of some elements over the rotation period.
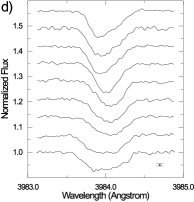
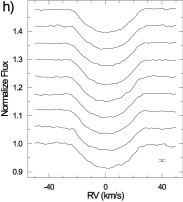
The Zr II, Nd III, Pt II, and He I lines appear rather weak, but still their variations are well noticeable. Interestingly, while the behavior of the line profiles of Y II, Pt II, Hg II, Sr II, and Nd III is rather similar over the rotation period, the line profiles of Zr II and He I seem to vary with a 180∘ phase shift. In Fig. 1h we display the mean line profiles of Fe II obtained using six unblended lines. Although we see very weak distortions in the individual lines over the rotation period, the width of the mean line profile suggests that Fe is distributed almost homogeneously over the stellar surface. The same kind of slight distortions is also observed in the O I, Na I, Mg II, Si II, Ca II, and Ti II line profiles. Moreover, the comparison of the observed line profiles with synthetic spectra calculated assuming the atmosphere parameters employed by Nordstrom & Johansen (1994) ( K, ) and assuming km s-1) reveals that for these elements the overall shape of the line profiles slightly deviates from the purely rotationally broadened profiles. In the spectrum recorded at rotational phase 0.85, the Hg II line at appears very broad (Fig. 1d), even broader than the mean line profiles of Fe II. As the separation of the isotope components of this Hg II line is of the same order as the Doppler broadening, such a shape of the line profile could be interpreted as a signature of the unusual isotopic mixture in that rotation phase. However, this explanation has to be proven by a detailed analysis of the Hg isotopic composition and application of the Doppler Imaging reconstruction method.
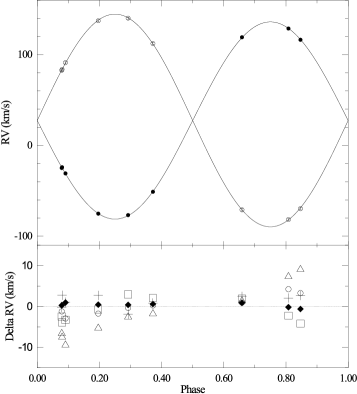
In Fig. 2 we show radial velocity curves of AR Aur. For a few elements which are distributed inhomogeneously over the stellar surface of the primary, we present in the lower panel the radial velocity differences (elements Hg, Y, Sr, Ca, and Ti). Since most of the line profiles are asymmetric, the center-of-gravity method has been used to measure the precise line position. However, the measurements are less reliable for the Hg II line , as discussed above.
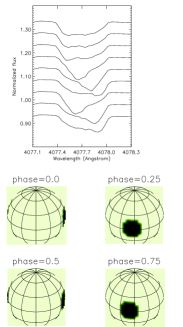
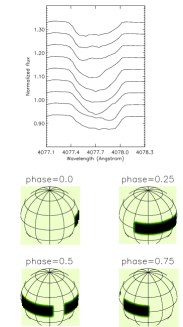
In the following we present the first results of our preliminary modelling of abundance distributions of Sr II and Y II using the Sr II line and the Y II line . We used the so-called direct Doppler Imaging method recently presented by Savanov & Strassmeier (2006). This method allows to compute spectral line profiles from test images created by varying the local element abundances (or surface temperature inhomogeneities) and their location on the stellar surface. The model atmosphere has been calculated with Kurucz’s ATLAS9 program (Kurucz, 1993) and the local line profiles have been synthesized with the program SYNTH (Piskunov, 1992). The VALD database (Kupka et al. 1999) provided the atomic line data necessary for the spectral synthesis of the local line profiles. The results of modelling two almost opposite equatorial spots with radius R18∘ located at stellar longitudes 84∘ and 258∘, are presented for Sr in Fig. 3 on the left. Sr was found overabundant in the atmosphere by 0.5 dex and by about 3.0 dex in spots, compared to the solar value. For Y we found an overabundance in the atmosphere by 2.0 dex and by about 5.0 dex in the spots. However, an employment of a partially fractured equatorial ring with a width of 24∘ (Fig. 3, right) presents a much better consistency between the calculated line profiles and the observed ones. Therefore we conclude that the ring structure presents a more realistic distribution of Sr and Y on the stellar surface. It may be an essential clue for the understanding of the origin of the chemical anomalies in HgMn stars (which are very frequently found in binary and multiple systems) that one large fraction of the ring is missing exactly on the surface area which is permanently facing the secondary, and another small one on the almost opposite side. It is intriguing that the results of Hg mapping on the surface of And presented by Wahlgren et al. (2001) and Adelman et al. (2002) are rather similar, showing a concentration of Hg in a somewhat non-uniform equatorial band.
From evaluating the changes of the line profiles over the rotation period in the spectra of AR Aur, it seems that the distribution of Hg, Pt, and Nd shows a behavior comparable to Sr and Y.
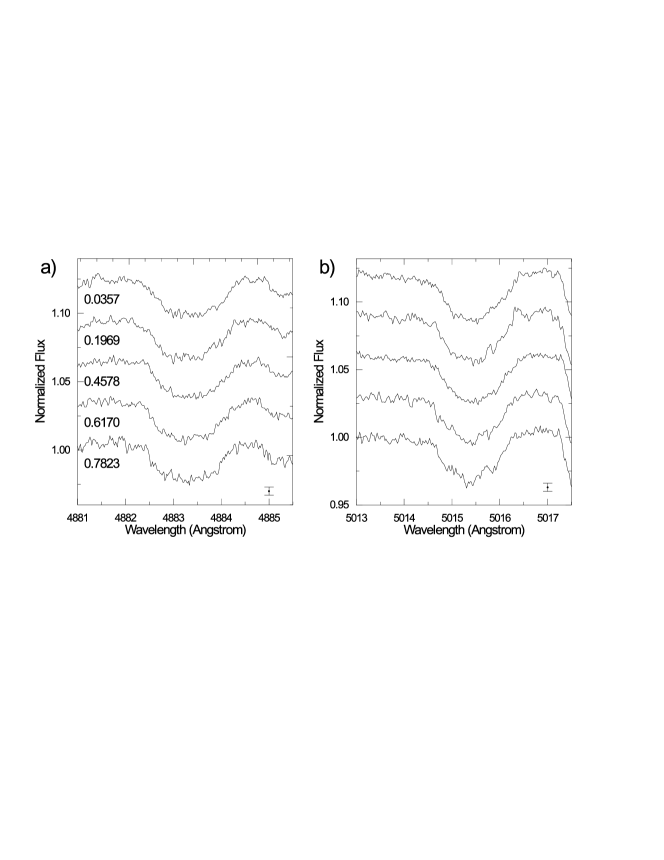
Since a few years we have at our disposal a few spectra of the HgMn star And, recorded during five consecutive nights in 2001. Similar to the observations of AR Aur we used the UVES dichroic standard settings covering the spectral range from 3030 Å to 10,000 Å, giving a S/N greater than 400 in the spectral region around 3990 Å and more than 500 around 4500 Å. From the inspection of these spectra we see the variability of Hg previously announced by Wahlgren et al. (2001) and Adelman et al. (2002). In addition, we find that also He I and Y II lines appear slightly variable. If these elements are concentrated in a fractured equatorial ring, similar to that in AR Aur, the significantly lower variability of Y and He in And could be explained by a different inclination (74∘) of the rotational axis to the line of sight. The variability of the line profiles He I and Y II in the spectra of And is presented in Fig. 4.
The primary and the secondary components in the AR Aur system are of considerable interest as they are very young and nearly equal-mass stars. Nordstrom & Johansen (1994) suggested that the third star could be a pre-main sequence star. A direct detection of the third component would support this scenario and provide an estimate of the mass of this component and the inclination between the two orbital planes. We obtained high-resolution images of AR Aur in November 2005 with NACO at the VLT. The observations were carried out in the band using the camera S13. However, no companion has been detected. We note that the orbital inclination of the wide orbit is unknown. As we are presently almost in the phase of conjunction the companion would be within the diffraction limit for inclinations below 50∘. Additionally, the third component could be too faint to detect in close proximity to the two more massive stars.
4 Discussion
The discovery of an inhomogeneous distribution of various elements in the atmospheres of AR Aur and And challenges our understanding of the nature of HgMn stars. Using FEROS at the ESO 2.2 m telescope we are currently carrying out a survey of a large sample of HgMn stars to establish the spectral variability due to an inhomogeneous elemental distribution in the atmospheres of these stars. The observations obtained during the last months led already to the discovery of a number of HgMn stars with spots (González et al. in preparation), proving that the presence of an inhomogeneous distribution on the surface of these stars is a rather common characteristics and not just a rare phenomenon found in the atmospheres of very few HgMn stars. The results of our study modify the claim of Adelman et al. (2002) that the variability phenomenon in HgMn stars is confined to a narrow range of stellar parameters rather than characterizing the entire class of HgMn stars.
Presently we do not have any explanation for the discovered distribution of Sr and Y in a fractured ring where a large fraction of the ring is missing exactly on the surface area which is permanently facing the secondary, and another small fraction in the almost opposite phase. We believe that factors as the presence of a weak tangled magnetic field, tidal distortion, or the reflection effect can play a role in the development of anomalies in HgMn stars. Although diffusion due to gravitational settling and radiative levitation have been the most popular explanation for the HgMn star abundances in the last decades, the accretion of interstellar material during the pre-main-sequence phase by HgMn binary systems seems to be a more convincing choice to explain the surface abundances in the presence of magnetic fields. Probably, all these mechanisms have to be taken into account in future studies of these stars.
Typically, inhomogeneous chemical abundance distributions are observed only on the surface of magnetic chemically peculiar stars with large-scale organized magnetic fields. In these stars the abundance distribution of certain elements is non-uniform and non-symmetric with respect to the rotation axis. The presence of magnetic fields in the atmospheres of HgMn stars has been studied by Mathys & Hubrig (1995) and Hubrig & Castelli (2001). Mathys & Hubrig (1995) could demonstrate the presence of quadratic magnetic fields in two close double-lined systems with HgMn primary stars, 74 Aqr and Lup. Hubrig & Castelli (2001) showed for a few HgMn stars evidence for a relative magnetic intensification of Fe II lines produced by different magnetic desaturations induced by different Zeeman-split components. As the relative intensification is roughly correlated with the strength of the magnetic field, it is a powerful tool for detecting magnetic fields which have a complex structure and are difficult to detect by polarization measurements. A magnetic field of the order of a few hundred Gauss was recently detected in four other HgMn stars by Hubrig et al. (2006b). The small sample of HgMn stars for which Hubrig et al. (2006b) gathered magnetic field measurements with FORS 1 in spectropolarimetric mode also included And, with a detected variable magnetic field of the order of up to 260 G. The structure of the measured field in HgMn stars must be, however, sufficiently tangled so that it does not produce a strong net observable circular polarization signature. A scenario how a magnetic field can be build up in binary systems has been presented some time ago by Hubrig (1998). As the role that magnetic fields play in the development of HgMn chemical peculiarities is unclear yet, systematic searches for magnetic fields in a larger sample of these stars should be conducted and the structure of those magnetic fields needs to be determined.
Finally, we would like to note that since many stars with HgMn peculiarity are found in young multiple systems and in young associations, further studies of HgMn stars are especially important to understand the evolutionary aspects of the chemical peculiarity phenomenon. Our recent study of the multiplicity of HgMn stars suggests that at least 2/3 of HgMn stars are formed in multiple systems (Hubrig et al., 2006a). It is conceivable that HgMn stars have been synchronized and that their peculiarities were established as early as the PMS phase. Both AR Aur and And appear very young, with the secondary in the AR Aur system in the final stage of contracting towards the ZAMS. And was also found to be located on the ZAMS (Hubrig et al., 2005).
References
- Adelman et al. (2002) Adelman S. J., Gulliver A. F., Kochukhov O. P., Ryabchikova T. A., 2002, ApJ, 575, 449
- Albayrak et al. (2003) Albayrak B., Ak T., Elmasli A., 2003, AN, 324, 523
- Ballester et al. (2000) Ballester P., Modigliani A., Boitquin O., Cristiani S., et al., 2000, Messenger, 101, 31
- Chochol et al. (1988) Chochol D., Juza K., Zverko J., Ziznovsky J., Mayer P., 1988, BAICz, 39, 69
- González & Levato (2006) González J. F., Levato H., 2006, A&A, 448, 283
- Hubrig (1998) Hubrig S., 1998, CoSka, 27, 296
- Hubrig et al. (2006a) Hubrig S., Ageorges N., Schöller M, 2006a, in ESO Astrophys. Symposia, Multiple Stars across the H-R diagram. Springer, Berlin/Heidelberg, in press
- Hubrig & Castelli (2001) Hubrig S., Castelli F., 2001, A&A, 375, 963
- Hubrig & Mathys (1995) Hubrig S., Mathys G., 1995, Com. Ap, 18, 167
- Hubrig et al. (2006b) Hubrig S., North P., Schöller M., Mathys G., 2006b, AN, 327, 289
- Hubrig et al. (2005) Hubrig S., Szeifert T., North P., Schöller M., Yudin R. V., 2005, ASPC, 337, 236
- Khokhlova et al. (1995) Khokhlova V. L., Zverko Y., Zhizhnovskii I., Griffin R. E. M., 1995, AstL, 21, 818
- Kupka et al. (1999) Kupka F., Piskunov N., Ryabchikova T. A., Stempels H. C., Weiss W. W., 1999, A&AS, 138, 119
- Kurucz (1993) Kurucz R., 1993, KurCD, 13,
- Mathys & Hubrig (1995) Mathys G., Hubrig S., 1995, A&A, 293, 810
- Nordstrom & Johansen (1994) Nordstrom B., Johansen K. T., 1994, A&A, 282, 787
- Piskunov (1992) Piskunov N. E., 1992, in Glagolevskij Yu.V., Romanyuk I.I., eds, Stellar Magnetism. NAUKA, Sankt-Petersburg, p. 92
- Savanov & Strassmeier (2006) Savanov I., Strassmeier K., 2006, A&A, 444, 931
- Takeda et al. (1979) Takeda Y., Takada M., Kitamura M., 1979, PASJ, 31, 821
- Wahlgren et al. (2001) Wahlgren G. M., Ilyin I., Kochukhov O., 2001, AAS, 33, 1506
- Zverko et al. (1997) Zverko J., Ziznovsky J., Khokhlova V. L., 1997, CoSka, 27, 41