Near Ultraviolet sources in the Great Observatories Origins Deep Survey Fields
Abstract
We present an Ultraviolet (UV) selected sample of 268 objects in the two fields of the Great Observatories Origins Deep Survey (GOODS). We used the parallel observations taken with WFPC2 in the U–band (F300W) which covered 88% of the GOODS fields to identify sources and selected only objects with GOODS/ACS counterparts. Spectroscopic redshifts for 95 of these sources are available and we have used the multiwavelength GOODS data to estimate photometric redshifts for the others. Most of the objects are between . We used the spectral types obtained by the photometric redshift fitting to identify the starburst galaxies. We have also visually checked all objects and looked for tidal effects and nearby companions. We find that (i) 45% of the UV-selected galaxies are starbursts, (ii) nearly 75% of the starbursts have tidal tails or show some peculiarity typical of interactions or mergers, (iii) 50% have companions within an area of 55 arcsec. The UV-selected sample has an average rest-frame MB=–19.9 0.1. The bluest objects in the sample ( and ) are at and have peculiar morphologies that resembles either tadpoles, chains, or double-clump galaxies. Starbursts with tadpole or clump morphology at have sizes comparable to LBGs and compact Ultraviolet-luminous galaxies (UVLGs).
1 Introduction
One of the open questions in modern astronomy is to understand when galaxies acquired their morphology and how star formation and morphology correlates. Are star-forming galaxies at higher, such as Lyman Break galaxies (LBGs), related to local starburst galaxies or are there evolutionary effects that prevent correlating the two populations? Heckman et al. (2005) attempted to identify the local equivalents of LBGs using images from the UV-satellite GALEX and spectroscopy from the SDSS. They found a class of nearby () UV luminous compact starburst galaxies (Compact UVLGs) which resembles the LBGs at . No local galaxy population meets the UV luminous criteria which makes these objects a class of scaled-up unobscured starbursts just as LBGs. If these objects are common out to they could contribute significantly to the rise of the star-formation rate density in the universe. Recently, Burgarella et al. (2006) using GALEX, Spitzer, HST and ground-based telescopes, selected a sample of 300 far-UV dropouts in the Chandra Deep Field South (CDF-S) which resembles LBGs at . Their sample contains not only UVLGs but also lower luminosity LBGs. However, they were able to obtain morphology for only 36 LBGs since only 1/4 of their GALEX field was observed with HST. In this article, we provide a sample of 268 near-UV sources detected in the two Great Observatories Origins Deep Survey (GOODS) fields for which there is extensive multiwavelength coverage. Our goal is to select enough star-forming galaxies at intermediate in order to characterize their role in galaxy evolution.
2 The Data
During the GOODS campaign with HST we implemented a WFPC2 pure parallel program aimed at covering the lack of U–band observations with ACS and maximizing the synergy between the parallels and the prime instrument. We took near-UV images with the F300W filter (U band with = 2920 Å) in parallel of both fields from December 2002 until March 2003. GOODS/HST images, aiming also at searching for high supernovae (Strolger et al. 2004), were taken in five repeat visits separated by approximately 45 days. The two GOODS fields were observed with the F435W (B), F606W (V), F775W (i), and F850LP (z) filters. The exposure times were 3, 2.5, 2.5 and 5 orbits per filter, respectively. The observations included the Hubble Deep Field North (HDF-N) and the CDF-S and each field had 15 ACS fields of view which makes GOODS 320 arcmin2.
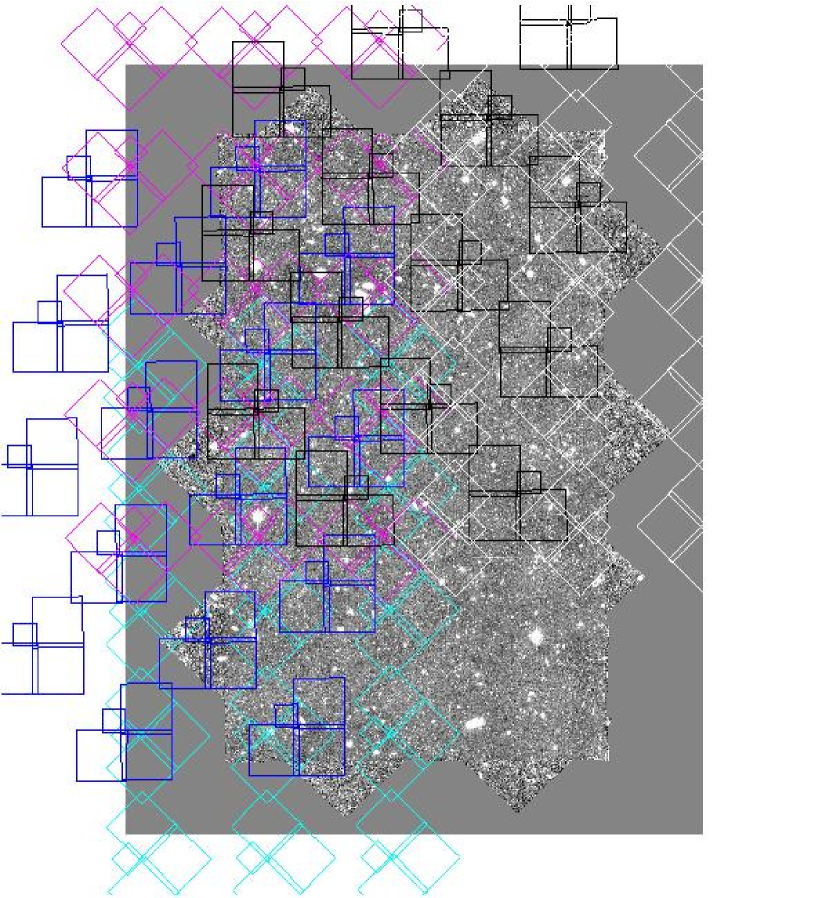
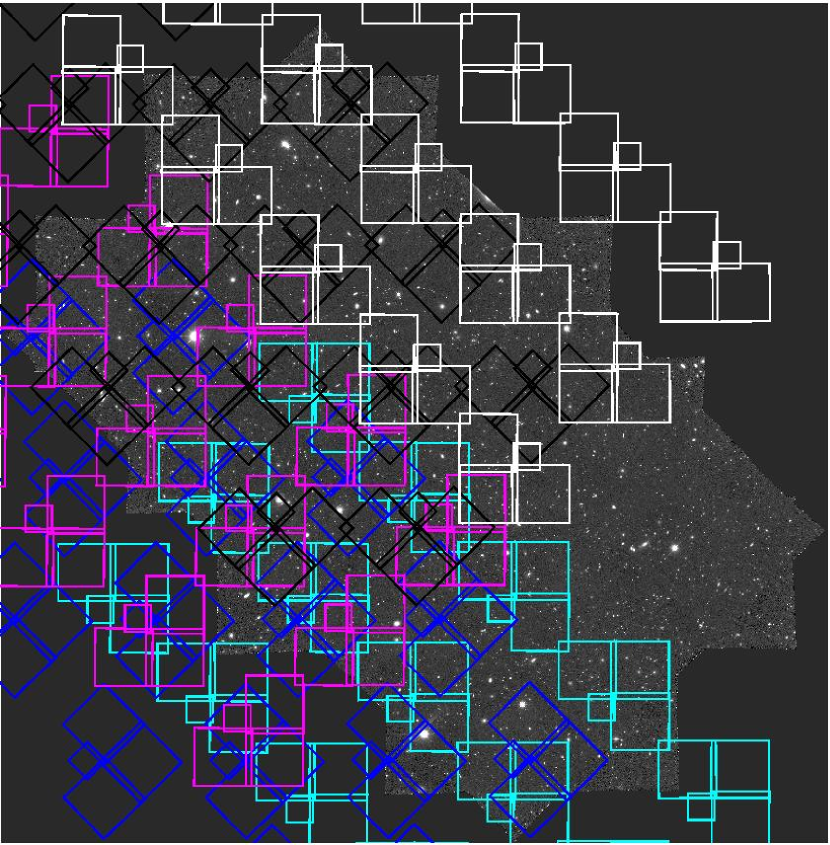
Due to the multi-epoch nature of the GOODS observations the WFPC2 coverage was not uniform and covered 88% of the two fields. Fig. 1 and Fig. 2 show the overlap between the WFPC2 observations and the ACS images.
We retrieved a total of 741 WFPC2 images from the HST archive which were reduced using the HST pipeline. We separated all images that were centered within 0.1 from each other and dithered them using the package PyDrizzle which provides an automated method for dither-combining and distortion-correcting images. The quality of the drizzled image was checked by analyzing the PSF of a few stars present in some of the images.
A total of 30 WFPC2 drizzled images of the GOODS-South field and 25 of the GOODS-North field were produced. The exposure times of each drizzled image varied from 800s to 11,100s with a typical exposure time being 2,000s. The deep mosaic with 11,100s falls mostly outside the GOODS-N field.
Throughout this paper, we use a cosmology with , and . Magnitudes are given in the AB-system.
3 Sample
We detected sources on the drizzled images using SExtractor v2.2.2 (Bertin & Arnouts 1996, hereafter SE). Our detection criterion was that a source must exceed a sky threshold in 5 contiguous pixels and we also used a detection filter with a Gaussian FWHM of 4 pixels. We used SE’s MAG-AUTO, which is calculated using a flexible elliptical aperture around every detected object, and obtained the magnitude error, m, using SE’s RMS calculated with BACKGROUND-RMS.
The next step was to match the WFPC2 U–band coordinates with the GOODS ACS detections. The GOODS catalog is z–band based with matched aperture photometry in the ACS B, V, i bands. We adopted a maximum offset radius of 1.5 arcsec between the WFPC2 and ACS coordinates. In this paper we analyze only the U–band selected objects which have ACS counterparts. Due to the shallowness and the heterogeneous nature of the parallel data we decided to focus on the bright-end by imposing a conservative magnitude limit to the sample. The magnitude limit mag-auto 24.5 and error mAB(F300W) 0.10 were set to guarantee a clear identification even in the shallowest F300W images. The final catalog has 130 objects in the GOODS-S and 138 in the GOODS-N. We have excluded duplicated objects that were in the borders of the drizzled images and were present in more than one field by choosing the one with either higher exposure time or lower magnitude error. Fig.3 shows the distribution of magnitudes as a function of exposure times. Despite of the imposed magnitude limit at 24.5 we included two faint objects with magnitudes lower than the limit (mag-auto=25.63 and 25.96) since they are in the deepest F300W image and the mAB(F300W) are 0.10.
We have identified 42 objects as stars based on their surface brightness versus magnitude relation. A total of 32 are in the southern field and 10 in the northern field. Some of these objects are Active Galactic Nuclei (AGN) but are not further analyzed in this paper.
For comparison, the deepest near-UV image, obtained with 323.1 ks of HST time as part of the parallel observations of the Hubble Ultra Deep Field campaign (de Mello et al. 2006), has 415 objects down to mAB(F300W)=27.5, which is 0.5 magnitudes deeper than the 45 HST/WFPC2(F300W) orbits dedicated to the original HDF-N.
We have searched for differences in the magnitude distributions of the northern and southern fields that could be present due to cosmic variance (Somerville et al. 2004) and found no significant difference between the two fields. The Kolmogorov-Smirnov (KS) statistic gives less than 10% confidence that these two fields are drawn from different magnitude distributions, if we discard the stars on both samples. The fact that the southern field contains three times more stars than the northern field, shifts the average values of the southern sample towards brighter magnitudes and lowers the KS confidence level.
4 Photometric Redshifts, Spectral Types
Photometric redshifts were calculated using the template fitting method described in detail by Dahlen et al. (2005). The template SEDs used cover spectral types E, Sbc, Scd and Im (Coleman et al. 1980, with extension into UV and NIR-bands by Bolzonella et al. 2000), and starburst templates number 2 and 3 from Kinney et al. (1996). We use multi-band photometry for the GOODS fields, from to bands, obtained with both and ground-based facilities (Giavalisco et al. 2004). The WFPC2 data were not included in the photometric redshift estimation. The redshift accuracy (Dahlen et al. 2005) of the GOODS method is .
Spectroscopic redshifts of 95 objects of the UV-selected sample, 30 in the southern field and 65 in the northern field, are available through the GOODS collaborations (taken from the ESO/GOODS-CDFS spectroscopy master catalog111 http://www.eso.org/science/goods/spectroscopy/CDFS-Mastercat/ and from the Team Keck list by Wirth et al. 2005). Table 1 shows the magnitudes U, B, V, i, z and errors, redshifts (photometric and spectroscopic when available), and spectral types for a few galaxies of our sample. The entire sample will be made available in the eletronic version of this paper. Fig. 4 and Fig. 5 show the photometric and spectroscopic redshift distributions for both fields. The agreement between spectroscopic and photometric redshifts as shown in Fig. 6 is within the redshift accuracy of GOODS (Dahlen et al. 2005). We have checked the four objects with the most discrepant redshifts and concluded that the main reason for the discrepancy is due to either the presence of bright companions which makes the photometry of the objects less accurate, or to confusion on the slit when the spectra were taken.
The distribution of the spectral types (ST) which were obtained from the template fitting when deriving the photometric redshifts are shown in Fig. 7. As expected in the case of UV-selected samples, the majority (48%) of the objects are starbursts (ST4.5). In fact, the fraction of starbursts could be even higher since a starburst galaxy with a high internal extinction has a redder SED and may be shifted to a earlier spectral type with ST4.5. A few galaxies with early-type SEDs (5% have ST1.5) are also present in the UV-selected sample. These early-type objects with star-forming cores could be the result of mergers or star formation triggered by the rapid mass infall into a central black hole as suggested in Menanteau et al. (2001). For comparison, Burgarella et al. (2006) found that LBGs at are either disks (75%) or mergers (22%), and only one object (3%) is a spheroid.
5 Starbursts
In order to assess the nature of the galaxies that are forming stars at intermediate we have visually inspected all 93 objects with starbursts SEDs and classified them according to their optical morphology and searched their environment (55 arcsec) for other objects. We did the analysis in the GOODS bands (B, V, i, and z) since FUV morphologies can give an erroneous view of the galaxy’s shape (e.g. Hibbard & Vacca 1997). We found that (i) nearly 75% of the starbursts have tidal tails or show some peculiarity typical of interaction/mergers, (ii) 50% have another galaxy within the searched area.
We also found that 36% of the starbursts are characterized by the presence of a large clump and extended tail, known as tadpoles. Very little is known about these objects and their fate during evolution. The main question is whether such galaxies are rotating edge-on systems or are objects with peculiar morphology from merging or accretion (Elmegreen et al. 2004, 2005a). We discuss these objects in more detail in §6.
Although our photometric redshifts are well-calibrated with spectroscopic redshifts within the GOODS collaboration (1,000 redshifts for both GOODS fields), the featureless spectra of starbursts, compared to earlier type galaxies with a pronounced 4000Å-break, make their photometric redshift estimates uncertain with an increased risk of ‘catastrophic redshifts’ with large errors. In order to prevent any bias due to the photometric redshift estimates we were conservative and repeated our analysis for the 95 objects with known spectroscopic redshifts and found (i) 35% are starbursts, (ii) 66% of the starbursts show some obvious tidal effect and/or presence of another galaxy within the searched area. Only 33% of the other spectral types show tidal tails and/or presence of other galaxies within the same area.
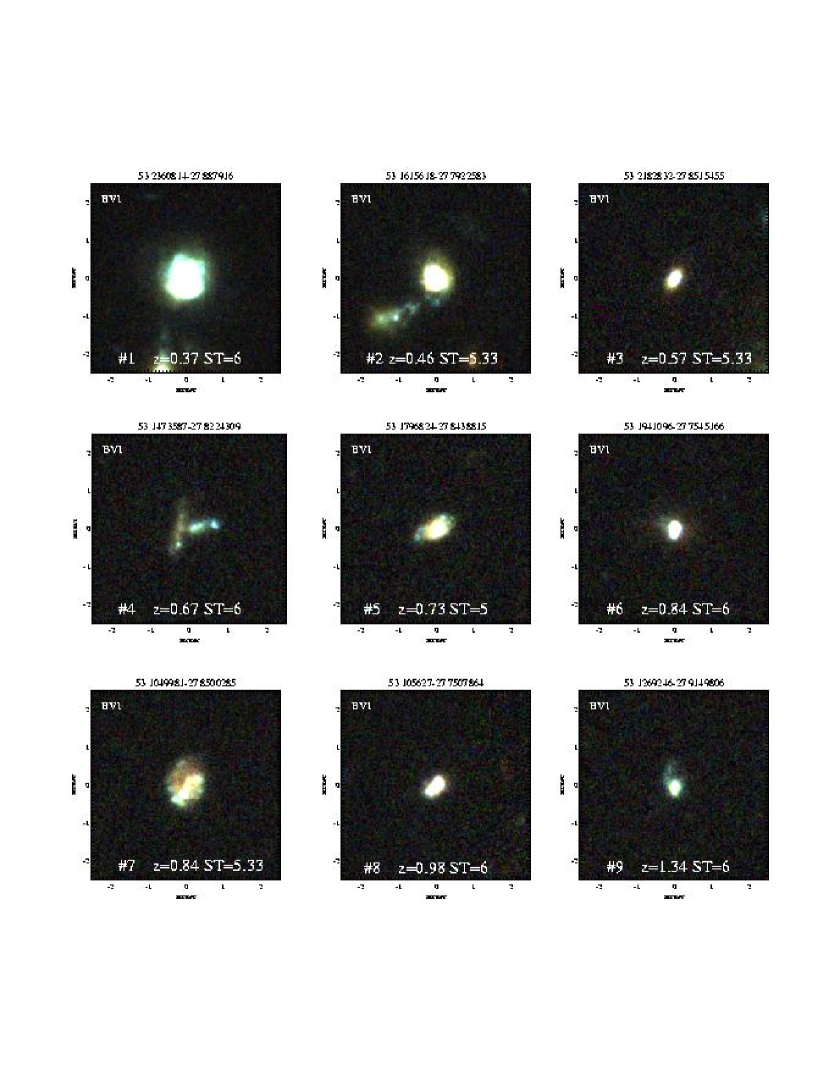
Fig. 8 shows a gallery of starbursts from the CDF-S with spectroscopic redshifts at . Galaxies of all types are represented in the starburst gallery. For example, an early-type (#3) and a merging system (#4), disk galaxies with strong knots of star-formation (#1, #5 and #7), compact objects or clumps with tidal tails (#6 and #9). Strong interacting systems such as #1 and #2 are also common in the UV-selected sample of starbursts.
6 Discussion
Using information from the photometric redshifts or spectroscopic when available, rest-frame absolute magnitudes and colors are calculated using the recipe in Dahlen et al. (2005). However, we only analyzed the ones with since photometric redshift uncertainties are larger for higher redshifts. Fig. 9 shows the rest-frame U–B versus B–V color for both fields. The bluest objects ( and ) have spectral types of starbursts, except for one object (#2 in Fig. 9) with spectral type , which is also star-forming and UV-bright.
The bluest objects are also marked in the color-magnitude plot shown in Fig. 10 where we have also identified objects from Bershady et al. (2000) which includes typical Hubble types, dwarf ellipticals and luminous blue compact galaxies at intermediate redshifts. A large number of the UV-selected sample fits the latter category which Bershady et al. described as blue nucleated galaxies, compact narrow emission-line galaxies and small, blue galaxies at intermediate redshifts. A similar color-magnitude plot was presented in de Mello et al. (2005, their Fig. 13) in the analysis of the deepest U–band image ever taken with HST. The main difference between their color-magnitude distribution and Fig. 10 is that the shallow U–band survey, presented here, detected a larger number of brighter and bluer objects than the deep survey. This is expected, since the wide survey covers a much larger area (the deep survey is only slightly larger than one WFPC2 field) and is sensitive only to bright galaxies. The average rest-frame MB value for the shallow U–band (MB) is one magnitude brighter than the average value of the deep U–band (MB). Despite the fact that the shallow U–band covers a larger area and is sensitive only to the bright end of the luminosity distribution, none of the UV-selected galaxies in the GOODS fields is brighter than MB= –23.
The bluest objects are at and as shown by the contours in Fig. 11 have peculiar morphologies that resembles either tadpoles, chains, or double-clump galaxies. These galaxies are characterized by the presence of a large clump and extended tail, or two or more large clumps in a linear arrangement. Like the objects in the UDF and the Tadpole ACS field analyzed by Elmegreen et al. (2004, 2005a), their unusual morphology is not merely a band-shifting effect, since the large clumps have no counterparts in the local Universe as seen in the UV nearby galaxy survey (Windhorst et al. 2002). The main question is whether these clumps are accreted clumps that are building up galaxies through hierarchical mergers (Straughn et al. 2004, Elmegreen et al. 2004 and Elmegreen et al. 2005b) or the result of gravitational instabilities of gas accreting in a turbulent medium in a disk (e.g., Noguchi 1996; Immeli 2004). These questions could be answered in the future with near-IR spectroscopy.
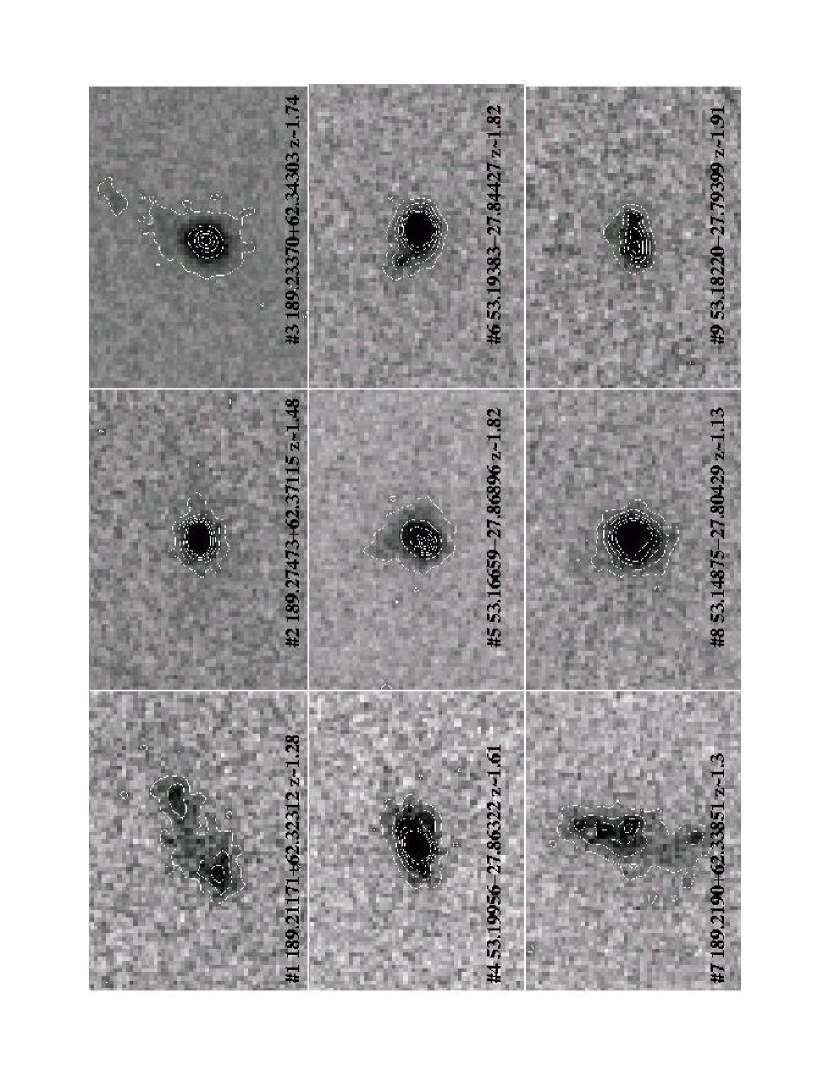
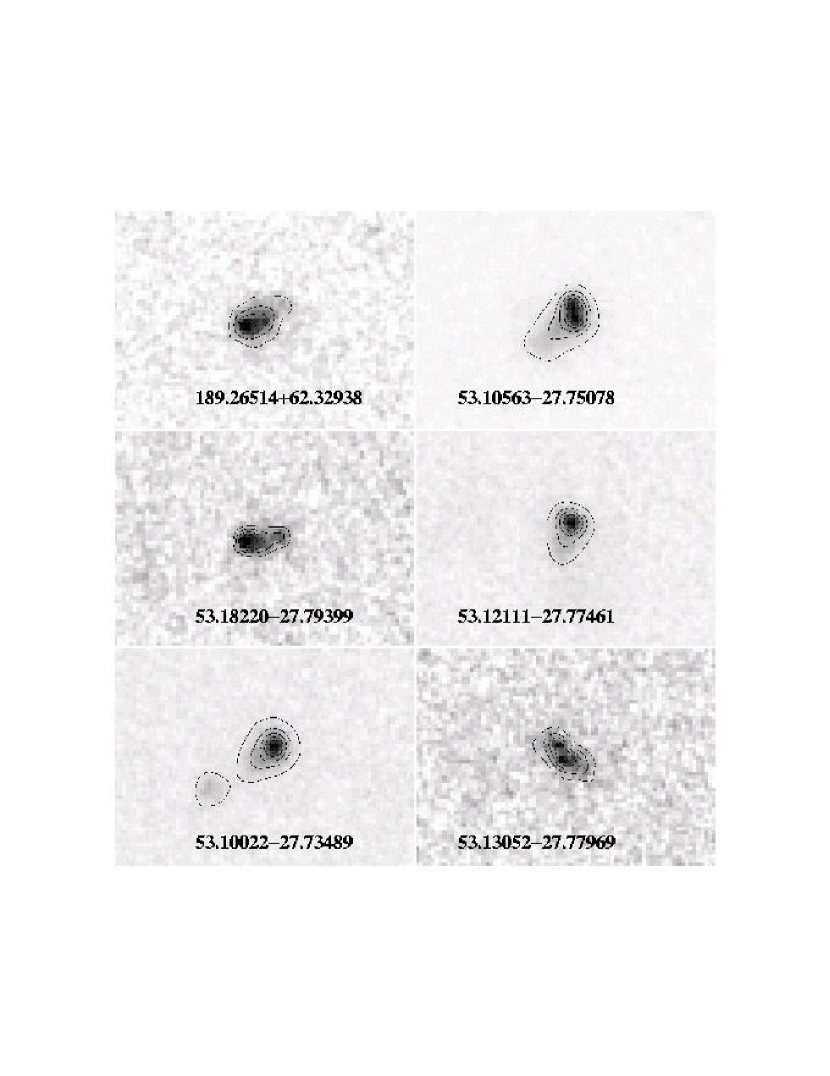
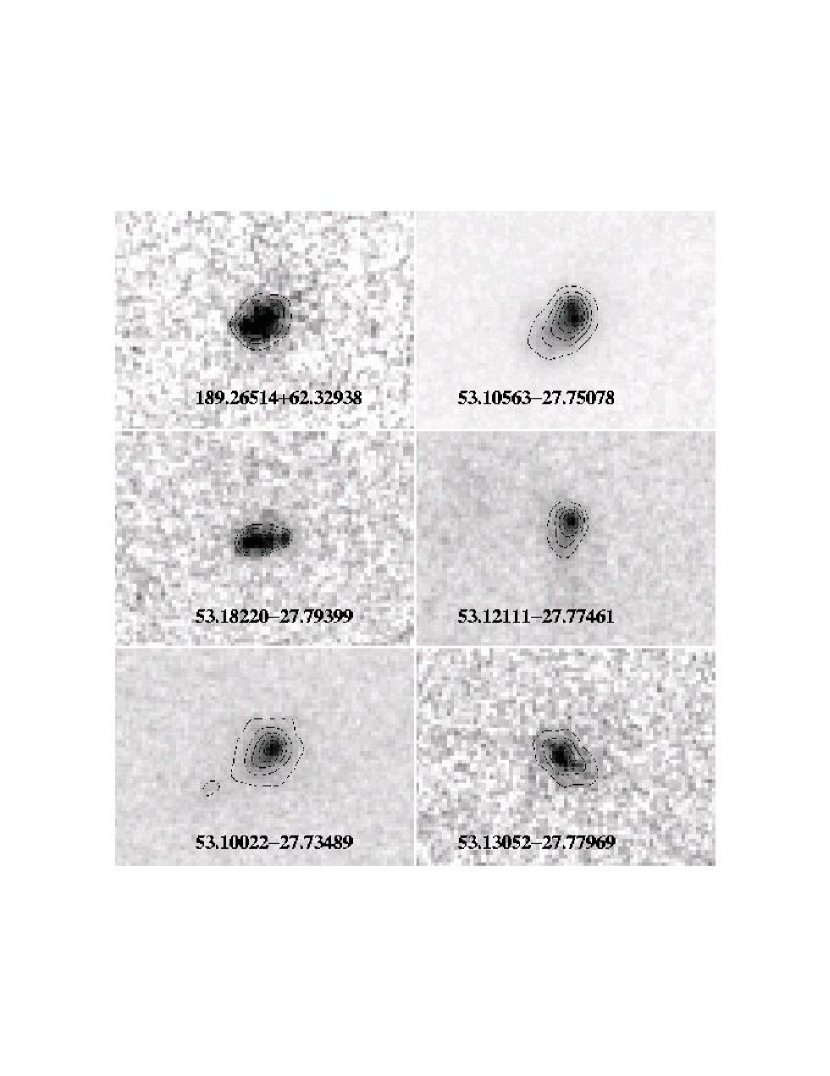
There are twelve galaxies in our sample in the redshift range and they are either interacting systems, such as object #4 in the starburst gallery, or have the tadpole/clump morphology discussed above. Fig. 12 and 13 show six of these objects in the B and z band. At the B–band is showing the rest-frame near-UV morphology while the z–band is showing the morphology in the rest-frame B-band. The contours show that the morphologies are similar in both bands. The average total magnitudes and half-light radii of these objects are MB= and kpc (measured in the B–band), respectively. These starbursts at have sizes comparable to LBGs and compact UVLGs.


7 Summary
We present a sample of 268 objects, including 42 stars or AGNs, in the GOODS North and South fields which was selected from ‘shallow’ images taken with the U–band filter (F300W) during the WFPC2 parallel observations of the GOODS ACS campaign. The analysis of the ACS images (B, V, i, z) of these UV-selected objects reveals that:
-
1.
Most of the objects are between ,
-
2.
The majority (45%) of the galaxies have spectral types of starbursts, however, galaxies of all spectral types are found, including early-types (5%),
-
3.
75% of the starbursts have tidal tails or show some peculiarity typical of interaction/mergers and 50% of the starbursts have another galaxy within 55 arcsec;
-
4.
The bluest galaxies ( and ) are at and have peculiar morphologies that resembles either tadpoles, chains, or double-clump galaxies.
-
5.
Starbursts at with tadpole/clumps morphology have half-light radius of kpc.
| RA | Dec | Exp | u | uerr | b | berr | v | verr | i | ierr | z | zerr | ST | ||
|---|---|---|---|---|---|---|---|---|---|---|---|---|---|---|---|
| 53.1025057 | -27.7411446 | 800 | 23.38 | 0.05 | 23.30 | 0.04 | 22.61 | 0.02 | 22.03 | 0.02 | 21.86 | 0.02 | 0.51 | 3.7 | 0.54 |
| 53.1056270 | -27.7507864 | 2400 | 23.48 | 0.05 | 23.09 | 0.03 | 23.12 | 0.02 | 22.69 | 0.02 | 22.51 | 0.02 | 1.12 | 6.0 | 0.97 |
| 53.1258995 | -27.7512749 | 2260 | 23.17 | 0.02 | 22.55 | 0.02 | 22.03 | 0.01 | 21.62 | 0.01 | 21.40 | 0.01 | 0.43 | 5.3 | 0.29 |
| 53.1237751 | -27.7520043 | 2260 | 23.92 | 0.06 | 23.60 | 0.03 | 23.10 | 0.02 | 22.39 | 0.02 | 22.20 | 0.02 | 0.70 | 3.7 | 0.74 |
| 53.1952443 | -27.7537776 | 1500 | 22.72 | 0.02 | 23.96 | 0.04 | 23.26 | 0.02 | 22.26 | 0.02 | 21.82 | 0.02 | 0.89 | 2.7 | 0.84 |
References
- Bershady et al. (2000) Bershady, M. A., Jangren, A., & Conselice, C. J. 2000, AJ, 119, 2645
- Bertin et al. (1996) Bertin, E., & Arnouts, S. 1996, A&AS, 117, 393
- Bolzonella et al. (2000) Bolzonella, M., Miralles, J.-M., & Pelló, R. 2000, A&A, 363, 476
- Coleman et al. (1980) Coleman, G.D., Wu, C-C., & Wedman, D.W. 1980, ApJS, 43, 393
- Dahlen et al. (2005) Dahlen, T., et al. 2005, ApJ, 631, 126
- de Mello et al. (2005) de Mello, D.F., Wadadekar, Y., Casertano, S., Gardner, J.P., AJ, 131, 216
- Elmegreen et al. (2004) Elmegreen, D.M., Elmegreen, B.G., & Sheets, C.M. 2004, ApJ, 603, 74
- Elmegreen et al. (2005) Elmegreen, D., Elmegreen, B., Rubin, D., & Schaffer, M., 2005a, ApJ, 631, 85
- Elmegreen et al. (2006) Elmegreen B.G. & Elmegreen,D.M. 2005b, ApJ, 627, 632
- Giavalisco et al. (2004) Giavalisco, M., et al., 2004, ApJ, 600, L93
- Immeli et al. (2004) Immeli, A., Samland, M., Westera, P., & Gerhard, O. 2004, ApJ, 611, 20
- Hibbard et al. (1997) Hibbard, J.E., Vacca, W.D., 1997, AJ, 114, 1741
- Heckman et al. (2005) Heckman, T. M., et al., 2005, ApJ, 619, 35
- Kinney et al. (1996) Kinney, A. et al. 1996, ApJ, 467, 38
- Menanteau (2001) Menanteau, F., Abraham, R.G., & Ellis, R.S. 2001, MNRAS, 322, 1
- Noguchi et al. (1996) Noguchi, M. 1996, ApJ, 514, 77
- Straughn et al. (2004) Straughn, A., Ryan, R., Cohen, S., Hathi, N., Windhorst, R., & Pasquali, A. 2004, BAAS, 205, 9417
- Strolger et al. (1998) Strolger, L.-G. et al., 2004, ApJ, 613, 200
- Somerville et al. (2004) Somerville, R.S., et al. 2004, ApJ, 600, L171
- Windhorst et al. (2002) Windhorst, R. et al. 2002, ApJS, 143, 113
- Wirth et al. (2005) Wirth, G.D., et al. 2005, AJ, submitted (astro-ph 0401353)