Population synthesis models for late build-up of the red sequence
Abstract
We present population synthesis models designed to represent the star formation histories of red sequence galaxies (RSGs). Earlier work has shown that single-burst stellar populations (SSPs) are unable to match Balmer line strengths simultaneously at high and low redshift. We therefore consider alternative star formation histories in which RSGs contain intermediate-aged stars even at late epochs. The models are compared to Balmer H absorption strengths, color data, and the number density of red sequence galaxies from to . We find that quenched models, models of constant star formation histories truncated at regularly-spaced intervals, average to an RSG population that matches the data well, showing slow evolution in color and Balmer line strength and a rise in number density by a factor of a few after . The data are best fit by a turn-on of quenching at redshifts .
Subject headings:
galaxies: evolution, galaxies: formation, galaxies: stellar content1. Introduction
Data from low redshift surveys reveal the presence of a bimodal distribution of galaxy colors separating red sequence galaxies (RSGs) from a diverse population of blue galaxies (e.g., Strateva et al., 2001; Kauffmann et al., 2003). Data from high redshift surveys such as DEEP1, DEEP2, and COMBO-17 (Im et al., 2000; Weiner et al., 2005; Bell et al., 2004) confirm that this bimodal distribution was in place by . From their red colors, it can be inferred that RSGs must be comprised at all redshifts largely of old stars (Weiner et al., 2005). However, there is evidence for a range in RSG ages at low redshift, both in field and cluster galaxies (e.g., Jorgensen, 1999; Trager et al. 2000a, ; Trager et al., 2001; Kuntschner, 2001). Mean Balmer line equivalent widths (EWs) in many nearby RSGs are high enough to indicate the presence of an intermediate-age component, implying that the data are not consistent with a red sequence that was fully in place and passively evolving after (Schiavon et al., 2006).
To extend modeling of the red sequence, this Letter considers two other types of star formation histories that have recently been mentioned in the literature. Trager et al. (2000b) introduced “frosting” models, in which an early burst of star formation is followed by a later small burst. These models allow for a range in inferred mean stellar age even for a fixed epoch of star formation onset. Gebhardt et al. (2003) developed a second type of frosting model characterized by continuous, exponentially declining star formation following a large initial burst, utilizing these models for their ability to fade significantly (roughly 1.5 to 2 magnitudes in ) while maintaining low evolution in color. We adopt the exponential frosting models as we wish to maintain roughly constant red colors while enhancing H at late times.
The second family of models involves continuous star formation histories halted at prescribed epochs. These are the “quenched” models proposed by Bell et al. (2004). Both COMBO-17 (Bell et al., 2004) and DEEP2 (Willmer et al., 2006; Faber et al., 2006) found a rise in the number of RSGs after . These authors suggest that some process must be turning blue galaxies into RSGs at late epochs. Possibilities include spiral-spiral mergers (e.g., Mihos & Hernquist, 1996; Cox et al., 2006), AGN or other feedback processes (e.g., Silva et al., 2005; Croton et al., 2006), or scenarios that combine the two (e.g., Springel et al. 2005a, ; Hopkins et al., 2005).
As formulated here, SSP models and exponential frosting models assemble completely and form virtually all of their stellar mass well before . The number of galaxies on the red sequence using these models therefore remains essentially constant after this epoch (barring mergers, which could reduce number density). Quenching models are fundamentally different in that they add new galaxies to the red sequence even at late epochs and therefore allow for the number of RSGs to rise with time. They furthermore allow for a red sequence in which mean spectral and photometric properties may be strongly influenced by recent arrivals at late times.
The observed late rise in the number density of RSGs therefore naturally favors quenching models, either ones in which an early constant star formation phase is simply turned off via feedback, or ones in which the quenching phase is preceded by a burst of formation of young stars, as occurs in many merging-galaxy models. We develop both types of quenched models, and also develop the aforementioned frosting models to test formation scenarios against our observational constraints in color and H EW. The older SSP models are retained, even though they do not fit, as a comparison to earlier literature. We also test the quenched models against RSG number density as a function of redshift.
Colors are on the Vega magnitude system, and we use a cosmology of , , .
2. Data
Our high-redshift Balmer absorption-line data are derived from stacked DEEP2 spectra (four redshift bins, galaxies/bin), while low-redshift values have been computed in the same way from stacked Sloan Digital Sky Survey (SDSS) spectra (two mass bins, galaxies/bin; Eisenstein et al., 2003). High redshift colors are derived from CFHT BRI data (Willmer et al., 2006), while low redshift values are taken from Weiner et al. (2005), which are in turn taken from the RC3 catalog (de Vaucouleurs et al., 1991). When selecting red galaxies, we adopt an evolving color cut using Weiner et al. (2005) data, held constant at prior to and rising to by , assuming a linear rise in as a function of redshift. The Balmer line data are described in Schiavon et al. (2006).
The number density of galaxies on the red sequence is taken from Faber et al. (2006), who use high-redshift data from DEEP2 and COMBO-17 and low-redshift data from SDSS and 2 Degree Field Galaxy Redshift Survey data (Norberg et al., 2002).
3. Models
The high-resolution spectral synthesis code of Bruzual & Charlot (2003) was used to construct the model star formation histories. All models are developed with a Salpeter IMF (Salpeter, 1955) using solar metallicity and solar abundance ratios.
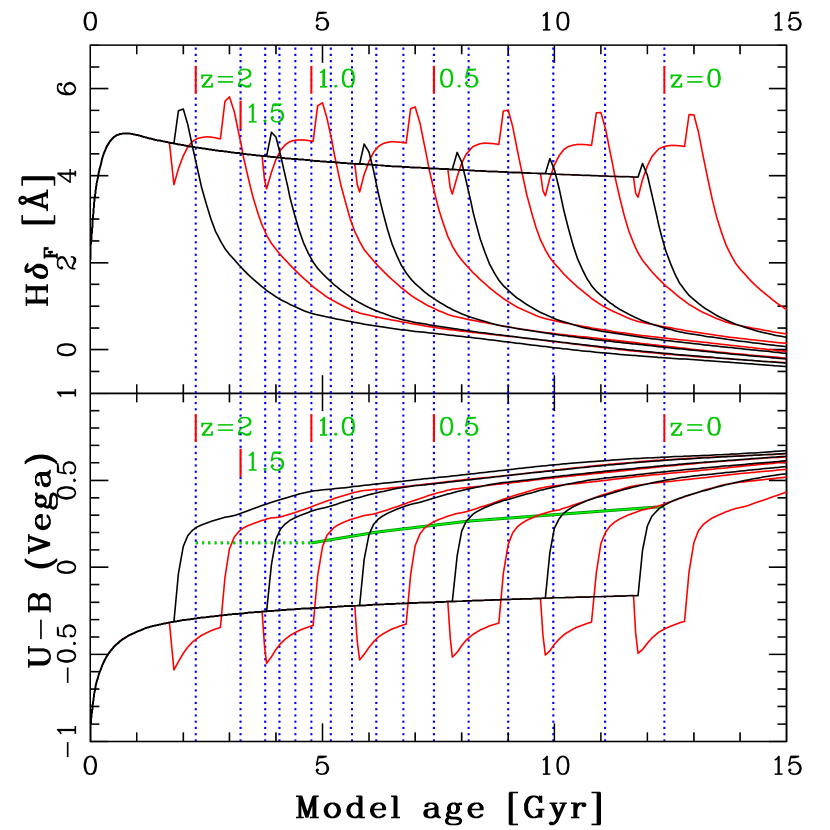
The frosting models consist of a 1-Gyr-long burst starting at that consumes 80-99% of the available gas, followed by an exponentially-declining phase defined by an e-folding time between 1-10 Gyr. The quenched models also begin at , with constant star formation rates. A series of models is quenched starting by either redshift or , with successive models quenched uniformly in time at intervals of 250 Myr. (The first quenching event is timed to be slightly earlier so that the first galaxies pass the color cut by .) A first series of quenched models continues the constant star-formation rate until quenching. However, to model the burst of star formation associated with gas-rich mergers, we also develop models that quench immediately after a 1 Gyr burst of 5x enhanced star formation. Burst parameters are based roughly on those of moderate strength bursts in Cox et al. (2006) and Springel et al. (2005b). These two series are referred to as “pure” and “burst” quenched models, respectively. The chosen model formulations are of an extremely simple nature, designed to minimize the number of input parameters. However, even these simple models match the data reasonably well.
Figure 1 shows the behavior of both sets of quenched models in EW and color. Upon quenching, all models approach a uniform locus in color, crossing our color cut in 1 Gyr, a generic feature of models that undergo rapid quenching. Since we are interested in the average behavior of quenched models on the red sequence at a given location and epoch, we take the number-weighted average of color or H EW for those quenched models that pass the color cut at that epoch. This amounts to assuming that galaxies arrive at that red sequence location at a uniform rate, which we take to be approximately that of a red galaxy. Since all models fade to the same low EW within 2 Gyr, at late epochs any H enhancement in the averaged population will be dominated by the most recently quenched models.
To calculate for the quenched models, we assume that the number of objects that have quenched prior to a given epoch directly traces RSG number density. Given that successive models quench at constant intervals in time, they therefore exhibit a linear rise in with time. We normalize the number of quenched models that have passed the color cut at to match at that redshift from Faber et al. (2006).
4. Color and Equivalent width
4.1. Frosting Models
Figure 2 shows measurements of mean H and vs. redshift for data and models. The middle panels show a selection of individual frosting models, the different lines represent varying amounts of total star formation. The right panels show both sets of averaged quenched models for two assumed epochs of quenching onset. For comparison, SSPs with varying epochs of formation are plotted on the left. The SSP model that most closely matches high- H data requires an unrealistically low epoch of formation, and furthermore predicts very blue colors prior to . No such model has the strong intermediate-aged stellar component at all redshifts required to match the enhanced Balmer line EWs, as noted by Schiavon et al. (2006).
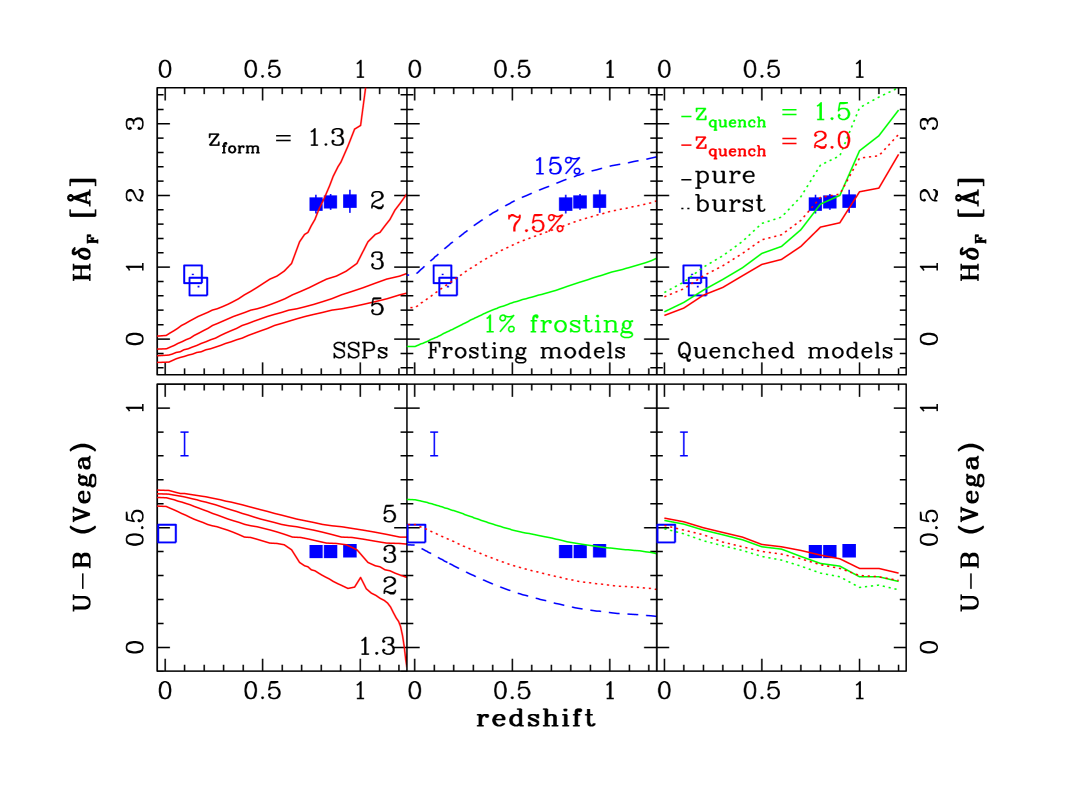
Frosting models match H better due to ongoing star formation. However, the best-fit frosting model evolves too steeply in color. Furthermore, since the percent mass reserved for the frosting phase affects primarily the zeropoint of the model behavior in and H , to get a better fit to color data it is necessary to tune the e-folding time. However, doing so necessarily worsens the H fit. A single frosting model cannot be tuned to fit simultaneously the color and EW data at all epochs, due to the fact that ongoing star formation means the H producing intermediate-age stars also exist alongside a young stellar population that strongly affects color.
The poor match to color data is perhaps a weak argument to rule out frosting models since there is as yet no firm consensus on the amount of color evolution on the red sequence (cf. Bell et al. 2004 vs. Weiner et al. 2005). It may be that combinations of frosting models are a better match to the data, but we have not yet found any recipe that works using two-component models. Moreover, exponential frosting models as parameterized here have two other significant flaws. The first is their aforementioned failure to reproduce the rise in RSGs since . Second, exponential frosting models are forming stars at all epochs. At , the best-fit frosting model forms stars at a rate of for a galaxy. This level of star formation produces emission that is comparable to the values seen in SDSS RSG spectra (Yan et al., 2006). However, in these sources is thought to be excited by AGN or other hard UV excitation sources rather than by star formation (e.g., Kauffmann et al., 2005).
4.2. Quenched models
Since Balmer lines are strongest in intermediate-age stars, it can be seen that the SSP model fails since it has enhanced H for only a few Gyr and can therefore not match high H over the wide range of epochs seen. Frosting models do possess an intermediate-aged stellar population at all redshifts, but ongoing star formation means that their line strengths are always diluted by continuum from high-mass stars which also produce bluer colors. To fit high H at high then requires even higher star formation rates, which produce further bluer colors, and ultimately neither SSPs nor frosting models can fit both sets of data simultaneously.
In contrast, both pure- and burst-quenched models fit the data rather well. Since the averaged populations include only objects with colors that pass our color cut, we obtain a good fit to color almost by construction. By changing the epoch at which quenching begins, we can then fit to H without disturbing the color fit.
If the onset of quenching is assumed to begin at (green lines), the predicted decline of H is steep, all but ruling out the burst-quenched models although the pure-quenched models (red lines) are still a good fit. For a quenching onset of , both types of models match the data. Without higher-redshift H measurements, we cannot constrain the onset of quenching very precisely, any epoch before being acceptable.
5. Evolution of red-sequence galaxy number density
Number density data provide an independent test of models. The SSP and frosting models do not evolve with time, but the quenched model population builds up over time and so can be tested against measured number density evolution. Quantitative results are plotted in Figure 3, which shows model versus observed values of , with model values normalized to match observations at as described in §3.
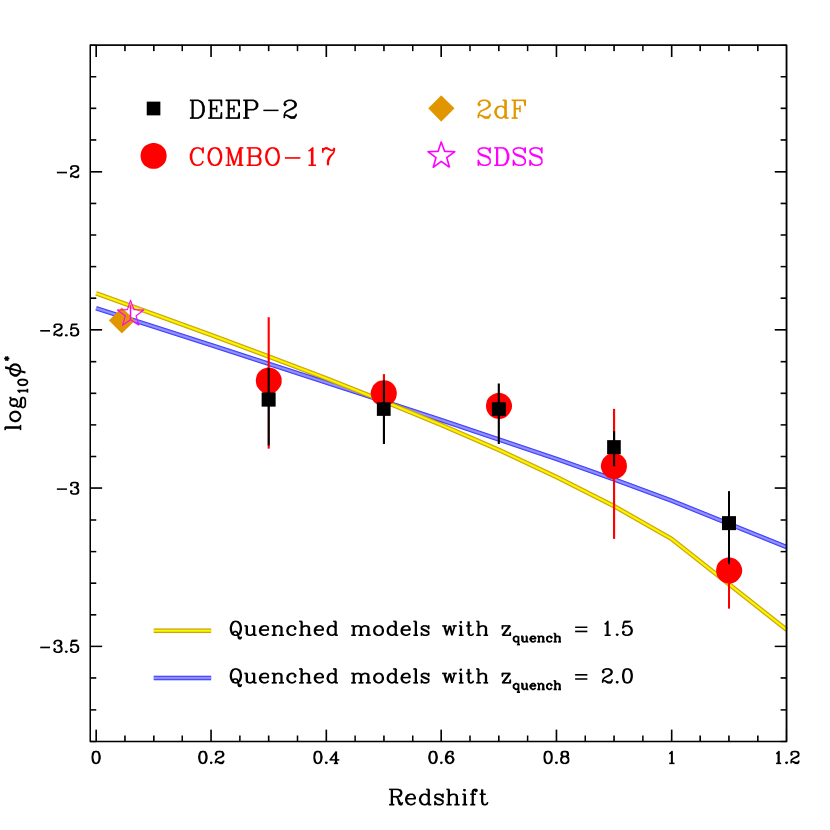
For either choice of the onset of quenching, the fits to data are within the range of observed parameters. In raw numbers, Faber et al. (2006) measured a rise in RSG by a factor of from to the present day. The quenched model rises over the same period by a factor of 3.6 for , and by a factor of 5.4 for . Both values are within range of the observed values, though is slightly preferred, especially given the steep falloff above for the curve.
6. Issues and Conclusions
The models here are based on very simple assumptions and merit a number of caveats. We assume solar metallicity and solar abundance ratios at all epochs. Higher-metallicity populations would have reduced Balmer line EWs, and thus an average population of galaxies with evolving metallicity would show a different trend in H strength versus time. We also do not consider the possibility that galaxies migrate to the red sequence at different times for different masses. Recent data (e.g., Treu et al., 2005; Bundy et al., 2005) may indicate that the highest-mass RSGs are fully formed by ; our model would apply to slightly dimmer galaxies, where the growth in numbers is clearer. Our quenched models also assume constant star formation before quenching, whereas realistic progenitors are likely to be massive blue galaxies that have already experienced a fall in total star formation rate before . A next series of models will take this into account. Finally, our assumed uniform rate of quenching is simplistic in the extreme. The actual rate may vary with time, as is suggested by a possible non-linear trend in Figure 3.
Having adopted a simple set of quenched models with
constant star formation rates truncated at a constant rate in time, we
find that these simple models do in fact match simultaneously RSG
color, line strength and galaxy number density data from the
literature. Quenched models perform better in all of these tests than
either SSPs or single frosting models. The models are not yet
sophisticated enough
to definitively predict the intial epoch of quenching. However, based
on our fits, we expect to see the red sequence come to life sometime
before and await future observational data that may further
clarify this issue.
The authors wish to thank the referee for providing valuable feeback. This project makes use of data taken by the DEEP2 survey, work made possible by support from National Science Foundation grants AST 00-71198 and 00-71408. JJH acknowledges additional support from NSF grant AST-0507483 and NASA STScI grant HST-AR-09937.01-A.
References
- Bell et al. (2004) Bell, E. F., et al. 2004, ApJ, 625, 23
- Bruzual & Charlot (2003) Bruzual, G., & Charlot S., 2003, MNRAS, 244, 1000
- Bundy et al. (2005) Bundy, K., et al. 2005, 625, 621
- Croton et al. (2006) Croton, D. J., et al. 2006, MNRAS, 365, 11
- Cox et al. (2006) Cox, T. J., et al. 2006, MNRAS, submitted
- Eisenstein et al. (2003) Eisenstein, D. J., et al. 2003, ApJ, 585, 694
- Faber et al. (2006) Faber, S. M., et al. 2006, ApJ, submitted
- Gebhardt et al. (2003) Gebhardt, K. et al. 2003, ApJ, 583, 92
- Hopkins et al. (2005) Hopkins, P. et al. 2005, ApJ, 625, 71
- Im et al. (2000) Im, M., et al. 2000, ApJ, 571, 136
- Jorgensen (1999) Jorgensen, I. 1999, MNRAS, 306, 607
- Kauffmann et al. (2005) Kauffmann, G., et al. 2005, RSPTA, 1828, 621
- Kauffmann et al. (2003) Kauffmann, G., et al. 2003, MNRAS, 341, 54
- Kuntschner (2001) Kuntschner, H. 2000, Ap&SS, 276, 885
- Mihos & Hernquist (1996) Mihos, C., & Hernquist, L. 1996, ApJ, 464, 641
- Norberg et al. (2002) Norberg, P., et al. 2002, MNRAS, 336, 907
- Salpeter (1955) Salpeter, E. E., 1955, ApJ, 121, 61
- Silva et al. (2005) Silva, L., et al. 2005, MNRAS, 357, 1295
- Schiavon et al. (2006) Schiavon, R. P., et al., 2006, ApJL, in press
- (20) Springel, V., et al, 2005, ApJ, 620, 79
- Strateva et al. (2001) Strateva, I., et al, 2001, AJ, 122, 1861
- de Vaucouleurs et al. (1991) de Vaucouleurs, G., et al. 1991, Third Reference Catalogue of Bright Galaxies, (New York: Springer-Verlag)
- (23) Trager, S. C., et al. 2000a, AJ, 119, 1645
- (24) Trager, S. C., et al. 2000b, AJ, 120, 165
- Trager et al. (2001) Trager, S. C., et al. 2001, ASP Conf. Ser., 245, eds. T. von Hippel et al. (San Francisco: ASP), p.429
- Treu et al. (2005) Treu, T., et al. 2005, 633, 174
- Weiner et al. (2005) Weiner, B. J., et al. 2004, ApJ, 620, 595
- Willmer et al. (2006) Willmer, C. N. A., et al. 2006, ApJ, in press, astro-ph/0506041
- Yan et al. (2006) Yan, R., et al. 2006, ApJ, in press, astro-ph/05122446