Anisotropy studies around the galactic centre at EeV energies with the Auger Observatory
Abstract
Data from the Pierre Auger Observatory are analyzed to search for anisotropies near the direction of the Galactic Centre at EeV energies. The exposure of the surface array in this part of the sky is already significantly larger than that of the fore-runner experiments. Our results do not support previous findings of localized excesses in the AGASA and SUGAR data. We set an upper bound on a point-like flux of cosmic rays arriving from the Galactic Centre which excludes several scenarios predicting sources of EeV neutrons from Sagittarius . Also the events detected simultaneously by the surface and fluorescence detectors (the ‘hybrid’ data set), which have better pointing accuracy but are less numerous than those of the surface array alone, do not show any significant localized excess from this direction.
1 Introduction
The Galactic Centre region constitutes an attractive target for cosmic ray (CR) anisotropy studies at EeV energies, where 1 eV. These may be the highest energies for which the galactic component of the cosmic rays is still dominant. Moreover, since the Galactic Centre (GC) harbors the very massive black hole associated with the radio source Sagittarius , as well as the expanding supernova remnant Sagittarius A East, it contains objects that might be candidates for powerful CR accelerators. The recent high significance observation by H.E.S.S. of a TeV ray source near the location of Sagittarius [1], together with the discovery of a region of extended emission from giant molecular clouds in the central 200 pc of the Milky Way [2], further motivates the search for excesses in this direction. The location of the Pierre Auger Observatory in the southern hemisphere makes it particularly suitable for anisotropy studies in this region since the GC, passing only from the zenith at the site, lies well within the field of view of the experiment. The number of CRs of EeV energies accumulated so far at the Pierre Auger Observatory from this part of the sky greatly exceeds that from previous observations, allowing several interesting searches to be made.
There have been reports by the AGASA experiment [3, 4] indicating a excess of cosmic rays with energies in the range – eV in a radius region centred at right ascension and declination coordinates , in which the number of observed and expected events [4] are , where the error quoted is the one associated with Poisson background fluctuations. Note that the GC itself, for which we will adopt hereafter the Sagittarius J2000.0 coordinates, , lies outside the AGASA field of view (). Later searches near this region with a reanalysis of SUGAR data [5], though with smaller statistics, failed to confirm these findings, but reported a excess flux of CRs with energies in the range – eV in a region of radius centred at , for which they obtained .
It is also sensible to search for a point-like excess from the GC. Due to the imperfect reconstruction of the arrival directions, the point source would be smeared on the angular scale of the resolution of the experiment. In particular, EeV neutrons emitted by one of the possible energetic sources in the centre of the Galaxy may reach the Earth before decaying, and they would not be deflected by galactic magnetic fields. It is interesting to note that several scenarios predicting neutron fluxes from the GC detectable by Auger have been put forward in recent years [6, 7, 8, 9, 10, 11].
In this work we use Auger data from the on-going construction phase to test the previous reports of localized excesses obtained with AGASA and SUGAR data, and to set limits on a CR flux from the GC direction in a window matched to the angular resolution of the experiment at EeV energies. A preliminary analysis of this kind was presented in [12].
The AGASA experiment has also reported a large scale anisotropy at EeV energies corresponding to a dipole-like modulation in right ascension of % amplitude, with a maximum near the GC and a deficit in the anti-centre direction. We defer the analysis of such large scale signatures for future work. This will require, in particular, control of the systematic uncertainty of the modulation of the exposure in right ascension induced by weather effects, which for the present Auger data set is estimated to be at a level of 1%. Uncertainties in the background estimates at this level do not affect the conclusions reached in the search for localized excesses performed in the present work.
2 Data set
The Auger surface detector [13], located in Malargüe, Argentina (latitude , longitude W and mean altitude 1400 m a.s.l.), has been growing in size during the data taking period considered in this work, which goes from January 2004 (when 154 detectors had been deployed) to March 2006 (when 930 detectors were already deployed). The surface detectors consist of plastic tanks filled with 12000 litres of ultra-pure water in which the charged particles from the air showers produce Cherenkov light, which is reflected by the TyvekTM liners and collected by three photomultipliers. The basic cell of the array is triangular, with separations of 1.5 km between detector units, and hence the complete array with 1600 detectors will cover an area of 3000 km2.
We consider the events from the surface detector (SD) array with three or more tanks triggered in a compact configuration. The events have to satisfy the level 5 quality trigger condition, which requires that the detector with the highest signal be surrounded by a hexagon of working detectors, since this ensures that the event is well reconstructed. We also restrict the events to zenith angles .
The energies are obtained using the inferred signal size at 1000 m from the reconstructed shower core, , adopting a conversion that leads to a constant flux in different sky directions above 3 EeV, where the acceptance is saturated. This is the so-called Constant Intensity Cut criterion implemented in [14]. A calibration of the energies is performed using clean fluorescence data, i.e. hybrid events that were recorded when there were contemporaneous aerosol measurements, whose longitudinal profiles include the shower maximum in a measured range of at least 350 g cm-2 and in which there is less than 10% Cherenkov contamination. The estimated systematic uncertainty in the reconstructed shower energy with the fluorescence technique is currently 25% [17]. For the hybrid events measured with both techniques the dispersion between SD and FD energy assignments is at the level of 35% in this energy range. From the uncertainty in the measurements of the signals from the Cherenkov tanks [15] the statistical uncertainty in the energy determination which results from the fitting procedure is about 20% for the energy range considered in this work, i.e. eV. Notice that in this energy range 48% of the events involve just three tanks, 34% involve 4 tanks and only 18% more than 4 tanks. For three tank events the 68% quantile angular resolution is about and the resolution improves for events with 4 tanks or more [16].
Regarding the hybrid events, i.e. those with signal from both the fluorescence detectors (FD) and surface array, the angular resolution achieved is much smaller, typically below 1 degree [16]. Also, given that hybrid events may trigger with just one surface detector, the associated energy threshold ( eV) is lower, and events up to zenith angles of are included in the data set. However, the statistics accumulated are significantly less, in part due to the % duty cycle of the fluorescence telescopes and also because at EeV energies the FD is not fully efficient at detecting showers over the full SD array. There are for instance 79265 SD events in the data set considered with energies eV, while the corresponding number of well reconstructed hybrid events in the same energy range is just 3439. Note that % of the hybrid events in this energy range involve less than three surface detectors, and are hence not included in the SD only data set.
3 Results
To study the possible presence of anisotropies, one needs first to obtain the background expectations for the different sky directions under the assumption of an isotropic CR distribution. This is a delicate issue since modulations of the exposure in right ascension are induced by the dead time of the detectors and the constantly growing array size. Also the effects of weather variations, especially near the energy threshold of the detector, may be non-negligible since they may affect the shower development in the atmosphere and/or the response of the electronics. Preliminary studies of these effects indicate that the possible weather-induced background modulations for the present data set are at a level of 1%, and are hence below the Poisson noise for the angular windows considered111A detailed account of weather effects is certainly necessary to test large scale patterns at the few percent level. Relevant studies are in progress. .
We have followed two different approaches [18] to estimate the isotropic expectations for the SD analysis:
-
•
The semi-analytic technique: At EeV energies the zenith angle dependence of the exposure differs from the geometric one corresponding to full acceptance, d, mainly due to the attenuation in the atmosphere which affects large zenith angle showers. We therefore perform an analytic fit to the distribution of the observed events in the energy range under study and then make a convolution with the number of hexagons with active detectors (which gives a measure of the aperture for events satisfying the quality trigger criterion) as a function of time, assuming a uniform response in azimuth. Through this procedure one obtains an exposure which accounts for the non-saturated acceptance effects and for the non-uniform running times and array growth. This technique allows to recover the detector’s acceptance with negligible biases even in the case in which a large scale pattern is present in the CRs arrival distribution (see ref. [18] for details).
-
•
The shuffling technique: Here the expected number of events in any direction is obtained by averaging many data sets obtained by shuffling the observed events in the energy range of interest so that the arrival times are exchanged among them and the azimuths are drawn uniformly. The shuffling can be performed in separate zenith angle bins or by just mixing them all, and we found no significant difference between these two possibilities. By construction, this exposure preserves exactly the distribution of the events and accounts for the detector dead times, array growth and even in principle for weather-induced modulations. It might however partially absorb modulations induced by large scale intrinsic anisotropies present in the CR flux, such as those due to a global dipole.
As implemented in the current analysis, the two techniques differ essentially in the treatment of the time dependence of the detectors acceptance. With shuffling we follow the detected rates while with the semi-analytic technique we assume a dependence only proportional to the detector size, and these two quantities differ only slightly.
The background estimate obtained with the shuffling technique in the GC region turns out to be about 0.5% larger than the one obtained with the semi-analytic method. Since this difference is much smaller than the size of the excesses that we are testing and is also below the level of the Poisson fluctuations, we will hence mainly quote in the following the values obtained using the semi-analytic technique.
3.1 Testing the AGASA and SUGAR excesses
In Figure 1 we show a map of the GC region depicting the Li-Ma significances222For the parameter in the expression of the Li-Ma significance we use , with the total number of events in the energy range considered and the background expected in the angular region searched. [19] of overdensities in circular windows of degree radius, for SD data with energies in the range – eV. This angular scale is convenient to visualize the distribution of overdensities in the windows explored by SUGAR and AGASA. The galactic plane is represented with a solid line and the location of the Galactic Centre is indicated with a cross. The region in which AGASA reported an excess (in a slightly narrower energy range) is the big circle in the neighborhood of the GC, with the dashed line indicating the lower boundary of the region observed by AGASA. The smaller circle indicates the region where an excess in the SUGAR data was reported.
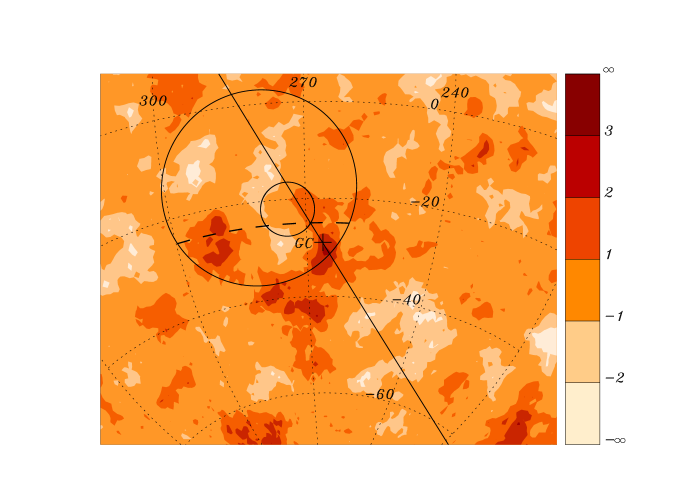
The size of the overdensities present in this map is consistent with what would be expected as a result of statistical fluctuations of an isotropic sky. Indeed, Figure 2 depicts the distribution of these overdensities together with the expectations from an isotropic flux (average and bounds obtained from Monte Carlo simulations), and no significant departure from isotropy is observed.

For the circle centred at the AGASA location and for eV, 2116 events are observed while 2159.6 are expected using the semi-analytic technique, while 2169.7 are expected using the shuffling technique. It is clear that no significant excess is observed. Note that the number of events is more than four times that collected by AGASA in this region, in part due to the fact that the GC lies well within the field of view of Auger, and in part due to the fact that the total exposure of Auger is already double that achieved by AGASA.
[eV] [eV]
It must be borne in mind that there may be systematic differences in the energy calibration of the two experiments. To test whether these differences could have possibly masked the AGASA reported excess, we show in Table 1 the observed and expected rates for different energy ranges, offset by 0.1 decade in energy (i.e. by about 25%), keeping fixed. We have added a systematic error of 1% to the expected rates to account for the effects of possible weather induced modulations. These results show that no significant excesses are seen in the AGASA region for any of these cases. In particular, at the level the excess in this region is always less than 6%, well below the 22% excess reported by AGASA.
Since it is conceivable that particles leading to a localized excess are different from the bulk of the CRs (e.g. if they are nucleons and the bulk of the CRs in this energy range are heavier nuclei), one may also wonder if the Auger sensitivity to these particles could be reduced. In particular, since for Auger the acceptance in this energy range is not yet saturated, it will be larger for heavy nuclei than for protons because showers initiated by heavier primaries develop earlier and are hence more spread out at ground level. Using the estimates in [20] for the acceptance of p and Fe primaries, we find that the sensitivity to protons is about % smaller than to Fe in the energy range studied (assuming an spectrum). In the case in which the 22% excess reported by AGASA (which had full efficiency at EeV energies) was due to nucleons while the background was due to heavy nuclei, at least a 15% excess should have been expected in Auger data. This is much larger than the upper limit we are obtaining.
Regarding the localized excess observed in SUGAR data, we find in the same angular window and energy range that , and hence with more than an order of magnitude larger statistics no significant excess is seen in this window. Shifting the energy range to account for possible offsets also resulted in no significant excess.
3.2 Bounds on a point-like neutron source at the GC
3.2.1 The surface detector results
The optimal search for a point-like source is best done using a Gaussian filter matching the angular resolution of the experiment [21]. For this we can assume that the reconstructed directions are distributed with respect to the true direction (separated by an angle ) according to per unit solid angle, where at EeV energies, corresponding to a 68% quantile of , where we have ignored a mild zenith angle dependence for simplicity.
We use for this search an energy range between eV and eV. Below the Auger SD acceptance is very suppressed. Note also that most neutrons from a source at the GC would have decayed in flight before reaching the Earth for lower energies. On the other hand, energies above may be hard to achieve for galactic sources.
For the Gaussian window centred in the Sagittarius direction we get . This corresponds to a ratio of , where the estimate of the uncertainty takes into account that the window is Gaussian. Applying the results of [21], we get a 95% CL upper bound on the number of events from the source of . To translate this into a bound on the source flux we make two assumptions:
-
•
We assume that the spectrum of the source is similar to that of the CRs, which is approximately in this energy range. If the source spectrum were actually harder, the bound we obtain would be a conservative one.
-
•
We assume that the composition of the CRs in this energy range is similar to that of the source, i.e. proton-like. We will then discuss how the limit is modified if the CRs were heavier, in which case the detector acceptance would be different for the bulk of the CRs and for the neutron source.
Under these assumptions, the energy dependent acceptance of the detector has the same effect upon the source flux and the background flux, so that one can relate the ratio between the CR flux and the expected number of background events in this window, with the ratio between the source flux upper limit and the bound obtained for .
We take for the differential CR spectrum flux the expression
| (1) |
which has an dependence (consistent with the value found e.g. by HiRes [22] in the energy range eV), and is a smooth extrapolation of the spectrum measured at the Auger Observatory333A power law fit to the Auger Observatory measurements [14] leads to (statistical error only). at EeV.
The factor is introduced to parametrise our limited knowledge of the true CR flux and it should be of order unity according to the existing measurements of the spectrum at EeV energies. Note that at EeV the normalisation of the HiRes and AGASA spectra are above the one reported by Auger. In particular, the HiRes normalisation would correspond to adopting while the AGASA normalisation would correspond to a value for of about two.
Consider a Gaussian filter matching the angular resolution characterized by
| (2) |
where is the angle from the direction of Sagittarius . Then the expected number of events in the specified energy range is
| (3) |
where is the energy dependent exposure of the experiment. Similarly, the number of events expected to be observed from the point-like source will be
| (4) |
where we take into account that, due to the finite angular resolution of the experiment, the arrival directions of the observed source events are expected to be distributed according to
| (5) |
Using the assumptions noted above, we then get an expression for the source flux integrated over the energy range considered,
| (6) |
with a 95% CL upper bound of
| (7) |
Note that the bound on the source flux just scales with the parameter , because what is constrained is the ratio between the source and background fluxes.
Let us now discuss how the bound would change if the bulk of the CRs were heavy nuclei in this energy range. Following the discussion in the previous Section, we conclude that the upper limit to the flux from the putative source will have to be scaled by a factor under the assumption that the CRs are iron nuclei and that the source is a source of neutrons. We thus see that the bound on the neutron flux could be up to % higher if the CR composition at EeV energies were heavy.
Due to the steeply falling CR spectrum, the bound in eq. (7) also holds for , i.e. in the inclusive range eV. Setting instead EeV, the corresponding bound is .
We point out that some of the theoretical predictions for neutron fluxes (those associated with the AGASA claim, but not those associated with the TeV results) are based on the AGASA normalization for the CR flux, which is about a factor of 3 larger than the Auger flux normalization. The earlier predictions must thus be reduced by this factor to be compared with the flux bounds obtained here. The predictions of refs. [7], [8] and [9], which exceed the upper-bound obtained by more than one order of magnitude, are already excluded, and that of [10] is at the level of the present Auger sensitivity.
3.2.2 The hybrid results
We have also studied the GC region as observed with hybrid events, detected by both the FD and SD. These events have a better angular resolution [16] ( at 68% C.L. in the energy range studied).
Considering the events with eV, no significant excess is seen in the GC direction. For instance, in an optimal top-hat window of radius, 0.3 events are expected (as estimated using a shuffling method) while no single event direction falls within that circle. This leads to a source flux upper-bound at 95% CL of
| (8) |
which is about a factor of two weaker than the SD flux bound. Note that the energy assignments of the FD apply regardless of the assumed CR composition (except for a small correction to account for the missing energy), be they protons or heavy nuclei. However, the acceptance has a dependence on composition because different primaries develop at different depths in the atmosphere. Since a quality requirement for hybrid events is to have the maximum of the shower development inside the field of view of the telescopes, this affects the sensitivity to different primaries. The bound obtained is indeed a conservative one if the bulk of the CRs are heavy nuclei.
3.2.3 Relation to a point-like photon source
In [1] the H.E.S.S. collaboration has reported a remarkably flat spectrum of gamma rays above 165 GeV (and up to 10 TeV) from the direction of Sagittarius A∗. A naive extrapolation of this spectrum would lead to a flux of gamma rays above 1 EeV of . Note however that the bound obtained by us for a neutron source (which is comparable to this extrapolation) does not apply straightforwardly for photon primaries, since the acceptance (and energy assignments) are modified.
The spectrum of photons reported from the GC ridge [2] is also remarkably flat so that this region too merits future study. The Galactic Centre may house sources of very high-energy cosmic rays detectable through gamma radiation. It is clear then that further exposure with the Auger Observatory of this region and a dedicated analysis will be of interest. Also an exploration down to the FD threshold will be important for the search of photon sources.
4 Conclusions
Using the first 2.3 years of Auger data we have searched for localized anisotropies near the direction of the Galactic Centre, which is well within the field of view of the Observatory. With statistics much greater than those of previous experiments, we have looked for a point-like source in the direction of Sagittarius , without finding a significant excess. This excludes several scenarios of neutron sources in the GC suggested recently. Our searches on larger angular windows in the neighborhood of the GC do not show abnormally over-dense regions. In particular, they do not support the large excesses reported in AGASA data (of 22% on scales) and SUGAR data (of 85% on scales).
Acknowledgments
We are very grateful to the following agencies and organizations for financial support: Gobierno de Mendoza, Comisión Nacional de Energía Atómica y Municipalidad de Malargüe, Argentina; the Australian Research Council; Fundacao de Amparo a Pesquisa do Estado de Sao Paulo, Conselho Nacional de Desenvolvimento Cientifico e Tecnologico and Fundacao de Amparo a Pesquisa do Estado de Rio de Janeiro, Brasil; National Science Foundation of China; Ministry of Education of the Czech Republic (projects LA134 and LN00A006); Centre National de la Recherche Scientifique, Institut National de Physique Nucléaire et Physique des Particules (IN2P3/CNRS), Institut National des Sciences de l’Univers (INSU/CNRS) et Conseil Régional Ile de France, France; German Ministry for Education and Research and Forschungszentrum Karlsruhe, Germany; Istituto Nazionale di Fisica Nucleare, Italy; Consejo Nacional de Ciencia y Tecnologia, Mexico; the Polish State Committee for Scientific Research (grant numbers 1P03D 01430, 2P03B 11024 and 2PO3D 01124), Poland; Slovenian Research Agency; Ministerio de Educación y Ciencia (FPA2003-08733-C02, 2004-01198), Xunta de Galicia (2003 PXIC20612PN, 2005 PXIC20604PN) and Feder Funds, Spain; Particle Physics and Astronomy Research Council, UK; the US Department of Energy, the US National Science Foundation, USA, and UNESCO.
References
- [1] F. Aharonian et al. (H.E.S.S. Collaboration), Astron. Astrophys. 425 (2004) L13 [arXiv:astro-ph/0408145].
- [2] F. Aharonian et al. (H.E.S.S. Collaboration), Nature 439 (2006) 695 [arXiv:astro-ph/0603021].
- [3] N. Hayashida et al. (AGASA Collaboration), Astropart. Phys. 10 (1999) 303 [arXiv:astro-ph/9807045].
- [4] N. Hayashida et al. (AGASA Collaboration), in Proceedings of the ICRC, Salt Lake City, 3 (1999) 256 [arXiv:astro-ph/9906056]; M. Teshima et al. (AGASA Collaboration) in Proceedings of the ICRC, Hamburg, 1 (2001) 337.
- [5] J. A. Bellido, R. W. Clay, B. R. Dawson and M. Johnston-Hollitt, Astropart. Phys. 15 (2001) 167 [arXiv:astro-ph/0009039].
- [6] G.A. Medina Tanco and A.A. Watson, in Proceedings of the ICRC, Hamburg, (2001) 531.
- [7] M. Bossa, S. Mollerach and E. Roulet, J. Phys. G: Nucl. Part. Phys. 29 (2003) 1409 [arXiv:astro-ph/0304023].
- [8] F. Aharonian and A. Neronov, Astrophys. J. 619 (2005) 306 [arXiv:astro-ph/0408303].
- [9] R. M. Crocker, M. Fatuzzo, J. R. Jokipii, F. Melia and R. R. Volkas, Astrophys. J. 622 (2005) 892 [arXiv:astro-ph/0408183].
- [10] D. Grasso and L. Maccione, Astropart. Phys. 24 (2005) 273 [arXiv:astro-ph/0504323].
- [11] P. L. Biermann, G. A. Medina-Tanco, R. Engel and G. Pugliese, Astrophys. J. 604, L29 (2004) [arXiv:astro-ph/0401150].
- [12] The Pierre Auger Collaboration, in Proceedings of the ICRC, Pune, V7, p. 67[arXiv:astro-ph/0507331].
- [13] The Pierre Auger Collaboration, Nucl. Instr. and Meth. A 523 (2004) 50.
- [14] The Pierre Auger Collaboration, in Proceedings of the ICRC, Pune, V7, p. 387 [arXiv:astro-ph/0507150].
- [15] The Pierre Auger Collaboration, in Proceedings of the ICRC, Pune, V7, p. 167.
- [16] The Pierre Auger Collaboration, in Proceedings of the ICRC, Pune, V7, p. 17.
- [17] The Pierre Auger Collaboration, in Proceedings of the ICRC, Pune, V7, p. 13.
- [18] The Pierre Auger Collaboration, in Proceedings of the ICRC, Pune, V7, p. 63 [arXiv:astro-ph/0507517].
- [19] T.-P. Li and Y.-Q. Ma, Astrophys. J 272 (1983) 317.
- [20] D. Allard et al., for the Pierre Auger Collaboration, in Proceedings of the ICRC, Pune, V7, p. 71 [arXiv:astro-ph/0511104].
- [21] P. Billoir and A. Letessier-Selvon, [arXiv:astro-ph/0507538].
- [22] D. R. Bergman, for the HiRes Collaboration, in Proceedings of the ICRC, Pune, V7, p. 101 [arXiv:astro-ph/0507484].