A log-quadratic relation for predicting supermassive black hole masses from the host bulge Sérsic index
Abstract
We reinvestigate the correlation between black hole mass and bulge concentration. With an increased galaxy sample (totalling 27), updated estimates of galaxy distances, black hole masses, and Sérsic indices — a measure of concentration — we perform a least-squares regression analysis to obtain a relation suitable for the purpose of predicting black hole masses in other galaxies. In addition to the linear relation, with dex, we investigated the possibility of a higher order – relation, finding the second order term in the best-fitting quadratic relation to be inconsistent with a value of zero at greater than the 99.99% confidence level. The optimal relation is given by , with dex and a total absolute scatter of 0.31 dex. Extrapolating the quadratic relation, it predicts black holes with masses of in dwarf elliptical galaxies, compared to from the linear relation, and an upper bound on the largest black hole masses in the local universe, equal to .
In addition, we show that the nuclear star clusters at the centers of low-luminosity elliptical galaxies follow an extrapolation of the same quadratic relation — strengthening suggestions for a possible evolutionary link between supermassive black holes and nuclear star clusters. Moreover, we speculate that the merger of two such nucleated galaxies, accompanied by the merger and runaway collision of their central star clusters, may result in the late-time formation of some supermassive black holes.
Finally, we predict the existence of, and provide equations for, an – relation, in which is the (extrapolated) central surface brightness of a bulge.
1 Introduction
While perhaps not surprising to AGN-astronomers, over the past five to ten years, the notion that a supermassive black hole (SMBH; ) resides at the heart of every significantly large () galaxy bulge, even inactive bulges, has changed from a dubious idea to a mainstream belief. Support for the tide-of-opinion change has, in part, arisen from studies of our own galaxy. Schödel (2003) and Ghez et al. (2005, and references therein, see also Broderick & Narayan 2006) have shown that the mass required inside of the innermost resolved volume of the Milky Way is sufficiently large that it rules out alternatives to a SMBH, such as a cluster of dead stars or stellar mass black holes which, if they did once exist, have surely now merged to form a single, massive object (e.g., Miller 2006). Although there is only one other sufficiently well resolved galaxy where such a conclusion can be drawn, NGC 4258 (Miyoshi et al. 1995), it seems reasonable to accept that the dark concentrations of mass at the centers of other galaxies are also SMBHs, and we adopt this convention, or at least terminology, here.
Roughly some three dozen galaxies are close enough that their central, SMBH mass has been measured directly through its influence on the motion of the surrounding gas and stars (Kormendy & Gebhardt 2001; Merritt & Ferrarese 2001a; Ferrarese & Ford 2005, their Table II)111We do not use the eight galaxies listed in part two of Table II from Ferrarese & Ford 2005 for which the SMBH masses might be in error.. To acquire the mass of the central dark object in other (inactive) galaxies requires an alternative approach, and a number of indirect means to do so have been proposed (e.g., Ferrarese & Merritt 2000; Gebhardt et al. 2000; Marconi & Hunt 2003; Novak, Faber & Dekel 2006).
Perhaps the most often used relation — due to the small level of scatter (0.3 dex) — is the – relation (Ferrarese & Merritt 2000; Gebhardt et al. 2000). With an equivalent level of scatter, and the advantage of requiring only galaxy images rather than spectra, is the – relation (Graham et al. 2001, 2003a), where is a measure of the concentration of the stars within the bulge. More precisely, is the inverse exponent from the best-fitting Sérsic (1963) light-profile (see Graham & Driver 2005 for a review of this model). Other relations, often reported to have more scatter than the above two relations, are the – and the – relations (Kormendy 1993; Magorrian et al. 1998). Although, recent studies which have excluded the disk-dominated spiral galaxies (e.g., McLure & Dunlop 2002), or used only the bulge luminosity from the disk galaxies after performing an accurate bulge/disk decomposition (e.g., Erwin et al. 2002; Marconi & Hunt 2003) have obtained a relationship with a similarly low level of scatter (see also Häring & Rix 2004). All of these empirical relations can be, and indeed must be, used to constrain any complete theory or model of galaxy/SMBH co-evolution. Furthermore, all of these relations can be used to gauge the mass of SMBHs in other galaxies.
In this paper we use the Sérsic index , together with updated SMBH masses (Section 2), to derive the first – relation constructed for the purpose of predicting in other galaxies (Section 3). This relation may differ from the intrinsic, astrophysical relation presented in Graham et al. (2003a) due to the different method of regression that is required. Armed with such a relation, one requires only images — which need not even be photometrically calibrated — to predict accurate SMBHs in other galaxies. Additional advantages with the use of a global measure such as , are that it is not heavily affected by possible kinematical sub-structure at the center of a bulge, nor by rotational velocity or vertical dispersion of an underlying disk, nor aperture corections. Furthermore, the quantity is cheap to acquire in terms of telescope time and unlike absolute magnitudes and masses, it does not depend on galaxy distance nor an uncertain mass-to-light ratio.
As noted in Graham et al. (2001), there is no a priori reason to presume that the relation between and is linear, and we therefore explore the suitability of a a quadratic equation. In so doing, we find the second order term is inconsistent with a value of zero at the 99.99% confidence level (Section 3.2). Implications at the low- and high- end of the relation are discussed, relative to the optimal linear fit.
In a forthcoming paper we will apply this quadratic relation to the Millennium Galaxy Catalog (Liske et al. 2003; Cross et al. 2004; Driver et al. 2006) containing 10 095 galaxies — which have been modeled with a Sérsic-bulge plus exponential-disk (Allen et al. 2006) — to determine the local supermassive black hole mass function (e.g., Salucci et al. 1999; Yu & Tremaine 2002; Granato et al. 2004; Shankar et al. 2004) and space density in both early- and late-type galaxies.
In Section 4 we expand the – diagram into an – diagram, where is the mass of the central compact object, which may be a SMBH or a nuclear star cluster. We show that the nuclear star clusters in early-type galaxies appear to follow the curved – relation defined by galaxies with SMBHs, and we discuss some of the implications this may entail. In Section 5 we show that our – relation is independent of the Hubble constant.
Given there are now several relations between SMBH mass and the properties the host bulge, in Section 6 we briefly present some musings as to what may be the fundamental primary relation. In this section we derive a new set of equations relating the SMBH mass to the (extrapolated) central surface density of the host bulge. Finally, in Section 7 we provide a brief summary of the paper.
2 Data for the – relation
Our sample is comprised of the 21 galaxies used in Graham et al. (2001) plus an additional six new galaxies.
A discussion of the original galaxy light-profiles can be found in Erwin et al. (2002), see also Trujillo et al. (2004). Due to updated galaxy distances and SMBH mass measurements, and a refined analysis of the major-axis light-profiles, some of the 27 data points (14 E and 13 S0/Sp) given in Table 1 are slightly different to those published in Graham et al. (2001, their table 1) and shown in Graham et al. (2003a, their figure 1). However, only for two galaxies has the Sérsic index changed by more than 20% — the typical uncertainty on this index (e.g., Caon, Capaccioli, & D’Onofrio 1993). We briefly comment on these two galaxies here and present their new Sérsic fits in Appendix A.
Although the bulge of the Milky Way is nowadays recognised as having an exponential () light-profile, we have fitted the near-infrared data from Kent, Dame, & Fazio (1991) and report an index of rather than exactly 1. The second galaxy in question is NGC 4564. Subsequent to the analysis in Trujillo et al. (2004), NGC 4564 is now recognized as an S0 galaxy that was mis-classified as an E galaxy. An -bulge plus exponential-disk decomposition has therefore been performed. This resulted in its bulge Sérsic index increasing from 2.1 to 3.2.
Four of the six new galaxies are listed in Ferrarese & Ford (2005) (NGC 3115, 4486, 4649, 4697) and our Sérsic fits to their light-profiles are also presented in Appendix A. In addition, we have used the bulge/disk decomposition shown in Graham (2002) for the supposedly “compact Elliptical” galaxy NGC 221 (M32), which was not included in our original paper. We have also been able to include NGC 1399 (Houghton et al. 2006), which previously had no direct SMBH mass estimate. This galaxy’s light-profile has been modeled in D’Onofrio, Capaccioli, & Caon (1994) and we adopt their Sérsic index having obtained the same value from our own fitting of their data.
Despite our attempt to include all of the lowest and highest mass SMBHs, as these data points can have substantial weight on any fitted relation, we have not included the peculiar elliptical galaxy IC 1459 due to uncertainty on both its SMBH mass and its Sérsic index . This galaxy displays clear signs of past interaction, evidenced by stellar tidal tails (Malin 1985) and stellar shells and ripples at large radii (Forbes & Reitzel 1995). Due to its unrelaxed, disturbed morphology, its light-profile is not well fitted with an model. It also possesses a fast counter-rotating stellar core. While the stellar dynamics of the core suggest a SMBH mass of , the gas dynamics reveal the mass could be as low as (Cappellari et al. 2002).
The upper section of Table II in Ferrarese & Ford (2005) lists 25 galaxies with SMBH masses derived from resolved dynamical studies. A further five galaxies in this list have marginally resolved mass estimates, with . Aside from IC 1459, we are only missing quality -band images for three of these 30 galaxies: NGC 3608, NGC 5128 (Centaurus A) and the relatively distant () galaxy Cygnus A.
Most of our 27 galaxies have distances from Tonry et al. (2001), and updated SMBH mass estimates have come from Tremaine et al. (2002), with exceptions noted in Table 1. Three galaxies in our sample do not have ‘Surface Brightness Fluctuation’ distance measurements in Tonry et al. (2001). For the relatively distant galaxies NGC 6251 and NGC 7052, we used their heliocentric velocities (Wegner et al. 2003) and a Hubble constant km s Mpc (Blakeslee et al. 2002) — consistent with the HST Key project value of 72 (Freedman et al. 2001) and the WMAP value of (Spergel et al. 2006). For the remaining Virgo cluster galaxy NGC 4342, we used the mean Virgo cluster distance of 17.0 Mpc (Jerjen, Binggeli, & Barazza 2004). The above three galaxies have slightly different SMBH masses in Table 1 to those in Tremaine et al. (2002) due to the slightly different distances used.
| Galaxy | Distance | ||
|---|---|---|---|
| Mpc | () | ||
| Elliptical Galaxies | |||
| NGC 821 | 24.1 | 0.85 | 4.00 |
| NGC 1399 | 20.0 | 12 | 16.8 |
| NGC 3377 | 11.2 | 1.00 | 3.04 |
| NGC 3379 | 10.6 | 1.35 | 4.29 |
| NGC 4261 | 31.6 | 5.20 | 7.30 |
| NGC 4291 | 26.2 | 3.10 | 4.02 |
| NGC 4374 | 18.4 | 4.64 | 5.60 |
| NGC 4473 | 15.7 | 1.10 | 2.73 |
| NGC 4486 | 16.1 | 34.3 | 6.86 |
| NGC 4649 | 16.8 | 20.0 | 6.04 |
| NGC 4697 | 11.7 | 1.70 | 4.00 |
| NGC 5845 | 25.9 | 2.40 | 3.22 |
| NGC 6251 | 101 | 5.80 | 11.8 |
| NGC 7052 | 60 | 3.40 | 4.55 |
| Bulges of Disk Galaxies | |||
| Milky Way | 0.008 | 0.040 | 1.32 |
| NGC 221 | 0.81 | 0.025 | 1.51 |
| NGC 1023 | 11.4 | 0.44 | 2.01 |
| NGC 2778 | 22.9 | 0.14 | 1.60 |
| NGC 2787 | 7.5 | 0.41 | 1.97 |
| NGC 3031 | 3.9 | 0.68 | 3.26 |
| NGC 3115 | 9.7 | 9.20 | 13.0 |
| NGC 3245 | 20.9 | 2.10 | 4.31 |
| NGC 3384 | 11.6 | 0.16 | 1.72 |
| NGC 4258 | 7.2 | 0.39 | 2.04 |
| NGC 4342 | 17.0 | 3.30 | 5.11 |
| NGC 4564 | 15.0 | 0.56 | 3.15 |
| NGC 7457 | 13.2 | 0.035 | 1.83 |
Note. — Distances are taken from Tonry et al. (2001, their table 1), except for the Milky Way (Eisenhauer et al. 2005), NGC 4342 (Virgo cluster distance modulus = 31.15, Jerjen, Binggeli, & Barazza 2004), NGC 6251 (=7382 km s, Wegner et al. 2003), and NGC 7052 (=4411 km s, Wegner et al. 2003). These four galaxies are not listed in Tonry et al. (2001). A Hubble constant of km s Mpc (Blakeslee et al. 2002; Spergel et al. 2006) has been used for the latter two galaxies. The SMBH masses are from the compilation in Tremaine et al. (2002), except for the Milky Way (Ghez et al. 2003, see also Beloborodov et al. 2006), NGC 821 (Richstone et al. 2006), NGC 3379 (Gebhardt et al. 2000; see also Shapiro et al. 2006), NGC 4486 (Macchetto et al. 1997) and NGC 3115 (Emsellem, Dejonghe, & Bacon 1999). Our sample includes a further three galaxies not listed in Tremaine et al. (2002). The SMBH mass for NGC 3031 and NGC 1399 are from Merritt & Ferrarese (2001a) and Houghton et al. (2006), respectively, and the mass for NGC 4374 is from Maciejewski & Binney (2001, with updated errors taken from Kormendy & Gebhardt 2001). The Sérsic indices are from the major-axis, light-profiles of -band images, except where noted otherwise.
3 The M– correlation
3.1 A linear relation
The – relation presented in Graham et al. (2003a) was constructed using a bisector linear regression analysis which treated both variables equally. In that study, the relation was derived with the goal of determining the intrinsic physical relation between and the Sérsic shape parameter of the bulge. Here our objective is different because we wish to obtain a relation that can be used to predict values of in other galaxies from their observed bulge Sérsic index . We therefore desire an – relation which minimizes the scatter in the quantity to be predicted, and have thus performed an ordinary least squares (OLS) regression of on for those local galaxies for which both quantities are known (Table 1)222See Feigelson & Babu (1992) for a clear exposition behind the rationale of when to use what type of regression..
Following Graham et al. (2003a), we have used a 20 per cent measurement error on the values of , or more specifically, we have assigned an error of to . Later on we explore the influence of varying this quantity. Several factors can contribute to the size of this term, including errors in the sky-subtraction, uncertainties in the point-spread-function, the presence of bars which are typically not modeled in bulge/disk decompositions, the influence of additional nuclear components such as star clusters or nuclear disks, and partially depleted cores. The latter two issues can be dealt with by either simultaneously fitting a Sérsic function plus some additional function to account for the excess flux above that of the host galaxy (e.g., Graham & Guzmán 2003; Ferrarese et al. 2006a), or with the use of the core-Sérsic model (Graham et al. 2003b; Trujillo et al. 2004). However, due to these various issues, it can be difficult to acquire reliable individual uncertainties on the Sérsic index for every galaxy, hence our use of an average relative error. Similarly, the use of a fixed relative error of 13% and 5% was assigned to the velocity dispersion term used by Merritt & Ferrarese (2001b) and Tremaine et al. (2002), respectively, in their construction of the – relation (with the exception that they both used a 20% uncertainty for the Milky Way’s velocity dispersion).
We have used Tremaine et al.’s (2002) modified version of the routine FITEXY (Press et al. 1992), to solve the equation , by minimising the quantity
| (1) |
The measurement errors on and are denoted by and , and the intrinsic scatter is searched for by repeating the fit until equals 1. The uncertainty on is obtained when the reduced chi-squared value, , equals . Doing so, one obtains
| (2) |
with dex in . This fit is shown in Figure 1. The total absolute scatter in is 0.39 dex. Using either an optimistic 10% estimate for the uncertainty on (specifically, using ), or a more liberal 25% uncertainty (we used ), see for example Caon, Capaccioli, & D’Onofrio (1993), had no significant (1-) affect on either the slope or intercept of the above relation. The new intrinsic scatter was 0.35 dex and 0.27 dex, respectively.

The maximum 1- error on the predicted value of in galaxies for which is known is acquired by assuming uncorrelated errors on and the slope and intercept of the – relation. Gaussian error propagation for the linear equation , gives an error on equal to
In the presence of intrinsic variance, , the uncertainty on will be greater, such that, assuming the intrinsic variance is in the coordinate,
For our expression (equation 2) we have , and so , and therefore
| (3) | |||||
Given the debate over the slope of the – relation (Merritt & Ferrarese 2001b; Tremaine et al. 2002; Novak et al. 2006), it is of interest to know how much the uncertainty in the slope and intercept of the – relation may contribute to the uncertainty in the predicted SMBH masses. From equation 3, if one measures a bulge to have with , then the error in contributes 96% of . That is, the uncertainty on the slope and intercept of equation 2 are not substantial contributors to the error budget on . If one has a galaxy with or 9, and again , then the combined error from the uncertainty on the slope and intercept contributes only 14% of the error on .
We have additionally used the OLS regression analysis BCES() from the code of Akritas & Bershady (1996), which allows for both measurement errors and intrinsic scatter. For our sample of galaxies, we obtained
| (4) |
with dex in . Using an uncertainty of or for the value of had no significant (1) affect on either the slope or intercept of the above relation — which agrees well with that in equation 2.
3.1.1 Symmetrical regression
To obtain the intrinsic astrophysical relation, the modified version of FITEXY which minimizes equation 1 should not be used. The reason is because it is biased — to produce a low slope — by the minimisation of the intrinsic variance, , along the (i.e. ) axis. If the minimisation is instead performed along the (i.e. ) axis, then the term in the denominator of equation 1 will be replaced with . Making this substitution, and performing the new regression333We have ignored unknown, but possible, selection boundaries in that could bias such a fit (see, e.g., Lynden-Bell et al. 1988, their Figure 10)., one obtains , and dex in .
The average of the above two slopes from the modified FITEXY routine, (3.10+2.69)/2 = 2.90, agrees well with the slope obtained using the bisector linear regression routine BCES from Akritas & Bershady (1996), which gives
| (5) |
This relation is in good agreement with the (intrinsic astrophysical relation) presented in Graham et al. (2003a).
3.2 A curved relation
As noted in Graham et al. (2001, 2003a), we have no a priori knowledge that the – relation is linear. For this reason, in those papers we employed the use of both linear and non-linear statistics to measure the correlation strength. Here we go one step further by fitting a quadratic to the data.
We stress that, from a physical stand point, we do not know what the actual form of the relation should be. The quadratic equation which we adopt is an empirical model. In a Taylor series expansion it is simply the next order term. The – data may in fact be described by a double power-law, however this would require the use of four free parameters (a low- and high-mass slope, and a transition mass and transition Sérsic index). The quadratic relation has only three parameters and is the adopted model for explorations of non-linearity in the – data (Wyithe 2006a,b).
In passing we note that there have been claims that the – relation may not be linear, but has either negative curvature (e.g., Granato et al. 2004; Cirasuolo et al. 2005) positive curvature (e.g. Hopkins & Hernquist 2006), no curvature at even the 0.75-1.5 level (Wyithe 2006b)444The tighter constraint of 0.75 (that is, the factor in front of a quadratic term is inconsistent with zero at only the 0.75 level), comes from using SMBHs with resolved sphere’s of influence. Including galaxies with unresolved sphere’s of influence and adding in single epoch reverberation mapping masses (uncertain to factors of 3-4) weakens the result of a purely linear – relation, with the probability that the second order term does not equal zero ruled out at the (still weak) 1-5-2 level., or curves down at low SMBH masses and up at high SMBH masses (Sazonov et al. 2005). Given that the – relation is not linear, having a slope of 4 at the bright end and 2 at the faint end (Tonry 1981; Davies et al. 1983; Held et al. 1992; De Rijcke et al. 2005; Matković & Guzmán 2005), and if the – relation is linear, then the – relation obviously cannot be linear, but must have a positive curvature. Of course, the – relation may not be linear.
We fit the quadratic equation , to the () data by minimising the statistic
| (6) |
where , , and is the intrinsic variance which, given our objective of predicting new SMBH masses, we attribute entirely to reside in the direction. Solving for , we find
| (7) | |||||
with dex. The total absolute scatter in is 0.31 dex. From Figure 2, the term is inconsistent with a value of zero at greater than the 99.99% confidence level555Excluding the two galaxies with the highest SMBH masses, the total absolute scatter reduces to 0.25 dex, the intrinsic scatter drops to zero, and one finds that , and , only a 1- deviation from the values obtained using the full data set. Using the full data set, but with the intrinsic scatter set to zero, the value of is still inconsistent with a value of zero at the 3- level..
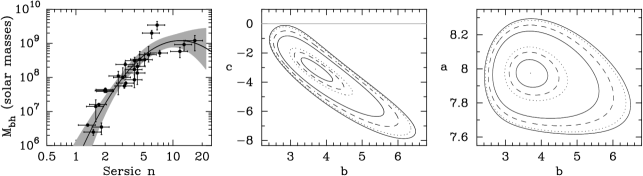
With small data sets, formal errors can under-estimate the true error on a fitted parameter. To explore the danger that we may be under-estimating the uncertainty on the parameter in front of the quadratic term in equation 7, we use Bootstrap Monte Carlo simulations. The random number generator ran1 from Press et al. (2002) was used in a bootstrapping process that involved sampling (with replacement) from the original 27 data points. One thousand data sets containing 27 data points each were then individually fitted to find the optimal log-quadratic equation, exactly as done with the original data. This then gave 1000 new estimates for each of the three parameters (). The range in values covered by the central 68.3% of these three data sets gives one an estimate of the 1- confidence intervals — without making any assumption about (the Gaussianity of) the distribution. This parameter range is found to be (7.88…8.04, 3.26…4.24, 3.98…2.30). This is in good agreement with the 1- parameter uncertainties obtained from Figure 2 and given in equation 7. We therefore conclude that we are not under-estimating our errors, and that the – relation is indeed curved.
Using equation 7, and the value of in other galaxies, the maximum error on the predicted value , denoted by , can be written as
which equates to
| (8) | |||||
Assuming , Table 2 gives the value of for different values of . Obviously the error in the slope of the relation (similarly for the linear relation) causes the masses to be less well constrained at the end of the relation. Due to the steepness of the quadratic relation at low , the uncertainty on the estimated SMBH masses can be large there.
In passing we note one of the implications of a curved – relation. Either the – relation must be curved, or the ratio can not be constant with mass.
| 0.5 | 1.0 | 2.0 | 3.0 | 4.0 | 8.0 | 10.0 | |
|---|---|---|---|---|---|---|---|
| Linear Fit (equation 2) | |||||||
| 5.72 | 6.53 | 7.34 | 7.81 | 8.15 | 8.96 | 9.22 | |
| 0.45 | 0.42 | 0.40 | 0.40 | 0.40 | 0.41 | 0.42 | |
| Quadratic Fit (equation 7) | |||||||
| 3.22 | 5.51 | 7.23 | 7.98 | 8.39 | 8.99 | 9.07 | |
| 1.05 | 0.70 | 0.47 | 0.38 | 0.33 | 0.36 | 0.43 | |
Note. — Uncertainty, dex, on an estimated black hole mass using the linear and quadratic – relations as a function of . The steepness of the quadratic relation at low results in both a better fit to the data for , but also an increased uncertainty on the predicted value of .