Metallicity as a criterion to select H2 bearing Damped Lyman- systems††thanks: Based on observations carried out at the European Southern Observatory (ESO) under prog. ID No. 65.O-0158, 65.O-0411, 67.A-0022, 67.A-0146, 69.A-0204, 70.B-0258, 072.A-0346 with UVES installed at the Very Large Telescope (VLT) on Cerro Paranal, Chile
Abstract
Aims. We characterize the importance of metallicity on the presence of molecular hydrogen in damped Lyman- (DLA) systems.
Methods. We construct a representative sample of 18 DLA/sub-DLA systems with log (H i) 19.5 at high redshift ( 1.8) with metallicities relative to solar [X/H] 1.3 (with [X/H] = log (X)/(H)log(X/H)⊙ and X either Zn, S or Si). We gather data covering the expected wavelength range of redshifted H2 absorption lines on all systems in the sample from either the literature (10 DLAs), the UVES-archive or new VLT-UVES observations for four of them. The sample is large enough to discuss for the first time the importance of metallicity as a criterion for the presence of molecular hydrogen in the neutral phase at high-.
Results. From the new observations, we report two new detections of molecular hydrogen in the systems at toward Q 2343125 and toward Q 2348011. We compare the H2 detection fraction in the high-metallicity sample with the detection fraction in the overall sample from Ledoux et al. (2003). We show that the fraction of DLA systems with log = log 2(H2)/(2(H2) + (H i)) 4 is as large as 50% for [X/H] 0.7 when it is only 5% for [X/H] 1.3 and 15% in the overall sample (with 2.5 [X/H] 0.3). This demonstrates that the presence of molecular hydrogen at high redshift is strongly correlated with metallicity.
Key Words.:
galaxies: ISM - quasars: absorption lines – quasars: individual: Q 2343125; Q 23480111 Introduction
Early searches for molecular hydrogen in DLAs, though not systematic, have lead to either small values of or upper limits on the molecular fraction of the gas. For a long time, only the DLA at toward Q 0528250 was known to contain H2 molecules (Levshakov & Varshalovich 1985, Foltz et al. 1988). Ge & Bechtold (1999) searched for H2 in a sample of eight DLAs using the MMT moderate-resolution spectrograph ( Å). Apart from the detection of molecular hydrogen at and 2.338 toward, respectively, Q 0013004 and Q 1232082, they measured in the other systems upper limits on in the range .
A major step forward in understanding the nature of DLAs through their molecular hydrogen content has recently been made possible by the unique high-resolution and blue-sensitivity capabilities of UVES at the VLT. In the course of the first large and systematic survey for H2 at high redshift, we have searched for H2 in DLAs down to a detection limit of typically H cm-2 (Petitjean et al. 2000, Ledoux et al. 2003). Out of the 33 surveyed systems, eight had firm detections of associated H2 absorption lines. Considering that three detections were already known from past searches, H2 was detected in % of the surveyed systems. The existence of a correlation between metallicity and depletion factor, measured as [X/Fe] (with X = Zn, S or Si) was demonstrated (see also Ledoux et al. 2002a) and the DLA and sub-DLA systems where H2 was detected were usually among those having the highest metallicities.
However, the high metallicity end of the Ledoux’s sample was biased by the presence of already known detections. Therefore, to investigate further this possible dependence with metallicity, and derive what is the actual molecular content of the high-redshift gas with highest metallicity, we have searched a representative sample of high metallicity DLAs for H2. The number of H2 measurements in systems with [X/H] 1.3 is twice larger in our sample compared to previous surveys. We describe the sample and the observations in Section 2, present two new detections of H2 in Section 3 and the results of the survey and our conclusions in Section 4.
2 Sample and Observations
We have selected from the literature all DLAs and sub-DLAs systems (H i) with previously measured elemental abundances (e.g. Prochaska & Wolfe 2001, Kulkarni & Fall 2002) larger than [X/H] 1.3 and accessible to UVES. The inclusion of sub-DLAs is justified by the fact that for H i most of the hydrogen is neutral (Viegas 1995). In addition, Ledoux et al. (2003) have shown that for log (H i) 19.5, there is no correlation between the presence of H2 and the H i column density. The fact that we include ALL known systems with these criteria guarantees that the sample is representative of the population of DLA-subDLA.
We ended up with a sample of 15 DLAs and 3 sub-DLAs (with log (H i) = 19.7,
20.10 and 20.25) presented in Table 1. The H2
content of ten of these systems had already been published (Srianand & Petitjean 2001,
Petitjean et al. 2002, Ledoux et al. 2002b, 2003, 2006b, Srianand et al. 2005
and Heinmüller et al. 2006). Five of the eight remaining systems had
data in the UVES archive (Q 1209093: Prog. 67.A-0146 P.I. Vladilo; Q 2116358:
Prog. 65.O-0158 P.I. Pettini; Q 2230025: Prog. 70.B-0258, P.I. Dessauges-Zavadsky;
Q 2243605: Prog. 65.O-0411 P.I. Lopez; Q 2343125: Prog. 69.A-0204 and 67.A-0022,
P.I. D’Odorico).
New observations of Q 0216080, Q 2206199, Q 2343125 and Q 2348011
have been performed with the Ultraviolet and Visible Echelle Spectrograph
(UVES, Dekker et al. 2000)
mounted on the ESO Kueyen VLT-UT2 8.2 m telescope on Cerro Paranal in Chile.
These new observations resulted in two new detections described in the next Section.
The data for each of the eight QSOs
were reduced using the UVES
pipeline
which is available as a context of the ESO
MIDAS data reduction system (see e.g. Ledoux et al. 2003 for details).
Standard Voigt-profile fitting methods were used for the analysis of metal lines
and molecular lines, when detected,
to determine column densities using the oscillator strengths compiled in
Ledoux et al. (2003) for metal species and the oscillator strengths given
by Morton & Dinerstein (1976) for H2. We adopted the Solar abundances
from Morton (2003) based on meteoritic data from Grevesse & Sauval (2002).
The characteristics of the sample are summarized in Table 1. The H i column densities and most of metallicities are from the compilation by Ledoux et al. (2006a). Slight differences with previously published values, e.g. Ledoux et al. (2003), are due to the use of different damping coefficients for H i. The only known H2 bearing DLA system out of this sample is the system at = 2.337 toward Q 1232+082 (Srianand et al. 2000).
| QSO | H i 1 | [X/H 1 | X | H 2 | 3 | References | |||
|---|---|---|---|---|---|---|---|---|---|
| Q 0013004 | 2.09 | 1.973 | Zn | 17.72–20.00 | |||||
| Q 0112306 | 2.99 | 2.702 | Si | ||||||
| Q 0216080 | 2.99 | 2.293 | Zn | ||||||
| Q 0347383 | 3.22 | 3.025 | Zn | ||||||
| Q 0405443 | 3.02 | 2.595 | Zn | ||||||
| Q 0458020 | 2.29 | 2.040 | Zn | ||||||
| Q 0528250 | 2.77 | 2.811 | Zn | ||||||
| Q 0551366 | 2.32 | 1.962 | Zn | ||||||
| Q 1037270 | 2.23 | 2.139 | Zn | ||||||
| Q 1209093 | 3.30 | 2.584 | Zn | ||||||
| Q 1441276 | 4.42 | 4.224 | S | ||||||
| Q 1444014 | 2.21 | 2.087 | Zn | ||||||
| Q 2116358 | 2.34 | 1.996 | Zn | ||||||
| Q 2206199 | 2.56 | 1.921 | Zn | ||||||
| Q 2230025 | 2.15 | 1.864 | S | ||||||
| Q 2243605 | 3.01 | 2.331 | Zn | ||||||
| Q 2343125 | 2.51 | 2.431 | Zn | ||||||
| Q 2348011 | 3.01 | 2.426 | S | ||||||
3 Two new detections
We report two new detections of H2 in DLAs from our new observations. Detail analysis and interpretation of the physical conditions in these two DLAs are out of the scope of the present work and will be described in a subsequent paper.
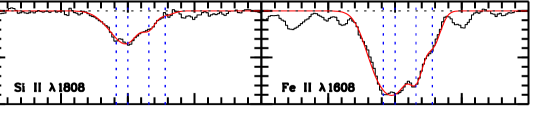
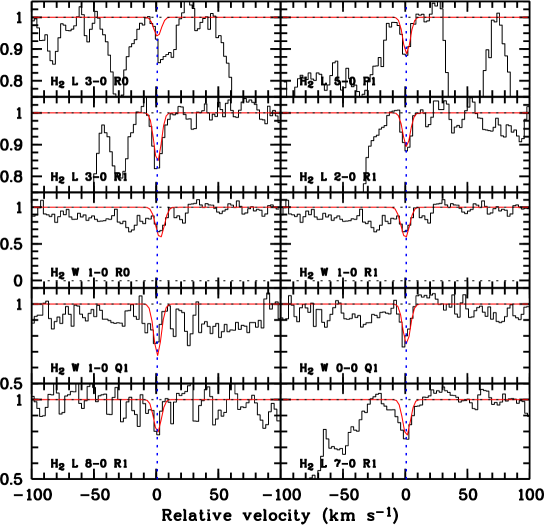
3.1 Q 2343125,
This DLA system has first been studied by Sargent et al. (1988). High resolution data have been described by Lu et al. (1996), D’Odorico et al. (2002) and Dessauges-Zavadsky et al. (2004). The profile of the metal lines is spread over more than 250 km s-1 from = 2.4283 to 2.4313 but the strongest component is centered at corresponding to the red edge of the above redshift range. From Voigt–profile fitting to the H i Lyman–, and lines, we find that the damped Lyman- line is centered at and the column density is log (H i) = , consistent with previous measurement by D’Odorico et al. (2002; log (H i) = ). We use Zn as the reference species for metallicity measurement and find [Zn/H] = 0.890.08. This is consistent with previous findings. Absorption from the J = 1 and probably from the J = 0 rotational levels of H2 is detected in this system at (see Fig. 1). The optically thin H2 absorption lines are very weak, i.e. close to but above the 3 detection limit. A very careful normalization of the spectrum has been performed, adjusting the continuum while fitting the lines. The best-fitting consistent model for H2 is shown in Fig. 1. The total H2 column density, integrated over the J = 0 and 1 levels, is estimated to be log (H2) = (12.970.04 and 13.600.10 for J = 0 and 1 respectively). This leads to the smallest molecular fraction observed up to now, log = . We also derive an upper limit on the detection of absorption from the J = 2 level, log (H2-J=2) at the 3 level.
3.2 Q 2348011,
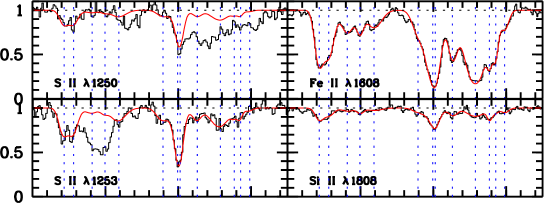
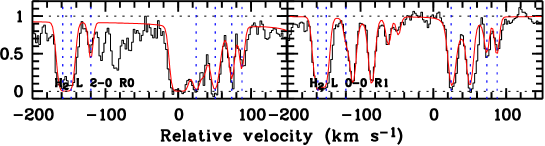
There are two DLA systems at and toward Q 2348011, with total neutral hydrogen column densities of respectively log (H i) = and log (H i) = . Conspicuous H2 absorptions are detected in the DLA system, the only system to be considered here as displaying a high metallicity (see Fig. 2). The molecular lines are very numerous and strong but the spectral resolution of our data is high enough to allow unambiguous detection and accurate determination of the line parameters. Seven H2 components spread over about 300 km s-1 were used for the H2 fit. It is interesting to note that the strongest metal component (at = 0 km s-1 in Fig. 2) has no associated H2 absorption. Strong H2 absorption is seen at 150 and +50 km s-1. All seven molecular components have associated C i absorption. However, additional components are needed to fit the metal absorption lines: 9 components for C i and 13 components for the singly ionized species. H2 absorption from the rotational levels J = 0 to 5 are unambiguously detected. The total H2 column density integrated over all rotational levels is log (H2) = 18.45, corresponding to a molecular fraction log = . We also derive an upper limit on the column density of HD molecules, leading to log (HD)/(H2) -3.3.
4 Metallicity as a criterion for the presence of molecular hydrogen
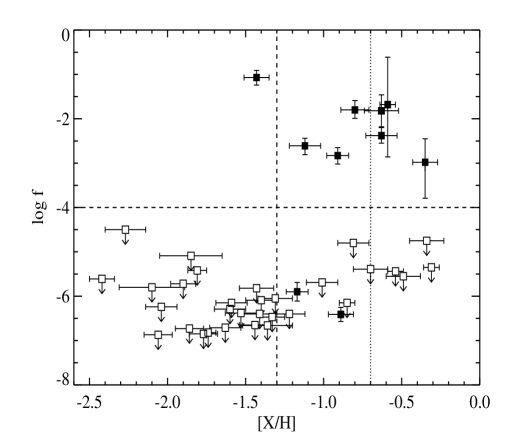
From Table 1, it can be seen that H2 is detected in nine high-metallicity systems out of 18. However, for two of the detections, the corresponding value of log is smaller than most of the upper limits derived for other systems. All upper limits are smaller than 4.5 and all detections larger than these upper limits are larger than 3. We therefore define a system with large (respectively small) H2 content if log is larger (respectively smaller) than 4.
In Fig. 3 we plot the molecular fraction, log , versus metallicity, [X/H], for our representative sample of DLAs with [X/H] (18 measurements summarized in Table 1) and measurements by Ledoux et al. (2003) for [X/H] (23 measurements). The log distribution is bimodal with an apparent gap in the range log justifying the above classification of systems. Note that this jump in log has already been noticed before by Ledoux et al. (2003) and is similar to what is seen in our Galaxy (Savage et al. 1977; see also Srianand et al. 2005). It is apparent that the fraction of systems with molecular fraction log increases with increasing metallicity. It is only 5% for [X/H] when it is 39% for [X/H] . This fraction is even larger, 50%, for [X/H] which is the median metallicity for systems with [X/H] . In addition, all systems with [X/H] have log .
We conclude that metallicity is an important criterion for the presence of molecular hydrogen in DLAs. This may not be surprizing as the correlation between metallicity and depletion of metals onto dust grains (Ledoux et al. 2003) implies that larger metallicity means larger dust content and therefore larger H2 formation rate. In addition, the presence of dust implies a larger absorption of UV photons that usually dissociate the molecule. More generally, Ledoux et al. (2006a) have shown that a correlation exists between metallicity and velocity width in DLAs. If the latter kinematic parameter is interpreted as reflecting the mass of the DM halo associated with the absorbing object, then DLAs with higher metallicity are associated with objects of larger mass in which star formation could be enhanced. All this makes it arguable that, in DLAs, star-formation activity is probably correlated with the molecular fraction (Hirashita & Ferrara 2005). It is therefore of first importance to survey a large number of DLA systems to define better their molecular content and use this information to derive the physical properties of the gas and the amount of star-formation occuring in the associated objects.
Acknowledgements.
PPJ thanks ESO for an invitation to stay at the ESO headquarters in Chile where part of this work was completed. RS and PPJ gratefully acknowledge support from the Indo-French Centre for the Promotion of Advanced Research (Centre Franco-Indien pour la Promotion de la Recherche Avancée) under contract 3004-3. PN is supported by an ESO student fellowship.References
- (1) Dekker, H., D’Odorico, S., Kaufer, A., Delabre, B., & Kotzlowski, H. 2000, Proc. SPIE, Vol. 4008, p. 534
- (2) Dessauges-Zavadsky, M., Calura, F., Prochaska, J. X., D’Odorico, S., & Matteucci, F. 2004, A&A, 416, 79
- (3) D’Odorico, V., Petitjean, P., & Cristiani, S. 2002, A&A, 390, 13
- (4) Foltz, C. B., Chaffee, F. H. Jr., & Black, J. H. 1988, ApJ, 324, 267
- (5) Ge, J., & Bechtold, J. 1999, in Carilli C. L., et al., eds., Highly redshifted Radio Lines, ASP Conf. Series, Vol. 156, p. 121
- (6) Grevesse, N., & Sauval, A. J. 2002, Adv. Space Res., 30, 3
- (7) Heinmüller, J., Petitjean, P., Ledoux, C., Caucci, S., & Srianand, R. 2006, A&A, 449, 33
- (8) Hirashita, H., & Ferrara, A. 2005, MNRAS, 356, 1529
- (9) Kulkarni, V. P., & Fall, S. M. 2002, ApJ, 580, 732
- (10) Ledoux, C., Bergeron, J., & Petitjean, P. 2002a, A&A, 385, 802
- (11) Ledoux, C., Srianand, R., & Petitjean, P. 2002b, A&A, 392, 781
- (12) Ledoux, C., et al. 2006a, A&A, astro-ph/0606185
- (13) Ledoux, C., Petitjean, P., & Srianand, R. 2006b, ApJ, 640, L25
- (14) Ledoux, C., Petitjean, P. & Srianand, R. 2003, MNRAS, 346, 209
- (15) Levshakov, S. A., & Varshalovich, D. A. 1985, MNRAS, 212, 517
- (16) Lu, L., et al. 1996, ApJS, 107, 475
- (17) Morton, D. C. 2003, ApJS, 149, 205
- (18) Morton, D. C., & Dinerstein, H. L. 1976, ApJ, 204, 1
- (19) Petitjean, P., Srianand, R., & Ledoux, C. 2000, A&A, 364, L26
- (20) Petitjean, P., Srianand, R., & Ledoux, C. 2002, MNRAS, 332, 383
- (21) Prochaska, J. X., & Wolfe, A. M. 2001, ApJS, 137, 21
- (22) Sargent, W. L. W., Boksenberg, A., & Steidel, C. C. 1988, ApJS, 68, 539
- (23) Savage, B. D., Bohlin, R. C., Drake, J. F., & Budich, W. 1977, ApJ, 216, 291
- (24) Srianand, R., Petitjean, P., & Ledoux, C. 2000, Nature, 408, 931
- (25) Srianand, R., & Petitjean, P. 2001, A&A, 373, 816
- (26) Srianand, R., Petitjean, P., Ledoux, C., Ferland, G., & Shaw, G. 2005, MNRAS, 362, 549
- (27) Viegas, S. M. 1995, MNRAS, 276, 268