The H.E.S.S. View of the Central 200 Parsecs
Abstract
The inner few hundred parsecs of our galaxy provide a laboratory for the study of the production and propagation of energetic particles. Very-high-energy -rays provide an effective probe of these processes and, especially when combined with data from other wave-bands, -rays observations are a powerful diagnostic tool. Within this central region, data from the H.E.S.S. instrument have revealed three discrete sources of very-high-energy -rays and diffuse emission correlated with the distribution of molecular material. Here I provide an overview of these recent results from H.E.S.S.
1 Introduction
The central 200 pc of our Galaxy is a unique region that harbours many remarkable objects — including several potential sites of effective particle acceleration. Non-thermal emission (particularly in the radio, X-ray and -ray bands) can be used to trace the energetic particle populations of this region. X-ray and radio observations of synchrotron emission provide information on the product of the local magnetic field energy density and the density of relativistic electrons. The flux of inverse Compton -rays, on the other hand, is proportional to the radiation field density (and the electron density). The combination of -ray and X-ray measurements therefore provides a powerful tool for probing both magnetic field strength and energetic particle content. Moreover, -rays provide an effective tracer for hadronic particles: proton-proton interactions in the interstellar medium lead to the production and decay of pions and hence -ray production. The combination of -ray measurements with tracers of atomic and molecular material may be the only way to effectively trace energetic hadrons in our galaxy.
The usefulness of -ray observations has traditionally been limited by poor angular resolution and modest sensitivity. A major step forward in the very-high-energy (VHE, GeV) domain has recently been taken with the commissioning of H.E.S.S. (High Energy Stereoscopic System). H.E.S.S. is an array of four, 13 m diameter, imaging Cherenkov telescopes located in the Khomas highlands of Namibia [1], a southern hemisphere location ideal for observations of the Galactic Centre (GC). H.E.S.S. has an angular resolution of a few arc-minutes and a locational accuracy of for typical point sources. The instrument reaches an energy flux sensitivity of erg cm-2 s-1, an order of magnitude lower than the previous generation of VHE instruments. The wide field of view of H.E.S.S. (5∘ in diameter) enables us to simultaneously monitor the entire central 200 parsec region. Results from the first two years of H.E.S.S. GC observations are described here.
2 The central VHE gamma-ray source: HESS J1745-290
During 2004, detection of a compact source of VHE -rays close to the GC was claimed almost simultaneously by groups using three Imaging Air-Cherenkov Telescope (IACT) systems: CANGAROO [4], Whipple [5] and the partially complete H.E.S.S. array [6]. The best localisation of this source (HESS J1745-290) is that derived from H.E.S.S. data, which places the emission within of Sgr A⋆. The initial spectral results from the three groups were originally in serious disagreement. While all groups agree on a power-law spectrum (), the photon indices of H.E.S.S. () and CANGAROO () differ substantially, and the single flux point at 2.8 TeV published by the Whipple collaboration was a factor 1.5 above the H.E.S.S. flux. However, further analysis of the CANGAROO data yielded a much larger error on the photon index: [7] and a more detailed analysis of the Whipple data yielded a photon index of and a flux consistent with the H.E.S.S. value [8]. The final confirmation of the hard energy spectrum seen by H.E.S.S. came with the detection of this source by MAGIC [9]. The MAGIC flux and photon index () show good agreement with H.E.S.S. values.
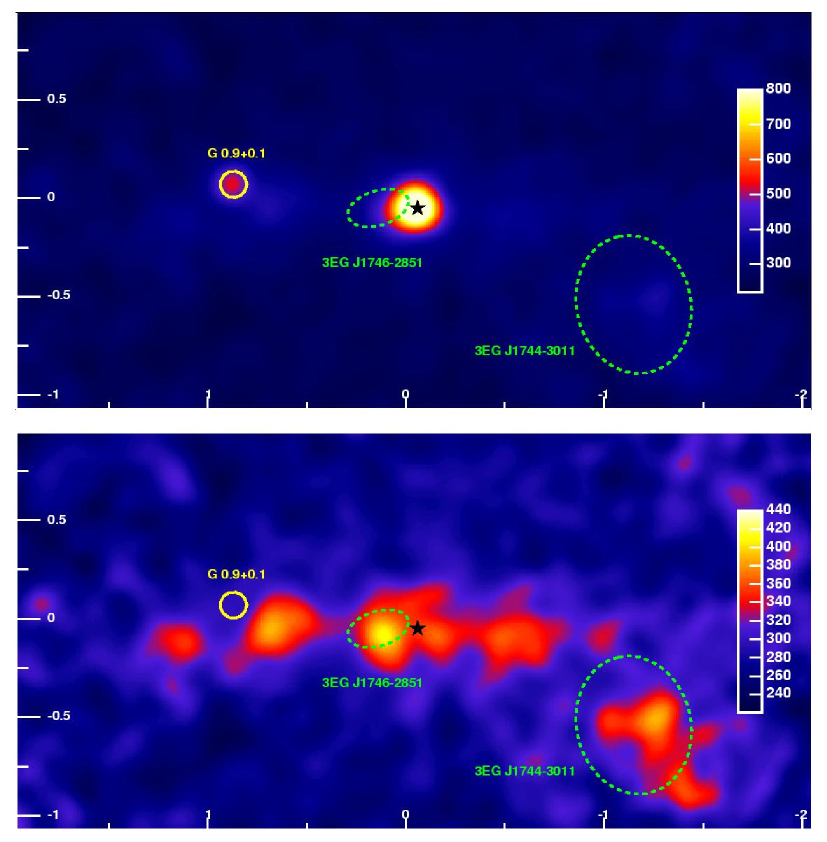
The construction of the H.E.S.S. array was completed in late 2003 and 50 hours of full sensitivity observations of the GC took place in 2004. The upper panel of Fig. 1 shows a smoothed count map of the central four degrees of our galaxy from these 2004 data [2]. Two VHE -ray sources are clearly apparent: one coincident with the SNR G 0.9+0.1 (discussed in section 4) and the unidentified source HESS J1745-290 in the Sgr A region. The higher sensitivity observations in 2004 confirm the spectral shape and source position derived from the H.E.S.S. two-telescope data. The source position derived from the 2004 dataset lies from Sgr A⋆. The updated photon index is [10]. No significant variability is found on time-scales of days or hours in the 2004 dataset.
Within the error circle of the H.E.S.S measurement lie three compelling candidates for the origin of the VHE emission: the shell-type supernova remnant (SNR) Sgr A East (see e.g. [11], the newly discovered pulsar wind nebula G 359.950.04 [12] and the supermassive black hole Sgr A⋆ itself (see e.g. [13]). Several radiation mechanisms have been discussed for these three objects. Plausible mechanisms include inverse Compton scattering of energetic electrons, the decay of pions produced in the interactions of energetic hadrons with the interstellar medium or dense radiation fields and finally curvature radiation of ultra-high energy protons close to Sgr A⋆. For some production scenarios, correlated variability is expected in X-rays and -rays. Simultaneous observations of the Sgr A region with H.E.S.S. and Chandra took place in July 2005 and may help to clarify this situation.
A widely discussed alternative to these astrophysical origins is the annihilation of dark matter in the central cusp in the density profile of our galaxy. However, the hard power-law spectrum of the central source is hard to reconcile with a dark matter interpretation (see [14] for a detailed discussion).
3 Diffuse emission from the Central Molecular Zone
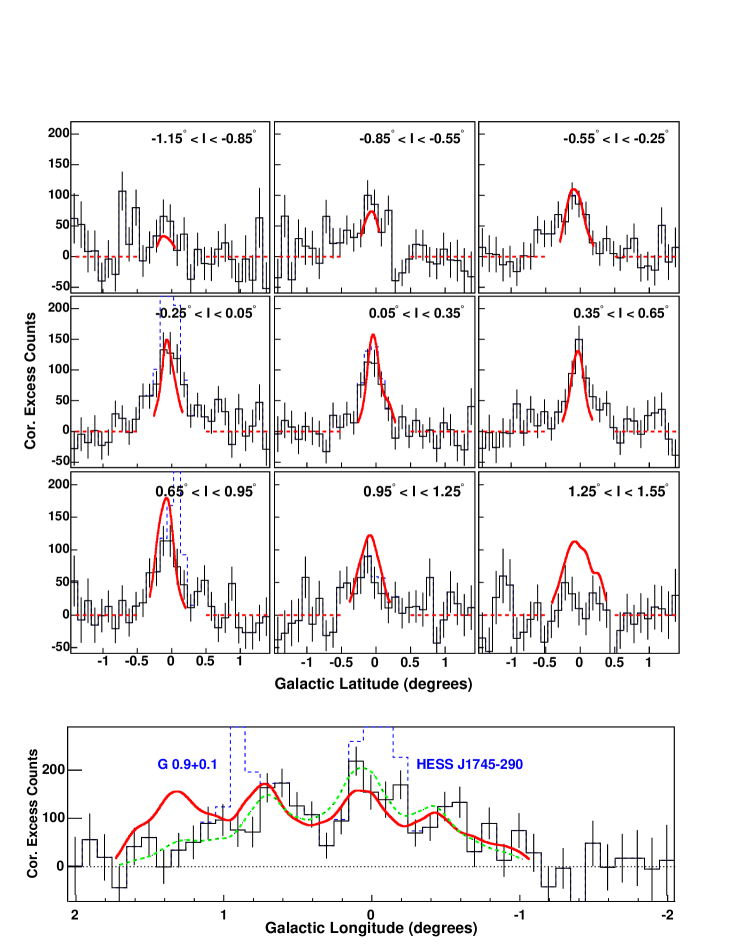
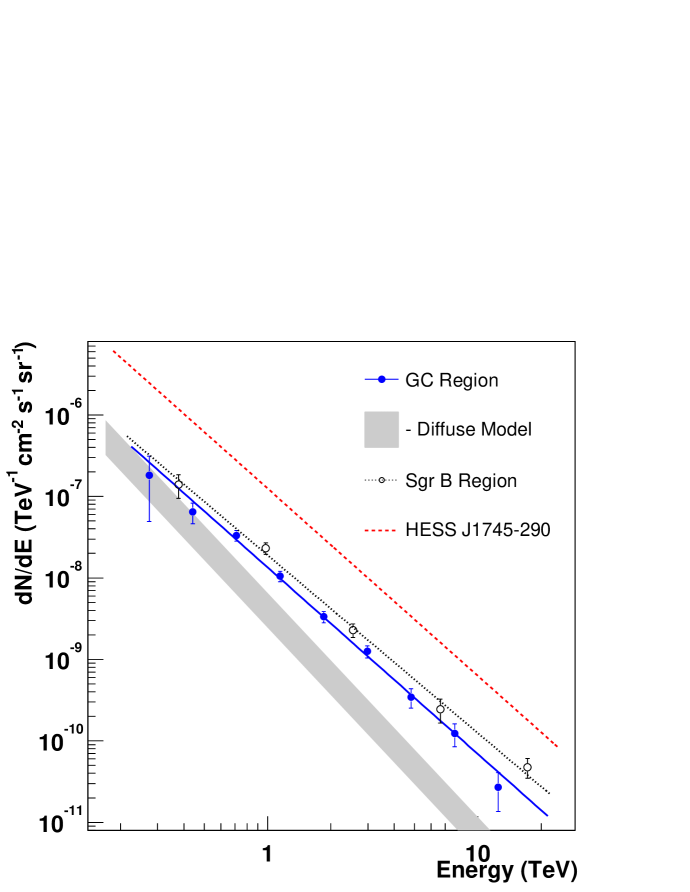
The dense gas clouds of the central molecular zone provide effective targets for the production of -rays via the interactions of hadrons. Indeed, the recent H.E.S.S. observations reveal TeV emission correlated with these clouds (see the lower panel of Fig. 1). This is the first case in which such a correlation has been seen at these energies. Galactic longitude and latitude distributions of the diffuse VHE emission are shown in Fig. 2. In Fig. 2, maps of CS (J=1-0) emission from [15] have been used to estimate the column density of the GC clouds. The ratio of -ray emission to column density provides a measure of the density of TeV cosmic rays (CRs) in the Galactic Centre region. Assuming that the locally measured CR spectrum is valid in the GC, we can predict the expected -decay -ray spectrum in the Central Molecular Zone. Fig. 3 shows this expectation as a grey shaded box. The measured data show a significantly harder energy spectrum than this expectation, indicating an excess of high energy hadrons in the GC, relative to the solar neighbourhood. Interestingly, the spectrum of the diffuse emission is very similar to that of the central source HESS J1745-290 (dashed line in Fig. 3).
From the lower panel of Fig. 2 it appears that the ratio of -ray emission to molecular density varies with galactic longitude, with a pronounced dip at . The implied non-uniform CR density can be explained if CRs injected close to Sgr A have not yet had time to diffuse out to . Assuming a diffusion coefficient of , the approximate value in the Galactic Disk at TeV energies, an angular displacement of at the distance of the GC corresponds to a diffusion time of 104 years, close to the age of the SNR Sgr A East [16]. The energy required to fill the central 200 parsecs with CRs with the observed density (extrapolating the measured H.E.S.S. spectrum down to 1 GeV) is ergs, remarkably close to the CR energy input required from a typical Galactic SNR in the paradigm of CR acceleration in these objects. A historical burst of activity in Sgr A⋆ also provides a natural explanation for the observed CR excess.
4 The Pulsar Wind Nebula in G0.9+0.1
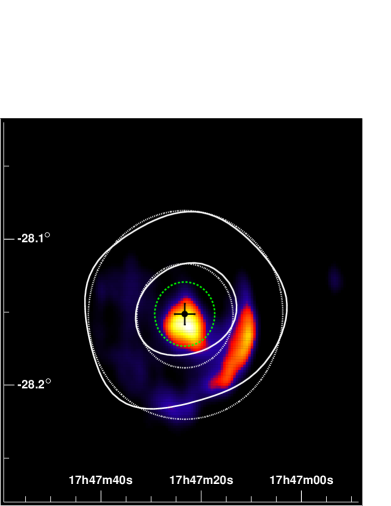
G 0.9+0.1 is a composite radio SNR with a clear ‘core plus shell’ morphology (see for example [17]). Observations with Chandra [18] and XMM [19] revealed hard X-ray emission from the core and weak (likely thermal) emission from the SNR shell. The characteristic softening of the X-ray spectrum with distance from the core indicates the likely plerionic nature of this source, although no radio pulsar has been identified (likely due to the large dispersion associated with the GC region). VHE -ray emission coincident with G 0.9+0.1 was discovered by the H.E.S.S. collaboration in 2005 [20]. Fig. 5 shows the position of the H.E.S.S. source in comparison to radio measurements. The VHE emission is unresolved by H.E.S.S. and an upper limit of on the rms size of the emission region has been derived. This limit allows us to exclude a -ray origin in the shell of the SNR and strongly suggests a common plerionic origin of the -ray and X-ray emission, arising respectively from inverse Compton scattering and Synchrotron radiation of energetic electrons within the nebula.
Pulsar wind nebulae (PWN) are prominent members of the VHE -ray source catalogue. Recent -ray observations with H.E.S.S. of known X-ray PWN such as Vela-X [21] and MSH 15-52 [22] show close correlations between X-ray and VHE -ray emission. Combined X-ray/-ray observations provide information on the magnetic field in the nebula and on the spatial distribution of electrons. For the distant PWN of G 0.9+0.1 the emission is currently unresolvable in -rays but the average magnetic field in the nebula can be estimated at G [20].
G 0.9+0.1 is not seen in VHE -ray observations with MAGIC, but the non-detection is not in conflict with the H.E.S.S. result, given the lower sensitivity of the MAGIC dataset [9].
5 Unidentified Source HESS J1745-303
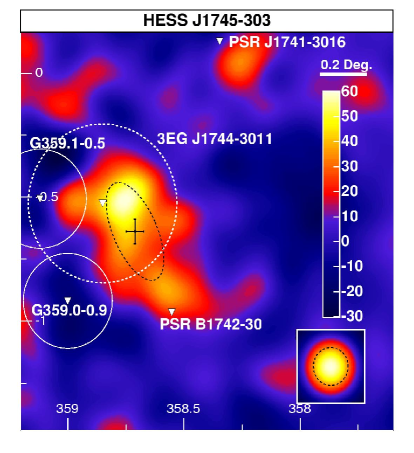
The H.E.S.S. survey of the inner galaxy [23], combined with deep exposures on targets such as the GC and RX J1713.7-3946 [24] has resulted in the detection of many extended () -ray sources without clear counterparts at other wavelengths. One such source is HESS J1745-303, located from Sgr A. Fig. 5 shows a count map of this source, illustrating the positions of nearby supernova remnants and energetic pulsars. The most compelling potential counterpart is the (also unidentified) lower energy -ray source 3EG 1744-3011. A fit of a elliptical gaussian source profile yields a position of and an rms source size of . Deeper observations in all wavebands are clearly desirable to help identify this MeV-TeV -ray source.
6 Conclusions
Present and future -ray observations will play a key role in our understanding of the physical processes at work in the Galactic Centre. Key outstanding issues, such as the spatial distribution and strength of magnetic fields and the energy density of relativistic particles, can be addressed with the help of such observations. H.E.S.S. has provided the first sensitive view of this region in very-high-energy -rays. In a few years time the combination of the second phase of the H.E.S.S. project and the GLAST satellite will provide unbroken sensitive coverage of the – eV -ray domain, with important consequences for Galactic Centre research.
References
References
- [1] Hinton, J.A. New Astron. Rev., 48, 331 (2004)
- [2] Aharonian, F. A., et al., Nature, 439, 695 (2006)
- [3] Mattox, J. R., Hartman, R. C. & Reimer, O., Astrophys. J. Supp. 135, 155 (2001)
- [4] Tsuchiya, K., et al., Astrophys. J., 606, L115 (2004)
- [5] Kosack, K., et al. Astrophys. J., 608, L97 (2004)
- [6] Aharonian, F. A., et al., Astron & Astrophys., 425, L13 (2004)
- [7] Katagiri, H., et al. Astrophys. J., 619, L163 (2005)
- [8] Kosack, K. P., PhD Thesis, Washington Uni. (2005)
- [9] Albert, J., et al. Astrophys. J., 638, L101 (2006)
- [10] Rolland, L. & Hinton, J. A. (for the H.E.S.S. collaboration), Proc. 29th ICRC, vol 4, p109 (2005)
- [11] Crocker, R. M., et al., Astrophys. J. 622, 892 (2005)
- [12] Wang, Q. D., Lu, F. J. & Gotthelf, E. V., MNRAS 367, 937, (2006)
- [13] Aharonian, F. & Neronov, A., Astrophys. & Space Sci. 300, 255 (2005)
- [14] Profumo, S., Phys. Rev. D, 72, 103521 (2005)
- [15] Tsuboi, M., Toshihiro, H & Ukita, N. Astrophys. J. Supp. 120, 1 (1999)
- [16] Rockefeller, G. et al., Astrophys. J. 635, L141 (2005)
- [17] LaRosa T.N. et al., Astron. J., 119, 207. (2000)
- [18] Gaensler, B. M., Pivovaroff, M. J., Garmire, G. P., Astrophys. J., 556, L107 (2001)
- [19] Porquet, D., Decourchelle, A., Warwick, R. S., Astron. & Astrophys., 401, 197 (2003)
- [20] Aharonian, F. A., et al., Astron & Astrophys., 432, L25 (2005)
- [21] Aharonian, F. A., et al., Astron & Astrophys., 448, 43 (2006)
- [22] Aharonian, F. A., et al., Astron & Astrophys., 435, L17 (2005)
- [23] Aharonian, F. A., et al., Astrophys. J., 636, 777 (2006)
- [24] Aharonian, F. A., et al., Astron & Astrophys., 449, 223 (2006)