Mass and Environment Drive the Evolution of Early–Type Galaxies
New information has recently become available on the fundamental plane for various samples of early-type galaxies with redshift up to 1.3, both in clusters and in the field. This information is reviewed and clues are derived on the evolution of spheroids over the last two thirds of the Universe lifetime as a function of galaxy mass and environment, in comparison with the predictions of the hierarchical models of galaxy formation. Using the Universe as a time-machine and interpreting changes in ratio as age differences, we see that the age increases with galaxy mass in all environments, cluster galaxies with any mass are older than field galaxies with the same mass, and the age difference between cluster and field galaxies increases with mass. The first two results confirm those obtained with other methods, and are reproduced by the most recent incarnation of the hierarchical models, while the third result is new and appears in contrast with the predictions of these models.
1 Introduction
Early–type galaxies (ETG) contain most of the visible mass in the Universe and are thought to reside in the highest density peaks of the underlying dark matter distribution. Therefore, understanding their evolution is crucial for understanding the evolution of galaxies and structures in general. ETG have the very interesting property that in the 3D space of their main parameters (the effective radius , the central velocity dispersion , and the average surface luminosity within , ) they concentrate on a plane, therefore called the fundamental plane (FP ). This implies a striking regularity in their structure and stellar population , which calls for a uniform process of formation and evolution. Studies of the FP at high redshift allow for a check on the persistence of this regularity back in time and offer the possibility to derive more stringent constraints on the formation history of ETG, using the Universe as a time-machine.
We have therefore made a uniform comparison of the best data available on the FP at 1, the highest redshift for which these data are currently available, and, by interpreting the differences in ratio directly derived from the FP parameters as age differences, we study how the ages of ETG depend on both galaxy mass and environment. We assume a flat Universe with , , and km s, and we use magnitudes based on the Vega system.
2 The data on the FP at 1
In selecting the data on the FP at 1 we pay particular attention to the completeness of the samples to faint optical magnitudes, because the galaxies with correspondingly small masses are those likely to show “downsizing” effects, i.e. the later and/or longer lasting formation of smaller mass galaxies , and differences with environment. In fact it has been shown that massive galaxies in the field behave similarly to massive galaxies in the clusters . We also consistently use data in the rest–frame B band. In the field the only ETG galaxy sample complete to faint magnitudes at 1, for which FP studies have been made, is the one derived from the K20 survey , which is complete down to , and covers the redshift range with 15 ETG over a total sky solid angle of 52 arcmin2. We have used also the sample of Treu et al., which, although not complete, contains 24 ETG in the same redshift range over 160 arcmin2 in the GOODS-N area, some of which are as faint as the faintest galaxies of di Serego Alighieri et al.. We have also examined the data presented by van der Wel et al., who have studied the FP on a sample of 27 field ETG in the range in two Southern fields, but eventually were forced not to include them in our analysis by the impossibility of understanding how they have selected the 13 primary ETG plotted in their figures from the 27 galaxies in their sample.
Until very recently there was no sample of cluster ETG at high redshift with FP information and complete to faint magnitudes . This is probably due to an observational selection effect, since on the clusters the slits of a single mask in a MOS spectrograph are easily filled with bright galaxies, and none is left for the fainter ones. We were very lucky that shortly before this Conference a FP study of two clusters at and , complete down to , has been published, and, although the data for the individual galaxies are not yet published, Inger Jørgensen has kindly made them available to us for the present analysis.
We have uniformly analized these three sets of data and we show in Fig. 1 the corresponding edge–on FP, compared to a recent analysis of the Coma cluster ETG , where galaxies with and emission–line galaxies have been excluded.
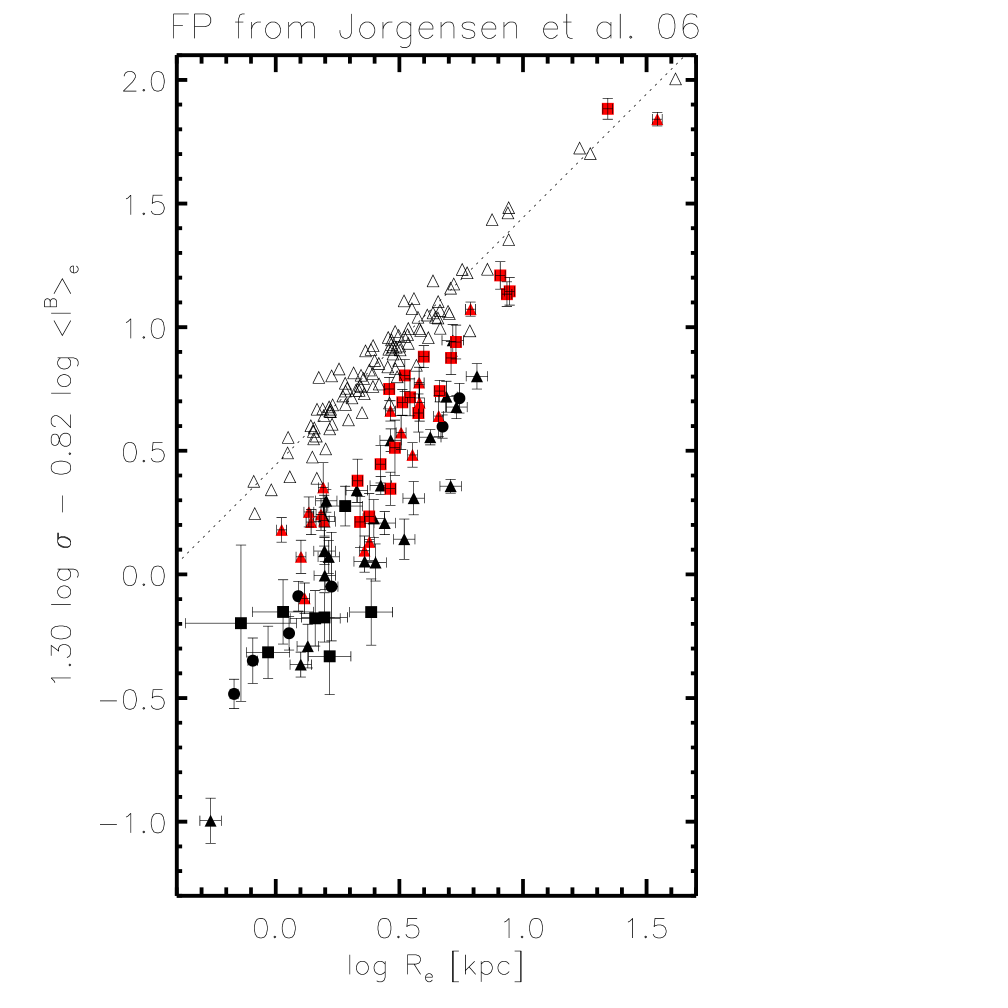
It is evident from Fig. 1 that the evolution of the FP consists both of a vertical shift and of a rotation, in the sense that the FP at 1 appears steeper that the local one, both in the field and in the clusters. As has been shown before , the change in the FP tilt is a necessary manifestation of “downsizing”. Notwithstanding this evolution, the FP has a remarkably small scatter also at 1.
3 Deriving ages from the FP parameters
It is customary and straightforward to interpret the evolution of the FP as changes in the ratio. In fact the FP parameters can be used to estimate the dynamical mass of the galaxies. For instance, from the Virial theorem and assuming homology, the mass is given by :
| (1) |
Then the ratio can be obtained for each high redshift galaxy and compared to that of local galaxies with the same mass, as shown in Fig. 2.
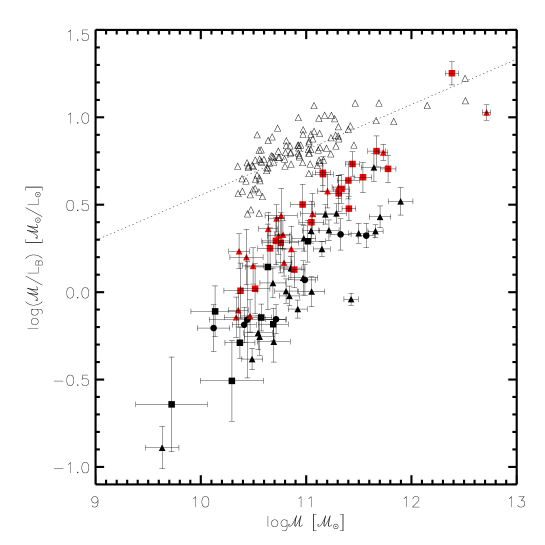
Evidently the difference in the ratio between a local ETG and one at 1 with the same mass is larger for smaller mass galaxies, both in the field and in the clusters, and seems smaller in the cluster than in the field. However the redshift of the two clusters is smaller that the average redshift of the field galaxies: therefore a deeper analysis is necessary to ensure that the differences with environment are not due just to redshift differences. Usually this is achieved by taking for each high redshift ETG the logarythmic difference in ratio ()) from that of a local galaxy with the same mass and comparing it to the straight line fit to the of ETG with in clusters with redshift ranging from 0 to 1.3 . However this analysis is unsatisfactory, because it is not clear why the massive cluster galaxies should be taken as a reference, and because it excludes the lower mass cluster galaxies from the analysis. We have therefore devised a different analysis with the aim of studying how the formation history of ETG depends on galaxy mass and environment. We interpret the changes in ration as differences in age. Maraston has developed simple stellar population synthesis models that allow one to estimate the ratio as a function of age (Fig. 3).

By fitting this relation, e.g. for solar metallicity, nd for a Kroupa we can therefore get the age (at ) of each galaxy from the observed for our assumed cosmology. The results are shown in Figure 4, compared to the median ages derived from a semianalytic model of hierarchical galaxy evolution .
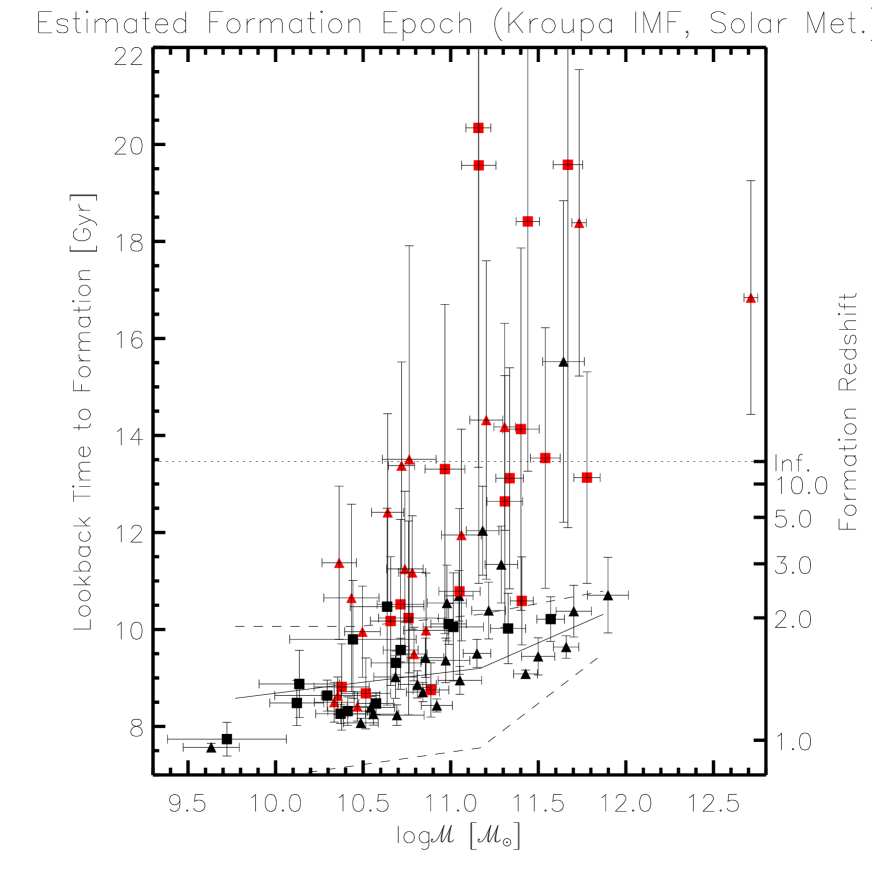
ETG age increases with mass (downsizing) both in the field and in the clusters. Field galaxies are younger than cluster galaxies with the same mass. The age difference between cluster and field galaxies with the same mass increases with mass. The first two results have been obtained before by other means and are reproduced by the most recent incarnation of the hierachical models. The third result is new and appears to go in the opposite way as predicted by the hierarchical models (see fig. 1 of De Lucia et al. ).
Note that after the Conference we have refined our estimate of galaxy ages, by evaluating the metallicity for each ETG from the velocity dispersion and then direclty using the population synthesis model appropriate for the derived metallicity without any fitting involved. We have also analysed selection effects. The resulting ages are very similar to those presented here and our conclusions are not affected .
Acknowledgments
We would like to thank Inger Jørgensen for allowing us to use her still unpublished data, and Claudia Maraston and Alvio Renzini for useful suggestions and discussions.
References
References
- [1] Renzini, A., ARA&A, in press (2006, also astro-ph/0603479)
- [2] Djorgovski, S. & Davis, M., ApJ 313, 59 (1987)
- [3] Dressler, A. et al., ApJ 313, 42 (1987)
- [4] Renzini, A. & Ciotti, L., ApJ 416, L49 (1993)
- [5] Cowie, L.L., Songaila, A., Hu, E.M., & Cohen, J.G., AJ 112, 839 (1996)
- [6] di Serego Alighieri, S. et al., A&A 442, 125 (2005)
- [7] Treu, T. et al., ApJ 633, 174 (2005)
- [8] van der Wel, A. et al., ApJ 631, 145 (2005)
- [9] van Dokkum, P. & Stanford, S.A., ApJ 585, 78 (2003)
- [10] Jørgensen, I. et al., ApJLett 639, L9 (2006)
- [11] Michard, R., A&A 91, 122 (1980)
- [12] Maraston, C., MNRAS 362, 799 (2005)
- [13] Kroupa, P., MNRAS 322, 231 (2001)
- [14] De Lucia, G., Springel, V., White, S.D.M., Croton, D. & Kauffmann, G., MNRAS 366, 499 (2006)
- [15] di Serego Alighieri, S., Lanzoni, B. & Jørgensen, I., ApJLett, in press (2006, also astro-ph/0607231)