Mid-Infrared Spectroscopic Diagnostics of Galactic Nuclei
Abstract
In this paper I summarize the science motivations, as well as a few mid-infrared spectroscopic methods used to identify the principal mechanisms of energy production in dust enshrouded galactic nuclei. The development of the various techniques is briefly discussed. Emphasis is given to the use of the data which are becoming available with the infrared spectrograph (IRS111The IRS was a collaborative venture between Cornell University and Ball Aerospace Corporation funded by NASA through the Jet Propulsion Laboratory and the Ames Research Center.) on Spitzer, as well as the results which have been obtained by IRS over the past two years.
University of Crete, Greece
1. Introduction
One of the open issues in extragalactic astronomy is how to quantify the physical mechanisms that contribute to the energy production in galactic nuclei. The most luminous galaxies often display strong evidence of massive star formation taking place in their nucleus. This is typically due to the large quantities of atomic and molecular gas driven in their center as a result of instabilities on their disk such as bars, which often form during tidal interactions. It is also widely accepted that most galactic nuclei likely harbor a super-massive black hole (SMBH) (see review of Ferrarese & Ford 2005). Due to the high densities found in the nuclei the SMBH may accrete matter at a variable rate, even though this accretion does not always result in emission of radiation (Narayan et al. 1998), which would characterize the galaxy as harboring an active nucleus (AGN). A prime example of such “non-AGN” is our own Galactic Center, which does contain a 106M⊙ SMBH and accretes material, but does not display any visible AGN activity (Genzel & Townes 1987; Ghez et al. 1998). However, in the cases where AGN activity is present, hard electromagnetic radiation, mostly in form of UV and X-rays, is emitted from the nucleus. This is typically observed either directly, in the form of X-rays and radio emission which are less affected by obscuration, and/or indirectly as high energy photons are absorbed by the gas and dust and subsequently re-emitted at longer wavelengths. So the original question naturally translates to what fraction of the bolometric energy observed from a galaxy originates from an accretion disk (AGN) compared to usual star formation activity. This issue is of particular interest in cases where most of the energy of a galaxy originates from the nuclear regions rather than the outer regions/disk.
Historically, our knowledge on the physics of the nuclear activity of galaxies is mostly based on optical and near-IR spectroscopy, obtained in major ground based telescope facilities. A wealth of diagnostic methods to classify and quantify the AGN activity have been developed over the years (ie Veilleux & Osterbrock 1987; Armus et al. 1989; Kennicutt 1998; Kewley et al. 2001). A presentation of these methods is well beyond the scope of this review but it is only fair to state that they have been extremely successful in providing insight into the properties of galactic nuclei, in particular in cases where a direct line of sight to the nucleus is available. Polarization measurements have also been very useful in identifying evidence of AGN activity, in cases where the nucleus is indirectly probed via scattered light (Heisler et al. 1997).
The effect of dust absorption though, which does vary substantially as a function of wavelength, is one of the principal reasons which complicate the interpretation of the optical data. It is useful to remind ourselves that a 10eV optical photon can penetrate 0.5mag of dust, while a 1keV X-ray photon can pass through a hydrogen column of cm-2. If we were to consider the case of our Galactic Center where the A30mag, only 1 in 1012 optical photons emitted in the nucleus of the Milky Way can reach our Sun. However, if we were to observe in K-band (2.2m) the A2.5mag, and one can detect 10% of the near-IR photons emitted from the source.
Based on the arguments above, X-rays are clearly the best diagnostic of an AGN especially for higher redshift systems, as the slope of the X-ray spectrum and the sensitivity of the detectors result in relatively flat sensitivity out to z4–5 (Brandt & Hasinger 2005). However, the energy emitted in X-rays from the majority of luminous extragalactic sources is erg s-1, several orders of magnitude bellow their bolometric luminosity. This, in addition to the fact that X-ray observations need to be performed from space, and most extragalactic sources are intrinsically faint in X-rays, makes estimates of the contribution of an AGN to their bolometric luminosity rather challenging (see Mushotzky 2004). Radio waves are an appealing alternative, in particular given the latest improvements in VLBA (Lonsdale et al. 1993, 2003). Even in this case though, there are difficulties in detecting higher redshift systems, as well as in disentangling issues related to non-thermal emission and self-absorption from embedded nuclei (see Condon 1992).
The use of the infrared part of the spectrum m in order to develop AGN diagnostics is an avenue which has been explored for the past twenty years for two main reasons: a) most luminous galaxies, QSOs being a “bright” exception, emit a sizeable fraction their energy (30% in the infrared and b) the infrared is considerably less affected by dust absorption than the optical.
The all sky survey by IRAS provided the first opportunity to classify a large number of galaxies based on the shape of their global spectral energy distribution (SED). de Grijp et al. (1987) showed that a ratio of S60S250.26222Where S25 and S60 are the 25 and to 60 m IRAS flux densities. could result in a 70% success rate in identifying previously unknown Seyferts. More recent developments on broadband mid-IR diagnostics are presented in another review on this volume.
2. Mid-IR Emission Line Diagnostics
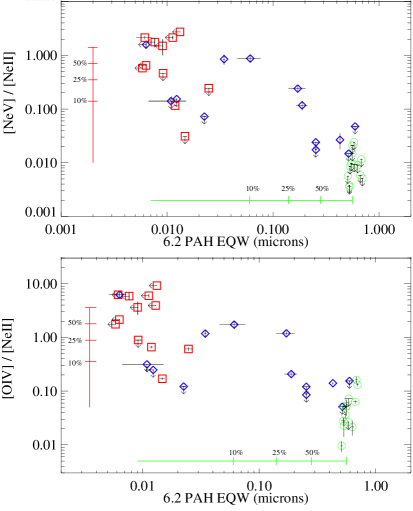
The advent of mid-IR spectroscopy with the Infrared Space Observatory (ISO) opened a new window in the study of active and starburst galaxies (see Verma et al. 2005, for a review). Emission lines from relatively high excitation ions which are not produced by O stars can be used as a direct proble of AGN activity. In the infrared such lines are the [NeV]m and [NeV]m with an ionization potential of 97.1eV, and the [OIV]333The [OIV] line was easier to detect by ISO, but its predictive power is not as strong since it can also be produced in areas of strong galactic outflows and shocks.m with 54.9eV. The neon lines were detected by ISO in Seyferts, though their detection in ULIRGs was challenging due to the limitations in the sensitivity of the ISO spectrographs (Genzel et al. 1998; Sturm et al. 2000). Another indicator is the strength of the PAH emission bands which are suppressed in AGN since the hard radiation field photo-dissociates the PAH molecules (Lutz et al. 1998).
The improved sensitivity of IRS on Spitzer (Houck et al. 2004; Werner et al. 2004), a factor of 100 compared to ISO, enables us to extend these diagnostics. More detections based on the [NeV] lines were secured for a large sample of galaxies and an in depth study of PAH emission has become possible (see Fig. 1). Moreover, techniques employing correlations based on the strength of other lines such as [SIV]m and [SIII]m or pricipal component analysis are also being explored (see Weedman et al. 2005; Armus et al. 2006; Brandl et al. 2006; Dale et al. 2006; Buchanan et al. 2006, for details). More specifically the use of the 6.2m PAH is now readily used instead of the 7.7m PAH which is more affected by uncertainties in the extinction due to the absorption by the 9.7m silicate feature.
In addition to the mid-IR high-ionization lines and the 6–18m PAH emission features, the strength of the 3.3m PAH has also been proven a useful AGN tracer. This feature, which can be probed from the ground for relatively bright sources, has an EW of 0.1m in starburst systems but is also supressed in AGN (see Imanishi 2006).
3. Mid-IR Continuum Diagnostics
Even though high ionization line emission is the ideal probe of an active nucleus, despite the IRS sensitivity, the lines are often difficult to detect in highly extinct and faint/distant sources. The presence of an AGN though can also be inferred by detecting the thermal emission from dust surrounding the putative torus heated by the accretion disk to nearly sublimation temperatures (1000K) and radiating in near equilibrium. This emission had been detected in Seyfert galaxies and is now evident in IRS spectra of distant sources (see Alonso-Herrero et al. 2003, and Fig. 2).
Unlike extreme starbursts or HII regions which also display a rising slope at m, due to the heating of the grains to T300K by the embedded O/B stars, the presence of this hot continuum at m is only seen in AGN. Laurent et al. (2000) proposed an AGN diagnostic method – now called the “Laurent Diagram” – which takes advantage of this difference, as well as the destruction of PAHs in both AGN and extreme starbursts. Using three template mid-IR spectra for a “pure” AGN, an HII region, and a photodissociation region (PDR) they defined an AGN dominated locus in a two parameter phase-space (see Fig. 3). The proximity of a galaxy to one of the three corners, i.e. the AGN corner, would suggest the extend by which the mid-IR spectrum displays AGN characteristics.
.
A first application of this method to Spitzer/IRS spectroscopy has been presented in Armus et al. (2006). In Figure 3 we display the principle of the method with the three template spectra used, as well the classification of a number of galaxies based on it. Even though we suggest the reader to review the original paper for a detailed discussion of the method, a few points are worth mentioning here.
-
•
The predictive power of the method depends strongly on the selection of the template spectra used as the three cornerstones. In the original paper of Laurent et al. (2000) Centaurus A was selected as the AGN template, while now the wealth of high quality IRS spectra enabled us to fine tune the selection.
-
•
The actual coordinates of the three templates depend on the corresponding PAH to 5.5m continuum and 14.5 to 5.5m continuum ratios. Since the continuum fluxes are calculated by integrating under the spectrum, the wavelength range used for the integration directly affects the value of the ordinate for all points in the diagram. It is not obvious that a flat spectrum will result in an ordinate equal to 1. In addition, the exact selection of the limits and underlying continuum in the calculation of the 6.2m PAH, also affects the value of the abscissa.
-
•
None of the templates have been corrected for extinction, so the intrinsic extinction in the observed integrated spectrum of a source may result in placing it outside the parameter space of the diagram. Note that the nucleus of a galaxy, which may contain a strong AGN and/or HII region component, is often more enshrouded than the PDR regions in its disk. As a result of this variable extinction, there is no one-to-one translation of an extinction vector for all points placed in the Laurent diagram.
-
•
The method provides quantitative means for estimating the AGN contribution to the “integrated mid-IR spectrum” of a galaxy. Even though the –m flux traces luminosity it has not yet been demonstrated that the this method can be used to estimate the contribution of an AGN to the infrared luminosity (LIR) of a system.
The “Laurent Diagram” appears to be the most powerful method for AGN classification in the mid-IR for galaxies where no detections or strong limits on high ionization lines are available. More analysis based on Spitzer/IRS spectra will be need to extend its predictive power to the whole IR. Ongoing work indicates that the method can also be applied in Spitzer/IRS low resolution spectroscopic studies of extended star forming regions where variations in the slope of the mid-IR spectrum and the strength of PAHs can be used to quantify the intensity of star formation of the regions (Leboutellier priv. comm.).
4. Theoretical Modeling
Another approach to quantitatively assess the contribution of the various components in the observed IR emission from a source is to fit the IR spectrum using theoretical models. Ideally one could use a full 3D radiative transfer calculation to model the dust properties and match the observed spectrophotometry. A large set of theoretical SEDs are now available for comparison with the observations (i.e. Elitzur & Shlosman 2006; Siebenmorgen & Kruegel 2006, and references therein.). However, limited knowledge of the details in the spatial distribution and geometry of the sources, in particular for systems such as starburst and ULIRGs, which are inherently disturbed, often make this approach rather challenging.
Recently, a new fitting approach relying on the Spitzer/IRS 5–38m spectra, using constrains from near- and far-IR observations has been developed (Marshall et al. 2006). The method assumes that the SED of a galaxy can be decomposed into dust components at different characteristic temperatures, source emission components, embedded photospheric emission from starburst cores or an active nucleus as well as PAH feature emission. The emission from each component is calculated using a realistic dust model consisting of a distribution of thermally emitting carbonaceous and silicate grains. The model accounts for stochastic emission from very small grains by fitting model PAH templates to the spectra. This method has been applied in a variety of Spitzer/IRS data and most sources are well fit by a maximum of four components referred as cold (30K), tepid (100K), warm (200K), and hot (300K). The results of the fits are used to calculate the relative bolometric contributions from the different components, providing a method to compare the infrared properties of starburst galaxies and quasars. Sample results of the fitting method on NGC7714 – a starburst galaxy – a ULIRG such as NGC6240 and the quasar PG0804+761 are presented in Figure 4.
5. Conclusions
It has become evident from the numerous contributions presented during this meeting that the high quality of Spitzer/IRS spectroscopy is opening new horizons in the use of the infrared as a tracer of the properties of nearby and high-redshift galaxies. With more than three years of mission to go, we have just glimpsed on the possibilities that lie ahead.
Acknowledgments.
I would like to thank Jim Houck for giving me the opportunity to spend 5.5 formative years in Ithaca and participate in the Spitzer/ IRS “venture”. I would also like to acknowledge all members of the IRS instrument team at Cornell and Caltech for many enlightening and stimulating discussions on spectroscopy and the infrared, as well as the organizers for the invitation to this exciting conference. I also appreciate the help of Lee Armus and Jason Marshall who provided data and plots for this paper prior to publication.
References
- Alonso-Herrero et al. (2003) Alonso-Herrero, A. et al. 2003, AJ, 126, 81
- Armus et al. (1989) Armus, L., Heckman, T. M., & Miley, G. K. 1989, ApJ, 347, 727
- Armus et al. (2006) Armus, L. et al. 2006, ApJ, (submitted)
- Brandl et al. (2006) Brandl et al. 2006, ApJ, (submitted)
- Brandt & Hasinger (2005) Brandt, W. N., & Hasinger, G. 2005, ARA&A, 43, 827
- Buchanan et al. (2006) Buchanan, C. L., et al. 2006, AJ, 132, 401
- Condon (1992) Condon, J. J. 1992, ARA&A, 30, 575
- Dale et al. (2006) Dale, D. 2006, ApJ, (in press - astro-ph/0604007)
- de Grijp et al. (1987) de Grijp, M. H. K., Lub, J., & Miley, G. K. 1987, A&AS, 70, 95
- Elitzur & Shlosman (2006) Elitzur, M., & Shlosman, I. 2006, ApJ, (submitted - astro-ph/0605686)
- Ferrarese & Ford (2005) Ferrarese, L., & Ford, H. 2005, Space Science Reviews, 116, 523
- Genzel & Townes (1987) Genzel, R., & Townes, C. H. 1987, ARA&A, 25, 377
- Genzel et al. (1998) Genzel, R., et al. 1998, ApJ, 498, 579
- Ghez et al. (1998) Ghez, A. M., Klein, B. L., Morris, M., & Becklin, E. E. 1998, ApJ, 509, 678
- Heisler et al. (1997) Heisler, C. A., Lumsden, S. L., & Bailey, J. A. 1997, Nat, 385, 700
- Houck et al. (2004) Houck, J. R., et al., 2004, ApJS, 154, 18
- Imanishi (2006) Imanishi, M. 2006, AJ,131, 2406
- Kennicutt (1998) Kennicutt, R. C., Jr. 1998, ARA&A, 36, 189
- Kewley et al. (2001) Kewley, L. J., et al. 2001, ApJ, 556, 121
- Laurent et al. (2000) Laurent et al. 2000, A&A, 359, 887
- Lonsdale et al. (1993) Lonsdale, C. J., Smith, H. J., & Lonsdale, C. J. 1993, ApJ, 405, L9
- Lonsdale et al. (2003) Lonsdale, C. J., Lonsdale, C. J., Smith, H. E., & Diamond, P. J. 2003, ApJ, 592, 804
- Lutz et al. (1998) Lutz, D., et al. 1998, ApJ, 505, L103
- Marshall et al. (2006) Marshall, J. A., et al. 2006, ApJS, (submitted)
- Mushotzky (2004) Mushotzky, R. “How are AGN Found?” in in ”Supermassive Black Holes in the Distant Universe” (2004), ed. A. J. Barger, Kluwer Academic Publishers, [astro-ph/0505144]
- Narayan et al. (1998) Narayan, R., et al. 1998, ApJ, 492, 554
- Siebenmorgen & Kruegel (2006) Siebenmorgen, R., & Kruegel, E. 2006, A&A, (submitted - astro-ph/0606444)
- Sturm et al. (2000) Sturm, E., et al. 2000, A&A, 358, 481
- Teplitz et al. (2006) Teplitz, H.I., et al. 2006, ApJ, 638, 1
- Veilleux & Osterbrock (1987) Veilleux, S., & Osterbrock, D. E. 1987, ApJS, 63, 295
- Verma et al. (2005) Verma, A., Charmandaris, V., Klaas, U., Lutz, D., & Haas, M. 2005, Space Science Reviews, 119, 355
- Weedman et al. (2005) Weedman, D. W., et al. 2005, ApJ, 633, 706
- Werner et al. (2004) Werner, M., et al., 2004, ApJS, 154, 1