Stellar winds from massive stars - What are the REAL mass-loss rates?
Abstract
We discuss recent evidence that currently accepted mass-loss rates may need to be revised downwards, as a consequence of previously neglected “clumping” of the wind. New results on the radial stratification of the corresponding clumping factors are summarized. We investigate the influence of clumping on the ionization equilibrium of phosphorus, which is of major relevance when deriving constraints on the clumping factors from an analysis of the FUV Pv resonance lines.
1Universitäts-Sternwarte, Scheinerstr. 1, D-81679 München, Germany
2Institute of Astronomy, Bulgarian National Astronomical Observatory,
P.O. Box 136, 4700 Smoljan, Bulgaria
3INAF - Osservatorio Astrofisico di Catania, Via S. Sofia 78, I-95123
Catania, Italy
1. Introduction
While our understanding of the outflows from luminous OB-stars was thought to be well established, recent evidence indicates that currently accepted mass-loss rates may need to be revised downwards by as much as a factor of ten. This is a consequence of previously neglected “clumping” of the wind, which affects mostly those diagnostics which are sensitive to the square of the density, (such as recombination lines or free-free continua).
Considering that numerous stellar-evolution calculations have demonstrated that changing the mass-loss rates of massive stars by even a factor of two has a dramatic effect on their evolution (e.g., Meynet et al. 1994), it is evident that such revisions would have enormous implications, not only regarding evolution, but also regarding the feed-back from massive stars. In this article, we will summarize the knowledge which has been accumulated lately and consider the question concerning the REAL mass-loss rates from massive star winds.
2. Standard mass loss diagnostics of luminous OB-stars
Traditionally, the mass-loss rates, , of luminous OB stars have been
inferred from, primarily, three types of measurement (see also de Koter,
this volume):
1. The strengths of UV P-Cygni profiles were the first
diagnostics to be used to measure wind-densities. This approach has been
pioneered by Lamers & Morton (1976) in their work on the “Mass ejection from the O4f
Star Zeta Puppis”, where they derived a mass-loss rate of , a number which is still valid! The most commonly used method to
analyze P-Cygni lines is the so-called SEI-method (Lamers et al. 1987),
which has been firstly applied by Groenewegen & Lamers (1989). Though most of the UV
P-Cygni lines are resonance lines from dominant ions being linearly
dependent on density and thus remaining uncontaminated from direct
clumping effects (but see Sect. 7.), only the product can be
inferred from these lines, where is the ionization fraction of the
corresponding ion. Moreover, most of these lines are inevitably saturated in
stars with strong winds, since they arise from abundant elements, and
only lower limits on can be provided in these cases.
2. Thermal radio and FIR continuum emission samples the
outermost and intermediate region of the wind ((100,
10 )), respectively. The corresponding methods base on the work by
Wright & Barlow (1975)/Panagia & Felli (1975) (radio) and Lamers & Waters (1984a, b) (IR-excess). They have been applied, e.g., by Abbott et al. (1981) and
Lamers & Leitherer (1993) to derive OB-star radio mass-loss rates, and by Lamers et al. (1984)
to investigate the IR excess of Pup by means of IRAS observations.
Since the involved processes are dominated by free-free and bound-free
transitions which scale with , inferences from the
measurements are extremely sensitive to clumping in the wind.
3. Hα emission, usually modelled using NLTE atmosphere codes,
also depends on , and is therefore also sensitive to clumping, but
samples the innermost portion of the wind (). The idea to
exploit Hα as a standard mass-loss indicator goes back to Klein & Castor (1978),
and has been firstly applied by Leitherer (1988), Drew (1990) and
Lamers & Leitherer (1993). Further refinements have been provided by Puls et al. (1996).
3. Clumping – some basic facts
The present hypothesis states that clumping is a matter of small-scale density inhomogeneities in the wind111in contrast to large-scale inhomogeneities such as co-rotating interaction zones (e.g., Cranmer & Owocki 1996 and references therein)., which redistribute the matter into clumps of enhanced density embedded in a rarefied, almost void medium. The amount of clumping is conveniently quantified by the so-called clumping factor, , which is a measure of the over-density inside the clumps (compared to a smooth flow of identical average mass-loss rate).222An alternative description bases on the volume-filling factor, . As already pointed out, diagnostics that are linearly dependent on the density are insensitive to clumping, whilst those sensitive to will tend to overestimate the mass-loss rate of a clumped wind, by a factor . For further details, see, e.g., Abbott et al. (1981), Lamers & Waters (1984b), Schmutz (1995) and Puls et al. (2006).
Until to date, the most plausible physical process responsible for small-scale structure formation in massive star winds is the so-called line-driven instability, found already in the first time-dependent hydrodynamical simulations of such winds (Owocki et al. 1988); for recent investigations, see Runacres & Owocki (2002, 2005) with respect to 1-D simulations and Dessart & Owocki (2003, 2005) for first attempts to include 2-D processes.
Though predicted from the earliest hydro-models on (and even before, see
Lucy & Solomon 1970), it took some while to incorporate clumping into the atmospheric models of massive stars, firstly for Wolf-Rayet (WR)
atmospheres, in order to explain
(a) the strength of the observed electron
scattering wings (-dependent) in parallel with the strength of the
underlying (-dep.) emission lines (Hillier 1991),
(b) the so-called momentum problem of WR winds (e.g., Schmutz 1995),
(c) the presence and variability of sub-structures in WR emission lines,
by invoking supersonic turbulence leading to clumping factors of the order
of (Moffat & Robert 1994).
4. No clumping in OB-star winds?
In contrast to the case of WR winds, the diagnostics of OB-star winds did not
render any necessity for (significant) clumping until recently. In
particular, two major arguments supported the view of a rather smooth,
almost unclumped flow:
1. The investigations by Lamers & Leitherer (1993) and Puls et al. (1996) showed that
Hα and radio mass-loss rates are similar for a large sample of stars
(but see also Drew (1990) who noted a discrepancy by a factor of two, the
former being larger). Since Hα forms in the lower and the radio emission
in the outer wind, this would imply a similar degree of clumping in both
regions, which seemed to be improbable and is also in contradiction
to theoretical predictions.
2. The observed wind-momentum rates were found to be in rather good
agreement with theoretical predictions for this quantity, obtained from
different, independent investigations (Vink et al. 2000, Kudritzki 2002, Puls et al. 2003, Krticka & Kubat 2004). A pure coincindence of this agreement seemed to be rather
unlikely.
Taken together, it was concluded that clumping effects in OB-star winds should be negligible.
5. Indications of (significant) clumping in OB-star winds
As stated in the introduction, recent evidence points to the notion that this conclusion might be incorrect. In the following, we will summarize the different indications for significant clumping in OB-star winds accumulated so far. From the observational side, there is, to our knowledge, only one direct evidence for clumping. From a temporal analysis of Heii 4686, Eversberg et al. (1998, in particular their Fig. 2) found ”outward moving inhomogeneities” in the wind of Pup, from regions near the photosphere out to 2 .
All other evidence is indirect, and the derived clumping factors cover a large
range.
(a) From polarimetry and using simplified models, clumping factors of the
order of =2 are found (Davies, this volume).
(b) The analysis of radio and submm data from Ori and Pup
(Blomme et al. 2002, 2003) indicates a clear submm
excess in both cases, which can be explained by (enhanced) clumping in the
intermediate wind () (see also Blomme, this volume).
(c) NLTE model atmosphere analyses of UV spectra (partly incl. the optical range) of various O-stars indicate clumping factors of the order of , but show that only few lines are suited to discriminate between clumped and unclumped flows. From these analyses (cf. Table 1), it was concluded that clumping, if present, should begin rather close to the wind base, at a few tens of . This finding is in contrast to hydrodynamical simulations, which show that the line-driven instability needs a certain time to grow and to become non-linear, so that significant clumping is expected not before 1.2 to 1.3 .
| authors | objects | indicator | comments | |
| Crowther et al. | AV232(O7Iaf+) | Pv | 10 | other lines barely affected |
| (2002) | SMC | by clumping | ||
| Hillier et al. | AV83(O7Iaf+) | Pv/strong | 10 | if clumping is important, |
| (2003) | SMC | UV photo- | it must begin at relatively | |
| sph. lines | low velocities (30 km/s!) | |||
| Bouret et al. | SMC dwarfs | Ov | signi- | |
| (2003) | ficant | |||
| Bouret et al. | HD 190429A (O4If) | Pv, Ov, Niv | 25 | reduction of by factors |
| (2005) | HD 96715 (O4V((f)) | 50 | of 5 and 7 | |
| clumping must start | ||||
| at the wind base |
(d) From detailed investigations of the wind-momentum rates of a large
sample of O-stars, Puls et al. (2003), Markova et al. (2004) and Repolust et al. (2004) found
that supergiants with Hα in emission lie above the theoretical
wind-momentum luminosity relation (WLR), whereas the rest fits almost
perfectly. Since the WLR should be independent of luminosity class (e.g.,
Puls et al. 1996), this discrepancy was interpreted in terms of
clumpy winds, with , and mass-loss rates reduced by factors
between 2 and 3.
(e) A compelling, independent indication of clumping comes from
SEI analyses of the P-Cygni P v
resonance line doublet (Massa et al. 2003, Fullerton et al. 2006, see also Massa, this volume), which has only become widely accessible since the launch of
FUSE. Because phosphorus has a low cosmic abundance, this doublet
never saturates in normal OB stars, providing useful estimates of not only
(cf. Sect. 2.) but also itself, when P4+
is the dominant ion – as it is implied at least for mid-O star winds.
These mass-loss rates turned out to lie considerably below those inferred
from other diagnostics such as Hα or radio emission. The most reasonable
way to reconcile these results is to invoke extreme clumping in the wind
(Pv as a resonance line remains insensitive to direct clumping
effects), indicating clumping factors of the order of (or
even more). Accordingly, the actual mass-loss rates should be much lower
than previously thought, by a factor of . Further comments are given
in Sect. 7.
(f) Using similar methods, Prinja et al. (2005) showed that the unsaturated P Cygni lines in lower luminosity B supergiants give, again, a factor of 10 lower mass-loss rates than theoretically expected. Crowther et al. (2006, see also Crowter, this volume), on the other side, found reasonable agreement between observed and predicted mass-loss rates for early/mid BIa supergiants, with similar (though unconstrained) clumping factors in the lower and intermediate wind.
6. A combined Ha/IR/mm/radio analysis
Whereas most of the above investigations are concerned with a global (i.e., radially almost constant) clumping factor or derive this quantity for certain wind regions only, there is, of course, the additional question regarding the radial stratification of . To this end, Puls et al. (2006) recently performed a self-consistent analysis of Hα, IR, mm and radio fluxes, thus sampling the lower, intermediate and outer wind in parallel. This study comprises a sample of 19 Galactic O-type supergiants and giants with well known stellar parameters (from Markova et al. 2004, Repolust et al. 2004 and Mokiem et al. 2005), employing own measurements/archival data for Hα, IR/mm fluxes (SCUBA) and new VLA observations, including objects with Hα in absorption, i.e., low density winds.
A major result of this investigation is that in weaker winds the clumping factor is the same in the inner () and outermost regions. However, for stronger winds, the clumping factor in the inner wind is larger than in the outer one, by factors of 3 to 6. This finding points to a physical difference in the clumping properties of weaker and stronger winds (and may be related to the excitation mechanism of the structure formation). In terms of mass-loss rates then, we find (radio) (Hα) for weak winds with Hα in absorption, whereas for all stars with Hα in emission we obtain (radio) 0.4…0.5 (Hα), consistent with the arguments given by Markova et al./Repolust et al. and the earlier findings by Drew (1990).
Unfortunately, this analysis is hampered by one severe restriction. Since all diagnostics employed have a dependence, only relative clumping factors could be derived, normalized to the values in the outermost, radio-emitting region. In other words, (real) (radio), since until now the clumping in the radio emitting region is still unknown. Only if (radio) were unity, we would have (real) = (radio). Thus, the issue of absolute values for still remains unresolved.
7. The PV problem
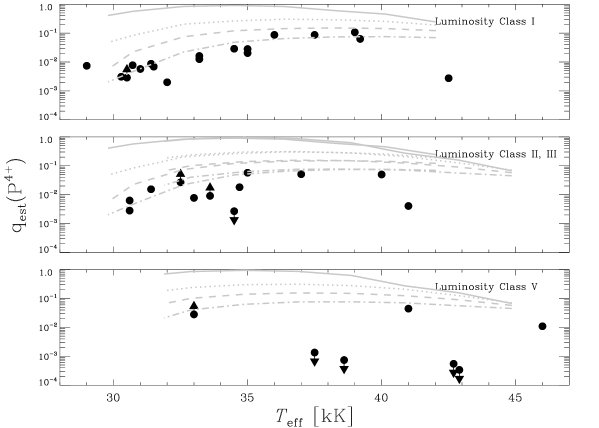
The major result of the investigation by Fullerton et al. (2006) (see Sect. 5.) is displayed in Fig. 1. In this figure, they have plotted, as a function of and luminosity class, the quantity
| (1) |
for P4+, where angle brackets denote spatial averages. The quantity in the nominator has been measured from the Pv lines, and the corresponding Hα/radio mass-loss rates have been taken from the literature. If the winds were unclumped, would correspond to the average ionization fraction of P4+, whereas for clumped winds this quantity is modified by . Fullerton et al. now argue that P4+ should be a dominant ion at mid O-type, and in this case the derived clumping factor would be at 40,000 K. Additionally, however, they report on test calculations performed with unclumped models which show that, on the contrary, P4+ should become a dominant ion only below O7. If this were true, Fig. 1 would imply in this temperature regime!
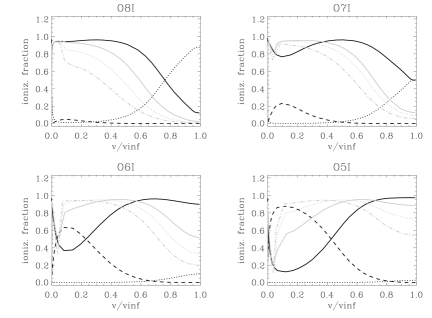
Since this is VERY unlikely, we have investigated the influence of clumping on the ionization fraction of P4+. Due to the enhanced density inside the clumps, stronger recombination is expected (this is the indirect effect of clumping), which should change the picture (see also Bouret et al. 2005). By means of our model atmosphere code FASTWIND (Puls et al. 2005) and using the phosphorus model atom provided by Pauldrach et al. (2001), we have calculated a sequence of clumped models with = const, i.e., models which have identical -diagnostics mass-loss rates. As shown in Fig. 2, increased clumping indeed shifts P4+ as a dominant ion towards higher : for unclumped models, it is dominant at O8/7, whereas for the largest clumping factors it dominates at O5.
Using these models then, the “observed” run of can be reproduced with highly clumped models (= 144, see Fig. 1), for almost all luminosity classes and except for the very hottest temperatures (see below). Thus, our calculations confirm the hypothesis stated by Fullerton et al., i.e., clumping is possible to explain the observations, and mass-loss rates might indeed be lower by factors of 10 or even more.
8. Implications
As we have seen, there seems to be a (physical) difference between thinner and thicker winds. For thinner winds, there is a similar degree of clumping in the lower and outer wind, whereas for thicker winds clumping is stronger in the lower part. The actual mass-loss rates depend on the clumping in outer wind, which is still an unsolved issue.
If the outer winds were unclumped, our results would be consistent with theoretical WLRs. In this case then, one would meet a severe dilemma with the results from the F(UV), which might hopefully be explained by additional effects from X-rays emitted due to clump-clump collisions (Feldmeier et al. 1997, Pauldrach et al. 2001). X-rays might also help to solve the problem encountered for Pv at highest .
If, on the other hand, the (F)UV values were correct, the outer wind must be significantly clumped, and the present match of ”observed” and predicted WLR would indeed by only coincidental. This scenario would imply a number of severe problems, not only for radiation driven wind theory, but, most importantly, concerning the stellar evolution in the upper HRD and related topics. A possible way out of the latter problem has been suggested by N. Smith (this volume).
Acknowledgments.
Part of this work has been supported by the NSF of the Bulgarian Ministry of Education and Science (No. 1407/2004).
References
- Abbott et al. (1981) Abbott, D. C., Bieging, J. H., Churchwell, E. 1981, ApJ, 250, 645
- Blomme et al. (2002) Blomme, R., Prinja, R. K., Runacres, M. C., et al. 2002, A&A, 382, 921
- Blomme et al. (2003) Blomme, R., Van den Steene, G. C., Prinja, R. K., et al. 2003, A&A, 408, 715
- Bouret et al. (2003) Bouret, J.-C., Lanz, T., Hillier, D. J., et al. 2003, ApJ, 595, 1182
- Bouret et al. (2005) Bouret, J.-C., Lanz, T., Hillier, D. J. 2005, A&A, 438, 301
- Cranmer & Owocki (1996) Cranmer, S. R., & Owocki, S. P. 1996, ApJ, 462, 4691
- Crowther et al. (2002) Crowther, P. A., Hillier, D. J., Evans, C. J., et al. 2002, ApJ, 579, 774
- Crowther et al. (2006) Crowther, P. A., Lennon, D. J., Walborn, N. R. 2006, A&A, 446, 279
- Dessart & Owocki (2003) Dessart, L., & Owocki, S. P. 2003, A&A, 406, L1
- Dessart & Owocki (2005) Dessart, L., & Owocki, S. P. 2005, A&A, 437, 657
- Drew (1990) Drew, J. E. 1990, ApJ, 357, 573
- Eversberg et al. (1998) Eversberg, T., Lepine, S., Moffat, A. F. J. 1998, ApJ, 494, 799
- Feldmeier et al. (1997) Feldmeier, A., Puls, J., Pauldrach, A. W. A. 1997, A&A, 322, 878
- Fullerton et al. (2006) Fullerton, A. W., Massa, D. L., Prinja, R. K. 2006, ApJ, 637, 1025
- Groenewegen & Lamers (1989) Groenewegen, M. A. T., & Lamers, H. J. G. L. M. 1989, A&AS, 79, 359
- Hillier (1991) Hillier, D. J. 1991, A&A, 247,455
- Hillier et al. (2003) Hillier, D. J., Lanz, T., Heap, S. R., et al. 2003, A&A, 588, 1039
- Krticka & Kubat (2004) Krticka, J., & Kubat, J. 2004, A&A, 417, 1003
- Kudritzki (2002) Kudritzki, R. P. 2002, ApJ, 577, 389
- Klein & Castor (1978) Klein, R. I., & Castor, J. I. 1978, ApJ, 220, 902
- Lamers & Morton (1976) Lamers, H. J. G. L. M., & Morton, D. C. 1976, ApJS, 32, 715
- Lamers & Waters (1984a) Lamers, H. J. G. L. M., & Waters, L. B. F. M. 1984, A&A, 136, 37
- Lamers & Waters (1984b) Lamers, H. J. G. L. M., & Waters, L. B. F. M. 1984, A&A, 138, 25
- Lamers & Leitherer (1993) Lamers, H. J. G. L. M., & Leitherer, C. 1993, ApJ, 412, 771
- Lamers et al. (1984) Lamers, H. J. G. L. M., Waters, L. B. F. M., Wesselius, P. R. 1984, A&A, 134, L17
- Lamers et al. (1987) Lamers, H. J. G. L. M., Cerruti-Sola, M., Perinotto, M. 1987, A&A, 314, 726
- Leitherer (1988) Leitherer, C. 1988, ApJ, 326, 356
- Lucy & Solomon (1970) Lucy, L. B., & Solomon, P. M. 1970, ApJ, 159, 879
- Markova et al. (2004) Markova, N., Puls, J., Repolust, T., et al. 2004, A&A, 413, 693
- Massa et al. (2003) Massa, D., Fullerton, A. W., Sonneborn, G., et al. 2003, A&A, 586, 996
- Meynet et al. (1994) Meynet, G., Maeder, A., Schaller, G., et al. 1994, A&AS, 103, 97
- Moffat & Robert (1994) Moffat, A. F. J., & Robert, C. 1994, ApJ, 421, 310
- Mokiem et al. (2005) Mokiem, M. R., de Koter, A., Puls, J., et al. 2005, A&A, 441, 711
- Owocki et al. (1988) Owocki, S. P., Castor, J. I., Rybicki, G. B. 1988, ApJ, 335, 914
- Panagia & Felli (1975) Panagia, N., & Felli, M. 1975, A&A, 39, 1
- Pauldrach et al. (2001) Pauldrach, A. W. A., Hoffmann, T. L., Lennon, M. 2001, A&A, 375, 161
- Prinja et al. (2005) Prinja, R. K., Massa, D., Searle, S. C. 2005, A&A, 430, L41
- Puls et al. (1996) Puls, J., Kudritzki, R. P., Herrero, A., et al. 1996, A&A, 305, 171
- Puls et al. (2003) Puls, J., Repolust, T., Hoffmann, T., et al. 2003, in: Proc. IAU Symp 212, eds. K. A. van der Hucht, A. Herrero & C. Esteban, ASP, p. 61
- Puls et al. (2005) Puls, J., Urbaneja, M.A., Venero, R., et al. 2005, A&A, 435, 669
- Puls et al. (2006) Puls, J., Markova, N., Scuderi, S., et al. 2006, A&A, in press
- Repolust et al. (2004) Repolust, T., Puls, J., Herrero, A. 2004, A&A, 415, 349
- Runacres & Owocki (2002) Runacres, M. C., & Owocki, S. P. 2002, A&A, 381, 1015
- Runacres & Owocki (2005) Runacres, M. C., & Owocki, S. P. 2005, A&A, 429, 323
- Schmutz (1995) Schmutz, W. 1995, in: Proc. IAU Symp. 163, eds. K. A. van der Hucht & P. M. Williams, p. 127
- Vink et al. (2000) Vink, J., de Koter, A., Lamers, H. J. G. L. M. 2000, A&A, 362, 295
- Wright & Barlow (1975) Wright, A. E., & Barlow, M. J. 1975, MNRAS, 170, 41