All-wavelength Extended Groth strip International Survey: the environment of X-ray sources at
Abstract
We explore the environment of AGN using a sample of 53 spectroscopically identified X-ray sources in the All-wavelength Extended Groth strip International Survey. We quantify the local density in the vicinity of an X-ray source by measuring the projected surface density of spectroscopically identified optical galaxies within a radius defined by the 3rd nearest neighbour. Our main result is that X-ray selected AGN at avoid underdense regions at the 99.89% confidence level. Moreover, although we find that the overall population shares the same (rich) environment with optical galaxies of the similar and , there is also tentative evidence (96%) that AGN with blue colors () reside in denser environments compared to optical galaxies. We argue that the results above are a consequence of the whereabouts of massive galaxies, capable of hosting supermassive black holes at their centers, with available cold gas reservoirs, the fuel for AGN activity. At an increasing fraction of such systems are found in dense regions.
Subject headings:
Surveys – galaxies: active – galaxies: high redshift – galaxies: structure1. Introduction
In recent years there has been increasing evidence that the formation of spheroids and the build-up of supermassive black holes at their centers are strongly interconnected (Ferrarese & Merritt 2000; Gebhardt et al. 2000; Alexander et al. 2005). Moreover, it is now well established that galaxy properties, such as morphology, color and star-formation, strongly depend on environment (e.g. Butcher & Oemler 1978; Lewis et al. 2002; Gomez et al. 2003; Hogg et al. 2004), suggesting a close link between local density and the evolution of individual systems. Putting the evidence above together, it is natural to assert that AGN activity, being strongly coupled to galaxy formation and evolution, should also depend on environment.
Despite significant observational progress however, the link between local density and AGN remains controversial. For example, at low redshift () Miller et al. (2003) found no dependence on environment of the fraction of spectroscopically identified AGN in the Sloan Digital Sky Survey (SDSS; Schneider et. al. 2005). More recent studies, also using SDSS data, suggest that it is only when the AGN population is split into subsamples based on optical classification and/or luminosity, that environmental differences become apparent. For example powerful AGN () and/or narrow-line Seyferts are found in increasingly less dense regions at , while less luminous AGN and/or LINERs show no dependence on local density (e.g. Kauffmann et al. 2004; Wake et al. 2005; Constantin & Vogeley 2006). The above low- results however, appear to be in conflict with observations suggesting that at least certain classes of powerful AGN, such as radio galaxies, reside in relatively rich environments (e.g. Zirbel 1997). Additionally, the large scale distribution of optically and X-ray selected AGN at is consistent with correlation lengths in the range (e.g. Croom et al. 2005; Basilakos et al. 2004; Gilli et al. 2005; Adelberger & Steidel 2005). This indicates that AGN have local density distribution similar to early-type systems at (; Coil et al. 2004b) and that they avoid poor environments at these redshifts (e.g. emission-line galaxies, ; Coil et al. 2004b). Contrary to these results, Coil et al. (2006) show that the clustering amplitude of broad-line QSOs at matches that of blue galaxies rather than early-type systems. This may indicate differences in the methods used to select AGN in these studies.
In this paper we directly quantify, for the first time, the environment of X-ray selected AGN at in an attempt to shed light on the AGN/density relation at high redshift and how it compares with low- results. The testbed for this analysis is the All-wavelength Extended Groth strip International Survey (AEGIS), a unique multiwavelength wide-area (0.5 deg2) sample, which combines observations from X-ray to radio with moderate resolution optical spectroscopy to (Davis et al. 2006). Throughout the paper we adopt , and .
2. The Data
The main source of redshift information for the AEGIS is the DEEP2, a spectroscopic survey which aims to explore the galaxy properties and the large-scale structure at (Davis et al. 2003). This on-going project uses the DEIMOS spectrograph on the 10 m Keck II telescope to obtain redshifts for galaxies to mag. The spectra are obtained with a moderately high resolution grating (), which provides a velocity accuracy of and a wavelength range . This spectral window allows the identification of the O II emission line to . In this study we use a total of 5864 galaxies with secure redshifts (90% confidence; quality ) in the range . In this interval the AEGIS has high spectroscopic sampling rate and is less affected by the survey edges.
At X-ray wavelengths the 0.5 deg2 region of the AEGIS is covered by 8 ACIS-I Chandra pointings. In the analysis presented in this paper we use data from 4 of the 8 Chandra fields that will eventually be available for the AEGIS. Details about the X-ray data used here are listed in Table 1. The remaining observations are still being analyzed or lie in regions where the DEEP2 spectroscopy is still incomplete and does not allow study of the local density using 3-dimensional information. The X-ray data reduction, source detection and flux estimation are carried out using methods fully described in Nandra et al. (2005). The detected sources are optically and spectroscopically identified using the DEEP2 photometric and redshift catalogues (Coil et al. 2004a; Faber et al. 2006) following the prescriptions presented by Georgakakis et al. (2006). The X-ray sample comprises a total of 814 sources of which 58 in the range .
| field | Observation | exposure | ||
|---|---|---|---|---|
| name | ID | (J2000) | time (ks) | |
| GWS | 3305, 4357, 4365 | 14:17:43.60 | +52:28:41.20 | 200 |
| EGS3 | 5845, 5846 | 14:21:32.70 | +53:13:27.70 | 98 |
| EGS4 | 5847, 5848 | 14:19:23.90 | +52:50:32.69 | 89 |
| EGS7 | 6222, 6223 | 14:15:22.50 | +52:08:26.40 | 84 |
Note. — Columns are: (1) the name of the Chandra pointing, (2) the sequence number of the observations used at a given pointing, (3) nominal right ascension of satellite pointing, (4) nominal declination, (5) total exposure time of observations used in this paper.
3. Overdensity estimator
We quantify the environment of galaxies following the prescription described by Cooper et al. (2005, 2006). For a given source the DEEP2 redshift information is used to estimate , the projected distance on the sky to the 3rd nearest neighbor within a radial velocity slice of from the central source. This is then converted to projected density using the relation . We attempt to account for edge effects by excluding from the analysis sources with projected distance Mpc from field edges. This reduces the sample size to 4189 optical galaxies and 53 X-ray sources. The estimates are then corrected for the DEEP2 variable spectroscopic incompleteness across the survey region by normalizing with the 2-dimensional completeness map, which accounts for the redshift identification success rate at different sky positions (Cooper et al. 2006). Additionally, DEEP2 is a magnitude limited spectroscopic survey and therefore, underestimates the true density at higher redshifts. We account for this effect by dividing the measured at a given with the median at that redshift (Cooper et al. 2005, 2006). This normalized quantity, , is a measure of the overdensity in the vicinity of a galaxy relative to the median field density at that redshift.
4. Results
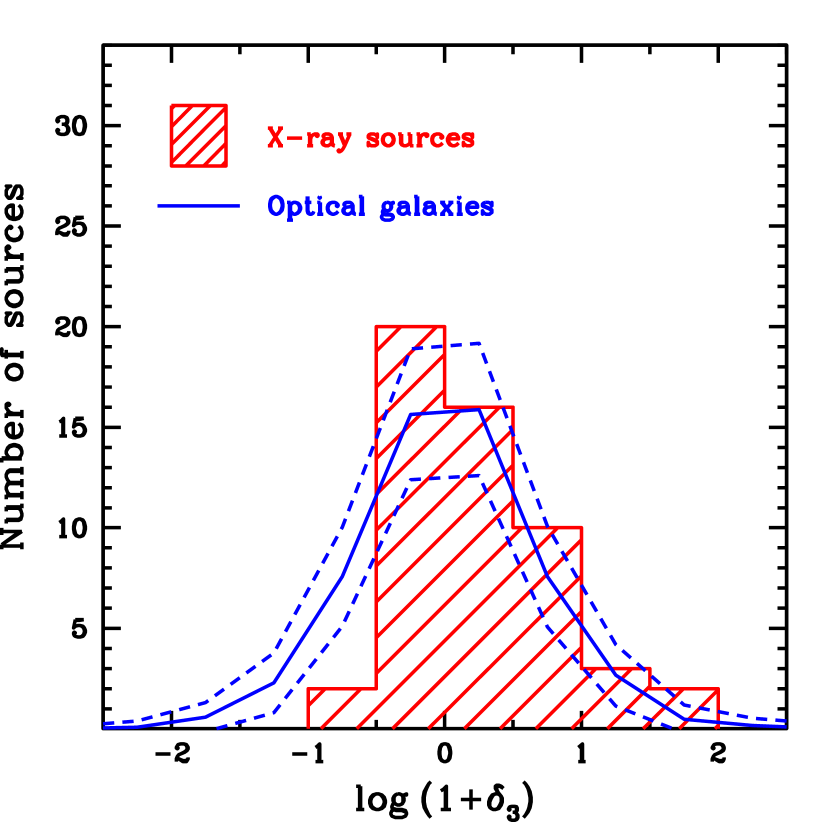
Fig. 1 presents the distribution of the overdensity estimator for the X-ray sample in comparison with the mean expectation for optically selected galaxies. For the comparison, a total of 200 control subsamples are constructed by randomly selecting galaxies from the DEEP2 spectroscopic survey. The mean distribution for the above 200 subsamples and the rms are also shown in Fig. 1. There is evidence in this plot that X-ray sources avoid underdense environments, . Indeed, the KS test rejects the null hypothesis probability, , that the two distributions (optical and X-ray) are drawn from the same population at the 99.89% confidence level. Optically luminous systems however, have on average different local environments compared to fainter galaxies (e.g. Cooper et al. 2006). Matching the absolute magnitude distribution of the random subsamples to that of the X-ray sources reduces to 99.4%. The rest-frame color of galaxies also strongly depends on environment. We therefore repeat the analysis by matching both the and distributions of optical galaxies and X-ray sources. This further reduces to 87%.
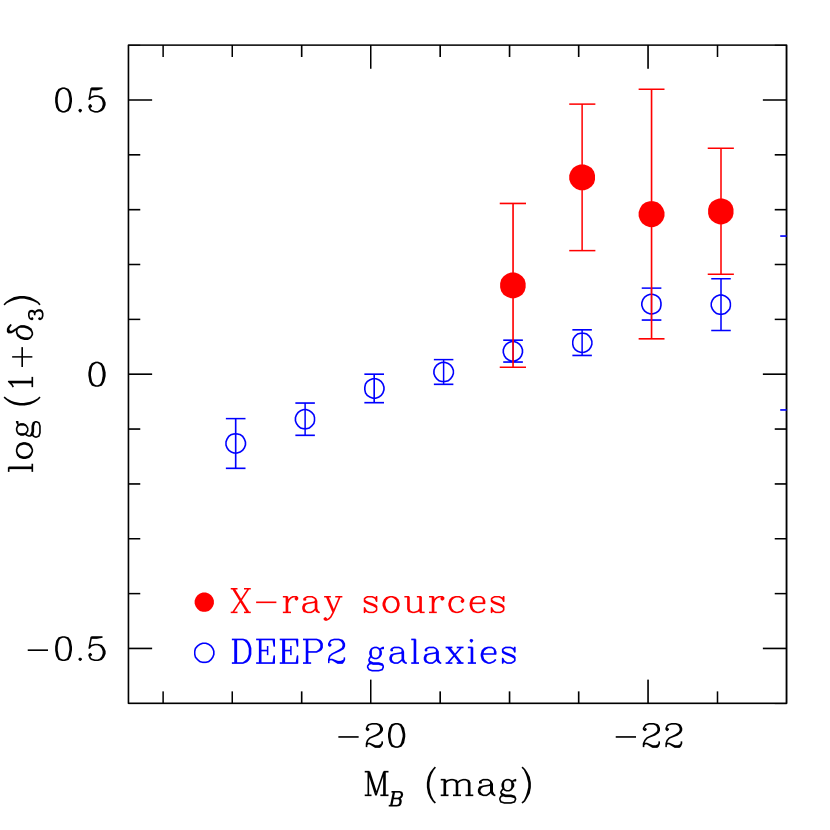
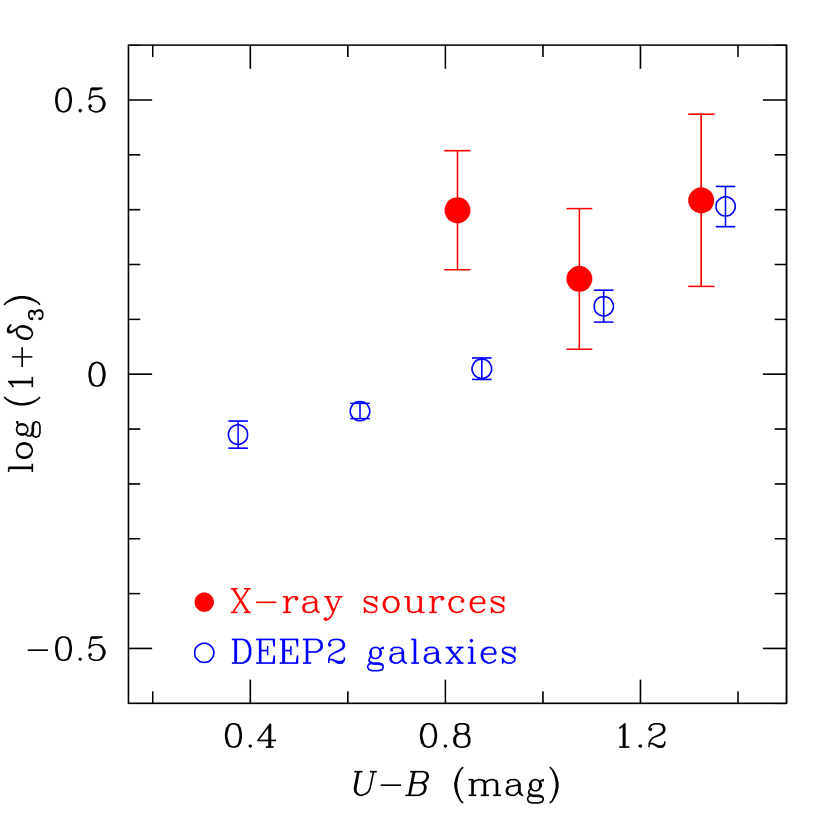
The trends above are further explored in Fig. 2, plotting the mean ) within different and bins for both DEEP2 galaxies and X-ray selected AGN. When estimating averages we account for the Malmquist bias by weighting each galaxy by , the inverse of the maximum volume available to a source within the survey limits (e.g. Cooper et al. 2006). Fig. 2 shows that firstly, X-ray selected AGN are found, on average, in overdense regions and secondly, they are associated with optically luminous ( mag) galaxies with , in agreement with previous studies (Dunlop et al. 2003; Colbert et al. 2005; Grogin et al. 2005; Nandra et al. 2006). Interestingly though, the two panels of Fig. 2 appear to give somewhat different results on the local density of X-ray sources relative to optical galaxies: for a given , X-ray sources reside in richer environments compared to optical galaxies at the 99% significance level, while this is not the case when grouped in color, with the exception of relatively blue AGN ().
5. Discussion
In this paper we explore the environment of X-ray selected AGN at using data from the AEGIS. The main result from our analysis is that the X-ray population at avoids underdense regions at the 99.89% significance level. To further understand the individual trends of environment with color and absolute magnitude we use the color-magnitude diagram (CMD) of X-ray sources presented by Nandra et al. (2006). From this perspective, the higher mean density of the X-ray sample relative to DEEP2 galaxies at a given is because the optical sample includes sources with very blue colors, known to reside in environments with below average local density (Fig. 2; Cooper et al. 2006).
Similarly, a given color bin samples optical galaxies with a range of absolute magnitudes, with the less luminous ones residing in underdense environments. The arguments above are consistent with our finding that the overdensity estimator distribution of X-ray sources and optical galaxies differ only at the 87% level when the two samples are matched in both the and . X-ray sources with relatively blue colors however, appear to be genuinely different from the DEEP2 population, albeit at the 96% level. These systems stand out in Fig. 2 and this difference persists at a similar significance, if we restrict the optical sample to mag, i.e. to galaxies with similar brightness to X-ray sources. These AGN occupy the upper bound of the blue cloud in the CMD presented by Nandra et al. (2006). Their blue colors may be due to contamination of the optical continuum by AGN emission. However, out of the 19 X-ray sources in that color bin only 3 have and therefore may be dominated by AGN emission at optical wavebands. Alternatively the above tentative trend with color may suggest that for these systems environment plays a role in the observed activity. A larger X-ray sample is required to further explore this.
The SDSS spectroscopic survey currently provides the only direct estimate of the environment of AGN, albeit at much lower redshift, , compared to this study. Kauffmann et al. (2004) using the 1st release of the SDSS found a strong dependence on environment for powerful AGN () at , in the sense that the most luminous systems are found in the field. Lower luminosity AGN in this study show no dependence on local density. The results above on the environment of low- AGN are clearly different from those reported here. Kauffmann et al. (2003) also explored the host galaxy properties of powerful AGN in the SDSS. They find that they are associated with massive () early type galaxies which are however, distinct from the bulk of the optically selected early-type population, in that they show evidence for on-going or recent star-formation activity. Based on the evidence above Kauffmann et al. (2003) suggest that there are two essential ingredients for strong AGN activity: a massive central black hole and abundant gas supply to fuel it. Only massive early-type galaxies have large enough bulges to host massive black holes. From these early-type galaxies those which show evidence for substantial amounts of young stellar populations have sufficient gas supply to both produce young stars and to feed the central engine. Such galaxies are relatively rare in the present day Universe and are preferentially found in low-density regions. Only in these environments can gas-rich star-forming galaxies survive today (e.g. Kauffman et al. 2004; Gomez et al. 2003; Lewis et al. 2002; Poggianti et al. 2006).
At higher redshifts however, there is an increasing fraction of massive galaxies with sufficient cold gas reservoirs that can potentially produce young stars and also fuel luminous AGN. For example, there is accumulating evidence that the number density of luminous blue galaxies, which are rare locally (e.g. Kauffman et al. 2004), substantially increases to (Bell et al. 2004; Cooper et al. 2006). These systems have blue colors, most likely because of star-formation, while their luminosities suggest high stellar masses. These galaxies are clearly prime candidates for powerful AGN hosts. Interestingly, these luminous blue galaxies, contrary to their low- counterparts, are shown to reside in regions of enhanced density (Cooper et al. 2006). As demonstrated in Fig. 2 our X-ray selected AGN sample is likely to include such systems. Moreover, the bluer X-ray sources in the sample appear to reside in higher density regions compared to optical galaxies on average.
The evidence above suggests that our finding for an association between X-ray selected AGN and higher density regions at is related to the whereabouts of massive galaxies with available cold gas reservoirs to sustain accretion of material on the central black hole. Observations show that such systems are also found in denser environments at , contrary to the local Universe.
A central question in AGN studies is the triggering mechanism of the observed activity. Recent results suggest that mergers are not the main process for activating a supermassive black hole (Grogin et al. 2005; Pierce et al. 2006). Is it possible then, that the environment plays a role in triggering the AGN activity suggesting a causal link between the two? The enhanced density of the bluer X-ray sources in our sample compared to optical galaxies, if confirmed with larger samples, supports such an association. For example it is plausible that the central black hole becomes active during the infall of the host galaxy to the overdense region, as it experiences the gravitational potential of the structure or frequent interactions with other galaxies in that region. In the framework of hierarchical models massive galaxies, which can potentially host luminous AGN, are more often found in denser regions. At , richer environments were substantially more active compared to the local Universe (Bundy et al. 2006), with the higher contrast occurring for intermediate-mass group-like systems with velocity dispersions (Poggianti et al. 2006), close to the upper mass limit that is well sampled by the DEEP2 (Gerke et al. 2005). According to Poggianti et al., this enhanced activity is associated with infalling systems many of which are likely to have sufficient mass to harbour a central black hole and cold-gas reservoirs to sustain star-formation activity and possibly also feed the black hole. As these massive galaxies further grow (e.g. by mergers) from high redshift to the present day, the supply of cold gas is cut-off (e.g. Croton et al. 2005; Cooper et al. 2006) leading to quenching of the star-formation and possibly the AGN activity. These massive systems will therefore, appear as red-and-dead at low-.
A possible link between AGN triggering and environment, if
confirmed, would suggest that the enhanced local density in the
vicinity of X-ray sources at is a consequence of the
hierarchical evolution of structures in the Universe and its impact on
the cold gas reservoirs of individual galaxies. The AEGIS survey
provides a unique dataset that can potentially test this scenario. Open
questions include: what fraction of the X-ray population is found in
optically selected groups (e.g. Gerke et al. 2005)? Are there
morphological and/or color gradients with distance from the centre
of the group, indicating
enhanced activity for infalling members? Are there differences
in the color, stellar mass and/or X-ray luminosity between AGN locked
in groups and those that are not? Addressing these points requires a
larger X-ray sample than that presented here. A full discussion of
these issues is therefore referred to a future publication using the
full AEGIS X-ray sample.
Financial support has been provided through PPARC and the Marie-Curie
Fellowship grant MEIF-CT-2005-025108 (AG) the Leverhulme trust
(KN), the Hubble Fellowship grants
HF-01165.01-A (JAN) and HF-01182.01-A (ALC), the NSF grants AST00-71198
and AST0071048. The W.M. Keck Observatory, a scientific partnership
among Caltech, the University of California and NASA. The Observatory
was made possible by the generous financial support of the W.M. Keck
Foundation. The authors wish to acknowledge the very significant
cultural role that the summit of Mauna Kea has within the indigenous
Hawaiian community; we are fortunate to be able to conduct
observations from this mountain.
References
- (1)
- (2) Adelberger K. L., Steidel C. C., 2005, ApJ, 627L, 1
- (3)
- (4) Alexander D. M., et al., 2005, Nature, 434, 738
- (5)
- (6) Basilakos S., Plionis M., Georgakakis A., Georgantopoulos I., 2005, MNRAS, 356, 183
- (7)
- (8) Bell E. F., et al., 2004, ApJ, 608, 752
- (9)
- (10) Bundy K., et al., 2006, AJ, submitted, astro-ph/0512465
- (11)
- (12) Butcher H., & Oemler A. Jr., 1978, ApJ, 226, 559
- (13)
- (14) Coil A. L., et al., 2006, ApJ, submitted
- (15)
- (16) Coil A. L., et al., 2004a, ApJ, 617, 765
- (17)
- (18) Coil A. L., et al., 2004b, ApJ, 609, 525
- (19)
- (20) Colbert J. W., Teplitz H. I., Yan L., Malkan M. A., McCarthy P. J., 2005, ApJ, 621, 587
- (21)
- (22) Constantin A., Vogeley M. S., 2006, ApJ, submitted, astro-ph/0601717
- (23)
- (24) Cooper M. C., Newman J. A., Madgwick D. S., Gerke B. F., Yan R., Davis M., 2005, ApJ, 634, 833
- (25)
- (26) Cooper M. C., et al., 2006, ApJ, submitted
- (27)
- (28) Croton D. J., et al., 2005, MNRAS, submitted: astro-ph/0508046
- (29)
- (30) Davis M. et al., 2003, in “Discoveries and Research Prospects for 6- to 10-m class telescopes II”. Edited by Guhathakurta, Puragra, Proceedings of the SPIE, 2003, vol 4834, p. 161
- (31)
- (32) Dunlop J. S., et al., 2003, MNRAS, 340, 1095
- (33)
- (34) Davis M., et al., 2006, ApJL, this volume
- (35)
- (36) Ferrarese L., Merritt D., 2000, ApJ, 539, L9
- (37)
- (38) Gebhardt K., et al., 2000, ApJ, 539, L13
- (39)
- (40) Georgakakis A., et al., 2006, MNRAS, submitted
- (41)
- (42) Gerke B. F., et al., 2005, ApJ, 625, 6
- (43)
- (44) Gilli R., et al., 2005, A&A, 430, 811
- (45)
- (46) Gómez P. L., et al., 2003, 584, 210
- (47)
- (48) Grogin N. A., et al., 2005, ApJ, 627, L97
- (49)
- (50) Hogg D. W., et al., 2004, ApJ, 601L, 29
- (51)
- (52) Kauffmann G., et al., 2004, MNRAS, 353, 713
- (53)
- (54) Kauffmann G., et al., 2003, MNRAS, 346, 1055
- (55)
- (56) Lewis I., et al., 2002, MNRAS, 334, 673
- (57)
- (58) Miller C. J., Nichol R. C., Gómez P. L., Hopkins A. M., Bernardi M., 2003, 597, 142
- (59)
- (60) Nandra K., et al., 2005, MNRAS, 356, 568
- (61)
- (62) Nandra K., et al., 2006, ApJL, this volume
- (63)
- (64) Pierce C., et al., 2006, ApJL, this volume
- (65)
- (66) Poggianti B. M., et al., 2006, ApJ, in press, astro-ph: 0512391
- (67)
- (68) Schneider D., et al., 2005, AJ, 130, 367
- (69)
- (70) Wake D. A., et al., 2004, ApJ, 610L, 85
- (71)
- (72) Zirbel E. L., 1997, ApJ, 476, 489