AEGIS20: a radio survey of the Extended Groth Strip
Abstract
We describe AEGIS20 – a radio survey of the Extended Groth Strip (EGS) conducted with the Very Large Array (VLA) at 1.4 GHz. The resulting catalog contains 1,123 emitters and is sensitive to ultraluminous (1012 L⊙) starbursts to , well matched to the redshift range of the DEEP2 spectroscopic survey in this region. We use stacking techniques to explore the Jy-level emission from a variety of galaxy populations selected via conventional criteria – Lyman-break galaxies (LBGs), distant red galaxies (DRGs), UV-selected galaxies and extremely red objects (EROs) – determining their properties as a function of color, magnitude and redshift and their extinction-free contributions to the history of star formation. We confirm the familiar pattern that the star-formation-rate (SFR) density, , rises by at least 5 from = 0 to 1, though we note highly discrepant UV- and radio-based SFR estimates. Our radio-based SFRs become more difficult to interpret at where correcting for contamination by radio-loud active galactic nuclei (AGN) comes at the price of rejecting luminous starbursts. Whilst stacking radio images is a useful technique, accurate radio-based SFRs for galaxies require precise redshifts and extraordinarily high-fidelity radio data to identify and remove accretion-related emission.
1 Introduction
The tight correlation between radio and far-IR emission for star-forming galaxies (Helou et al. 1985; Garrett 2002; Kovacs et al. 2006), allows us to push dust-independent surveys down to lower SFRs than is possible in the confusion-limited far-IR/submm wavebands. Moreover, the high mapping speed of facilities such as the Giant Metre-wave Radio Telescope means we can quickly obtain the large samples of faint sources needed for reliable analyses.
The bulk of the far-IR background seen by COBE (Fixsen et al. 1998) most likely arises from a large population of luminous and ultraluminous IR galaxies (LIRGs and ULIRGs), their energy originating from dust-obscured star formation and accretion. Individually less luminous than submm galaxies, with L⊙, these galaxies are believed to be sufficiently numerous to dominate at 1 (Dole et al. 2006).
In this letter we present a new panoramic radio survey – AEGIS20 – undertaken with the National Radio Astronomy Observatory’s999The National Radio Astronomy Observatory is operated by Associated Universities Inc., under a cooperative agreement with the National Science Foundation. VLA as part of the All-wavelength Extended Groth Strip International Survey (AEGIS; Davis et al. 2006). AEGIS20 was tuned to detect ULIRGs robustly at 1, with a noise level of 10 Jy beam-1 at 1.4 GHz (cf. Hopkins et al. 2003; Bondi et al. 2003). The resulting catalog, available electronically, contains 103 faint radio sources – an order of magnitude more than the 5-GHz survey of this region by Fomalont et al. (1991); nearly half are expected to have optical spectra provided by the DEEP2 survey, many with redshifts, as well as photometry across a wide range of wavelengths.
The future goal of AEGIS20 is to measure the 1.4-GHz luminosity function, track the evolution of SFRs in LIRGs and ULIRGs and, using a measure of the local galaxy density of each radio source, study the history of star formation as a function of environment. Here, we present the AEGIS20 catalog and utilise the radio image to estimate SFRs for a number of independent and overlapping galaxy populations selected via conventional criteria.
2 Observations and data reduction
Data were obtained at 1.4 GHz during 2003–05 with the VLA in its B configuration, acquiring seven 3.125-MHz channels every 5 s in each of four IFs. We obtained data in six positions, spaced by 15′ (see Davis et al. 2006), concentrating in the northern half of the EGS because of the proximity of 3C 295 ( = 23 Jy). Around 18 hr of data were acquired for each of the field positions, cycling through them between scans of 1400+621 and 1419+543 to monitor bandpass, amplitude and phase. Absolute flux calibration was set using 3C 286.
Calibrated visibilities and associated weights were used to generate mosaics of -pixel images to quilt the VLA’s primary beam in each EGS field position. clean boxes were placed tightly around all sources and a series of imagr and calib tasks were run, clipping the data after subtracting clean components generated by the third iteration of imagr. The central images from each of the pointings were then knitted together using flatn, ignoring data beyond the primary beam’s half-power point, to produce a large mosaic. The synthesized beam is circular, with a fwhm of 3.8′′.
3 Sample definition
To define a sample of radio sources we searched signal-to-noise (S/N) images using the sad detection algorithm, emulating the technique described by Biggs & Ivison (2006). Sources with 4 peaks were fitted with 2-D Gaussians using jmfit, those with 5 peaks surviving to be fitted in total intensity. Sources with sizes equal to or smaller than the restoring beam were considered unresolved; their size was constrained to that of the beam. We make no correction for bandwidth smearing in the catalog: this is a small effect (5%) given our mosaicing strategy and the use of B configuration. We detect 38, 79, 171, 496 and 1,123 sources with , 800, 320, 130 and 50 Jy (consistent with Simpson et al. 2006), where the 5 detection limits at 130 and 50 Jy cover 0.73 and 0.04 deg2. Confusion is not an issue: the source density on an arcmin2 scale is 0.01 beam-1.
corresponds to rest-frame 1.4-GHz luminosities, , of 0.44, 2.3, 6.0 and 12 W Hz-1 and SFRs of 50, 275, 725 and 1,430 M⊙ yr-1 at = 0.5, 1.0, 1.5 and 2.0 (for , km s-1 Mpc-1 — Spergel et al. 2003 — a Salpeter initial mass function [IMF] with d/d over 0.1–100 M⊙ and ).
AEGIS20 covers 57% of the existing DEEP2 region (Davis et al. 2006), with 7,900 unique redshifts available in the 0.28 deg2 common to both surveys. DEEP2 thus covers 35% of AEGIS20, although its imaging covers 90% of AEGIS20 (93% of cataloged sources). Of the AEGIS20 sources with optical imaging, 36% have counterparts within 1′′. Since the DEEP2 targeting rate is 70%, the inclusion rate on DEEP2 masks for faint radio emitters is 25%. At present, 100 of the targeted AEGIS20 radio sources have DEEP2 redshifts — a very high success rate. Radio properties of DEEP2 galaxies and the spectroscopic properties of the AEGIS20 catalog will be discussed in a forthcoming paper.
4 The radio properties of distant galaxy populations
The wealth of multi-frequency data in AEGIS allows us to mimic the selection of galaxy populations such as DRGs (; expected to lie at — Franx et al. 2003), as well as LBGs (Steidel et al. 2003) and EROs. We investigate the radio properties of several such populations in this section, taking them roughly in order of increasing redshift.
We expect to detect only a small fraction of distant galaxies at radio frequencies. In such situations it is common to assess the emission from a galaxy population using a stacking analysis, accomplished either by extracting and co-adding postage stamps centered on the galaxies of interest (‘image stacking’) or by co-adding flux densities measured at the positions of the galaxies (‘pixel stacking’). We adopt both approaches here. To determine the signal lost by pixel stacking we employed radio emitters with S/N = 5–20 pixel-1, finding a difference of only 3.9% between the values returned at the positions of the emitters and cataloged AEGIS20 flux densities. Monte-Carlo simulations show that the mean determined by pixel stacking are slightly skewed (0.1 Jy, typically) but are otherwise well described by Gaussian statistics; medians are affected at the 0.01-Jy level. values have been corrected for bandwidth smearing (+5.0%), for pixel-stacking losses (+3.9%) and we have excluded galaxies in noisy regions ().
We must excise emission due to accretion if we are to determine accurate radio-based SFRs. Morphological classification of most radio emitters is not feasible at the resolution of our data, spectral indices are not to hand and the availability and reliability of AGN indicators at shorter wavelengths differs widely across the EGS. Radio-loud AGN were thus identified and rejected via a limit. Following Condon (1992), we adopt for normal galaxies, an order of magnitude below the break in morphology and luminosity noted by Fanaroff & Riley (1974). We quote the noise-weighted mean ; where AGN contamination is extreme (5%), we quote the median, noting the number of obvious AGN. One unfortunate consequence of excising radio-loud AGN on the basis of is the exclusion of distant hyperluminous starbursts lying on the far-IR/radio correlation (§5).
We begin with a ultraviolet (UV)-selected catalog containing 4,426 galaxies detected at 230 nm by GALEX, with DEEP2 redshifts, i.e. , excluding objects with AGN flags (Salim et al. 2006). Of these, 3,908 lie within the 0.28 deg2 of common areal coverage with AEGIS20. We compare SFRs determined in two ways – via their UV and radio properties, SFRUV and SFRrad – for the same galaxies. We use UV-based, extinction-corrected SFRs, derived by comparing observed spectral energy distributions (SEDs) with those of model galaxies exhibiting a wide range of properties and SF histories (Salim et al. 2005). Appropriate volume corrections for the GALEX-selected sample are difficult to determine due to a complex selection function dependent on UV/optical magnitudes and spectral characteristics. We therefore correct for the rate with which GALEX detects DEEP2 galaxies, which is known to fall from 90–75–60% at = 0.2–1.0–1.4, but not for our steadily decreasing sensitivity to low-luminosity galaxies (Arnouts et al. 2005). Because of this, we are limited to discussing the ratio of and within the sample.
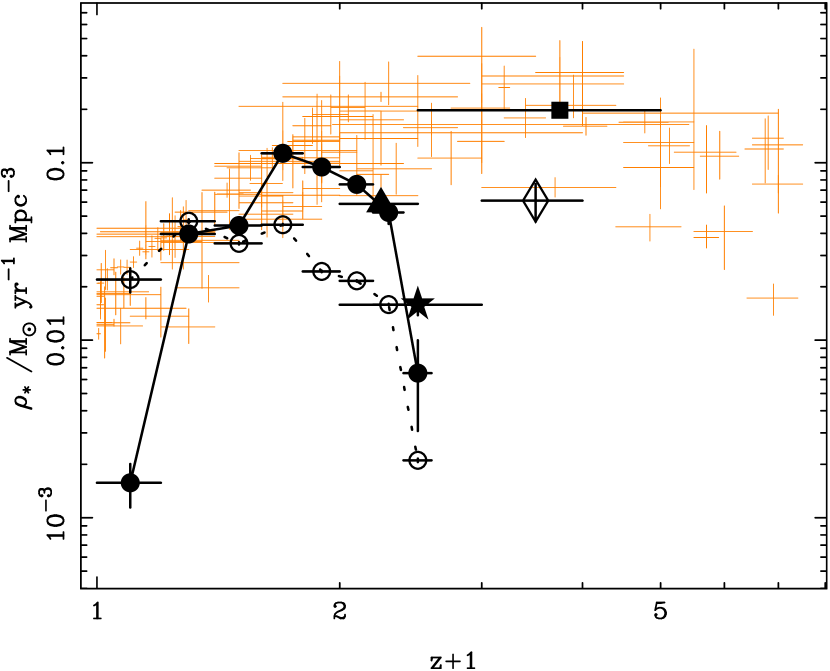
Robust radio detections of the UV sample were possible by pixel stacking over bins. Only 11 radio-loud AGN were identified via , 1% of the total; having rejected these, noise-weighted means provide the most appropriate measure of SFR for this sample (Table 1). SFRUV and SFRrad per UV-selected galaxy both increase with redshift, unsurprisingly since we are probing more UV-luminous galaxies at larger distances. For = 0–1, remains fairly constant whilst rises rapidly. It may seem puzzling that at is an order of magnitude higher than (Fig. 1) — should be sensitive to all recent star formation, obscured and unobscured, for a constant IMF — however, Bell (2003) showed that varies by 30 between 0.01 and 3 L⋆ and that radio data underestimate SFRs in low-luminosity galaxies typical of those detected locally by GALEX. Hopkins & Beacom (2006) argue that for the full picture we should add SFRUV and SFRrad. and achieve parity at , after which continues to rise until (cf. Cowie et al. 2004) when incompleteness seriously impacts the sample. Although it is tempting to speculate that the rise in results from the increasing dominance of dust-obscured IR-luminous galaxies, we must recall our sample’s origins. We are witnessing an increasing SFR per UV-selected galaxy, partly because at we are probing the most UV-luminous galaxies; we are also witnessing an increase in despite the increasing incompleteness. Adding SFRUV and SFRrad, due to UV-selected galaxies increases as at least (1+)2.2 between = 0 and 1 (cf. Schiminovich et al. 2005).
The mismatch between the absolute and relative rates of SF derived using UV- and radio-based indicators is worrying, particularly the difference between local estimates of . The local matches the compilation presented by Hopkins & Beacom (2006), which implies the UV-selected sample accounts for most of the SF in the local Universe, yet the UV sample at 0.0 0.2 accounts for 1% of the total cataloged in the region of common areal coverage. If the fraction of due to obscured SF at 0.0 0.2 exceeds 1%, would then be at the upper envelope of commonly accepted values.
Moving to slightly higher redshifts, we take two catalogs of EROs. One uses the conventional color cut with and DEEP2 redshifts, 1.0 1.5 (Conselice et al., in prep). It contains 382 objects in low-noise areas of our radio image. The second (Wilson et al. 2006) uses 4 to select essentially the same class of objects, but the larger area covered at 3.6 m (and no requirement for redshifts) yields 2,363 objects in 0.26 deg2 of AEGIS20. We assumed to excise radio-loud AGN from this sample.
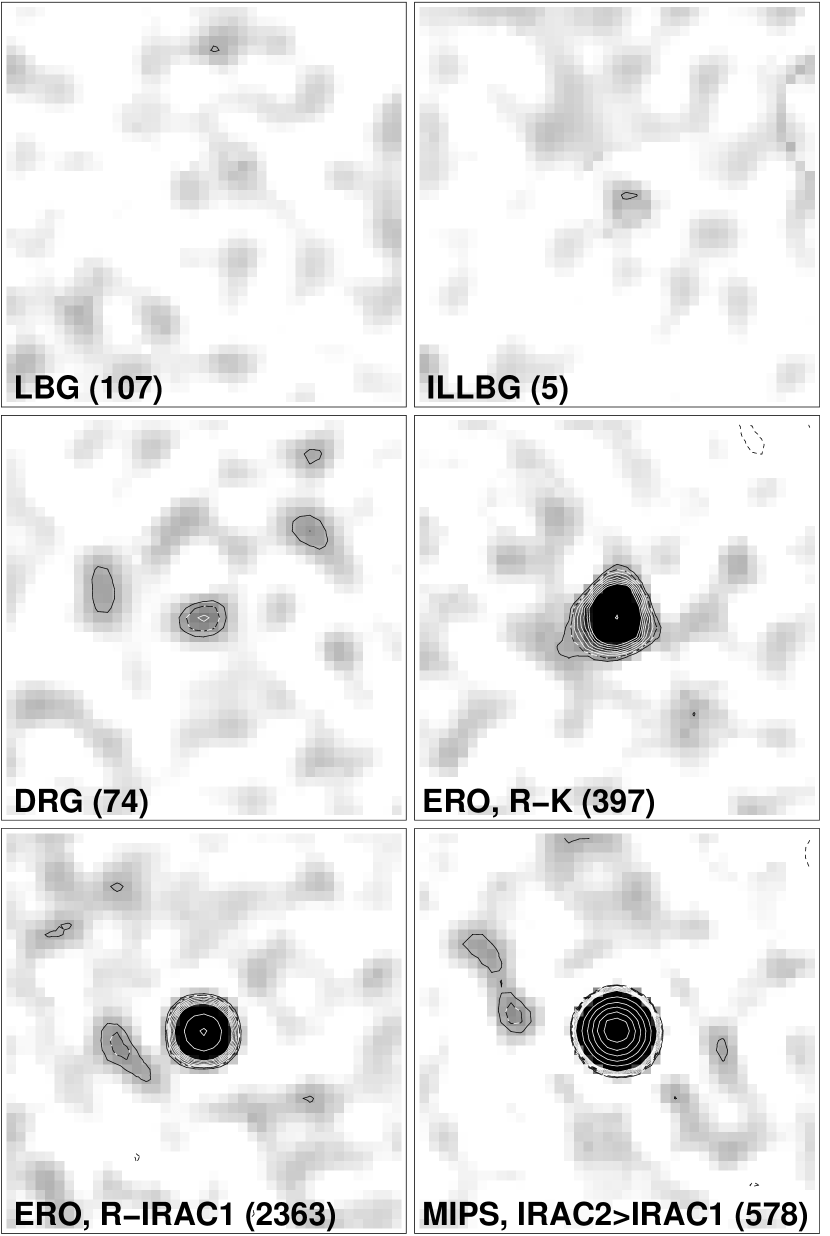
Both ERO samples are well detected at 1.4 GHz, as shown in Fig. 2. In the spectroscopic sample, mean does not vary significantly as a function of color, though it is a function of consistent with the findings of Smail et al. (2002). Median is W Hz-1 and the median SFR per ERO is 92 7 M⊙ yr-1. In the sample volume set by the redshift limits and survey area this equates to = 0.07 M⊙ yr-1 Mpc-3 (cf. Georgakakis et al. 2006; Simpson et al., in prep).
The larger ERO sample reveals a weak trend for to increase with redness; this is confirmed by the increasing detection rate for individual objects (Table 1). Mean also declines as decreases. We expect to trace stellar mass and distance, and the factor of 5.5 decrease in for a for a factor of 15 decrease in suggests an increasing SFR per unit stellar mass as redshift increases. The overall for this sample is consistent with that of the spectroscopic sample, as expected given the limited number of spectroscopic redshifts and the significant sample overlap.
Huang et al. (in prep) present a catalog selected at Jy, with , aiming to select galaxies and AGN at 1.5. Almost 103 objects lie in low-noise regions of our radio mosaic, overlapping AEGIS20 by 0.26 deg2. The individual radio detection rate is a strong function of , rising from 30 to 70% between 0.15 and 1.2 mJy. Median (Table 1) is fairly insensitive to , varying by 2 over 3 mag. Over 40% of the 24-m-selected galaxies have W Hz-1 when assuming . At this redshift all S/N 3 measurements imply radio-loud AGN and it is difficult to estimate the SFR: is likely to be high, but so is the level of accretion-related contamination. The median , 28 Jy, translates into = 0.20 M⊙ yr-1 Mpc-3 for = 1.5–4. We would be unsurprised if this is in error by 2; regardless, this is an important star-forming population.
Moving on to yet more distant populations, this time to a sample of DRGs selected at (Vega) with (Conselice et al. 2006), 108 of which lie within the 0.11 deg2 of common coverage with AEGIS20. Although expected to lie at 1.9 3.5 (Franx et al. 2003), Conselice et al. find that 64% lie at 1 2. Galaxies with , evident via DEEP2, have been removed from the sample used here. One of the radio emitting DRGs has consistent with radio-loud AGN (or, as noted earlier, a hyperluminous starburst). The mean for the DRGs was Jy – faint emission can be seen in the stacked S/N image (Fig. 2). At this corresponds to W Hz-1 and a mean SFR (per DRG) of M⊙ yr-1. Knudsen et al. (2005) found M⊙ yr-1 using submm data for a sample of 30 DRGs (adapting to the cosmology and IMF used here), having assumed significantly larger distances. The observed radio emission from DRGs equates to = 0.02 M⊙ yr-1 Mpc-3 at = 1–2.
The LBGs of Steidel et al. (2003) lie in a noisy region of the radio mosaic. Of the 334 cataloged LBGs, after correction for the astrometric offset in that catalog (), 107 lie within low-noise regions of the radio mosaic; their mean was Jy (median, 0.6 Jy), consistent with an average SFR of 500 M⊙ yr-1 (3 , for ). Restricting the catalog to the 53 LBGs detected at 8 m with IRAC did not change the situation significantly (cf. Rigopoulou et al. 2006).
Finally, Huang et al. (2005) describe a population of IR-luminous LBGs (ILLBGs) detected at Jy. Only six of Huang et al.’s 13 objects lie within our radio mosaic. Their median is 44.2 Jy, including the one significant detection: Westphal MD99 at 1 mJy. This provides tentative support for the assertion that ILLBGs share the high SFRs of submm galaxies, though this is a very small sample in a particularly noisy region of the radio mosaic and accretion-related contamination is possible. If, as Huang et al. suggest, ILLBGs lie at 2 3 (like submm galaxies – Chapman et al. 2005) then their is similar to that of the 24m-selected galaxies with which they will overlap significantly (Fig. 1).
5 On radio data as a probe of global SF history
Fig. 1 shows for the galaxy populations explored in §4. The upper envelope of points traces the minimum as a function of redshift and appears to rise by at least 5 from = 0 to 1, a now-familiar pattern (Lilly et al. 1996), though this work has led us to question the reliability of many SFR and estimates.
Radio-based SFR estimates become increasingly prone to contamination by radio-loud AGN at . Unfortunately, a consequence of removing this via a limit on is the rejection of luminous star-forming galaxies obeying the far-IR/radio correlation; adopting a median is unlikely to be better. In addition, some redshift-limited galaxy populations defined by color appear less well defined than first claimed (Conselice et al. 2006), limiting our ability to judge the volume probed. These effects lead to large uncertainties so while it is clear that stacking radio data is useful, accurate SFRs for distant galaxies require precise redshifts together with deep, multi-frequency, high-resolution radio data (1′′, Jy). These will facilitate identification and removal of accretion-related emission via radio luminosity, spectral index, brightness temperature and morphology.
References
- Arnouts et al. (2005) Arnouts, S., et al. 2005, ApJ, 619, L43
- Bell (2003) Bell, E.F. 2003, ApJ, 586, 794
- Biggs & Ivison (2006) Biggs, A.D., & Ivison, R.J. 2006, MNRAS, 371, 963
- Bondi et al. (2003) Bondi, M., et al. 2003, A&A, 403, 857
- Chapman et al. (2005) Chapman, S.C., Blain, A.W., Smail, I., & Ivison, R.J. 2005, ApJ, 622, 772
- Condon (1992) Condon, J.J. 1992, ARA&A, 315, 575
- Conselice et al. (2006) Conselice, S.C., et al. 2006, ApJ, in press (this issue)
- Cowie et al. (2004) Cowie, L.L., Barger, A.J., Fomalont, E.B., & Capak, P. 2004, ApJ, 603, L69
- Davis et al. (2006) Davis, M., et al. 2006, ApJ, in press (this issue)
- Dole et al. (2006) Dole, H., et al. 2006, A&A, 451, 417
- Fanaroff & Riley (1974) Fanaroff, B.L., & Riley, J.M. 1974, MNRAS, 167, 31
- Fixsen et al. (1998) Fixsen, D.J., Dwek, E., Mather, J.C., Bennett, C.L., & Shafer, R.A. 1998, ApJ, 508, 123
- Fomalont et al. (1991) Fomalont, E.B., Windhorst, R.A., Kristian, J.A., & Kellerman, K.I. 1991, AJ, 102, 1258
- Franx et al. (2003) Franx, M., et al. 2003, ApJ, 587, L79
- Garrett (2002) Garrett, M.A. 2002, A&A, 384, L19
- Georgakakis et al. (2006) Georgakakis, A., Hopkins, A.M., Afonso, J., Sullivan, M., Mobasher, B., & Cram, L.E. 2006, MNRAS, 367, 331
- Helou et al. (1985) Helou, G., Soifer, B.T., & Rowan-Robinson, M. 1985, ApJ, 298, L7
- Hopkins et al. (2003) Hopkins, A.M., Afonso, J., Chan, B., Cram, L.E., Georgakakis, A., & Mobasher, B. 2003, AJ, 125, 465
- Hopkins & Beacom (2006) Hopkins, A.M., & Beacom, J.F. 2006, ApJ, in press (astro-ph/0601463)
- Huang et al. (2005) Huang, J.-S., et al. 2005, ApJ, 634, 137
- Knudsen et al. (2005) Knudsen, K.K., et al. 2005, ApJ, 632, L9
- Kovács et al. (2006) Kovács, A., Chapman, S.C., Dowell, C.D., Blain, A.W., Ivison, R.J., Smail, I., & Phillips, T.G. 2006, ApJ, in press (astro-ph/0604591)
- Lilly et al. (1996) Lilly, S.J., Le Fevre, O., Hammer, F., & Crampton, D., 1996, ApJ, 460, L1
- Rigopoulou et al. (2006) Rigopoulou, D., et al. 2006, ApJ, 648, 81
- Salim et al. (2005) Salim, S., et al. 2005, ApJ, 619, L39
- Salim et al. (2006) Salim, S., et al. 2006, ApJ, in press (this issue)
- Schiminovich et al. (2005) Schiminovich, D., et al. 2005, ApJ, 619, L47
- Simpson et al. (2006) Simpson, C., Rawlings, S., Martínez Sansigre, A., Ivison, R.J., Sekiguchi, K., & Takata, T. 2006, MNRAS, in press (astro-ph/0609529)
- Smail et al. (2002) Smail, I., Owen, F.N., Morrison, G.E., Keel, W.C., Ivison, R.J., & Ledlow, M.J. 2002, ApJ, 581, 844
- Spergel et al. (2003) Spergel, D.N., et al. 2003, ApJS, 148, 175
- Steidel et al. (2003) Steidel, C.C., Adelberger, K.L., Shapley, A.E., Pettini, M., Dickinson, M., & Giavalisco, M. 2003, ApJ, 592, 728
- Wilson et al. (2006) Wilson G., et al. 2006, ApJ, in press (this issue)
| SampleaaUnits are magnitudes unless otherwise stated (§4) | Selection criteria | NbbNumber of sources, number detected individually (S/N 5) and number classified as radio-loud AGN | SFRccRadio-based SFR per object; for the –3.6 EROs, we assume ; for the 24-m-selected galaxies, we assume | |
|---|---|---|---|---|
| UV-selected | =0.0–0.2 | 136-0-0 | 4.11.1 | 0.12 |
| galaxies, | =0.2–0.4 | 678-9-0 | 11.20.5 | 3.6 |
| 24.1 | =0.4–0.6 | 612-12-1 | 8.40.5 | 8.9 |
| =0.6–0.8 | 1,055-20-2 | 8.80.4 | 21 | |
| =0.8–1.0 | 667-7-0 | 8.50.5 | 36 | |
| =1.0–1.2 | 441-7-5 | 6.80.6 | 47 | |
| =1.2–1.4 | 276-3-2 | 5.70.8 | 59 | |
| =1.4–1.6 | 30-1-1 | 4.52.4 | 65 | |
| EROs, | –=5.3–5.6 | 216-14-7 | 13.60.8 | 126 |
| 20.5 | –5.6 | 170-15-8 | 11.90.9 | 111 |
| –5.3 | =17–18 | 35-7-4 | 20.62.2 | 194 |
| =18–19 | 187-19-10 | 16.90.9 | 159 | |
| =19–20 | 140-3-1 | 6.31.0 | 59 | |
| =20–21 | 19-0-0 | 12.92.8 | 121 | |
| EROs, | –3.6=4.0–4.5 | 1,027-53-17 | 11.80.4 | 81 |
| –3.64 | –3.6=4.5–5.0 | 720-29-4 | 10.60.4 | 73 |
| –3.6=5.0–5.5 | 437-29-8 | 14.40.6 | 100 | |
| –3.6=5.5–6.0 | 137-11-2 | 16.71.0 | 115 | |
| –3.66.0 | 42-8-1 | 27.71.8 | 192 | |
| 3.6m=19–20 | 411-62-15 | 25.10.6 | 174 | |
| 3.6m=20–21 | 1032-48-9 | 13.10.4 | 90 | |
| 3.6m=21–22 | 742-10-1 | 6.40.4 | 44 | |
| 3.6m22 | 154-3-2 | 4.60.9 | 32 | |
| 24m | =0.15–0.3 mJy | 634-65-291 | 23.5 | 1,400 |
| galaxies, | =0.3–0.6 mJy | 196-61-89 | 41.6 | 2,480 |
| =0.6–1.2 mJy | 67-34-21 | 67.2 | 4,010 | |
| 1.2 mJy | 29-19-2 | 103 | 6,120 | |
| 23 | 173-46-86 | 38.0 | 2,260 | |
| =23–24 | 154-39-67 | 32.7 | 1,950 | |
| =24–25 | 222-43-87 | 27.5 | 1,640 | |
| =25–26 | 151-26-69 | 29.0 | 1,730 | |
| 26 | 92-7-41 | 21.7 | 1,290 | |
| DRGs, | 20.5 | 80-2-1 | 10.11.3 | 150 |
| –2.3 | ||||
| LBGs | 107-0-28 | 2.02.3 | 500 | |
| ILLBGs | 0.06 mJy | 6-1-4 | 44.211.5 | 2,120 |