Structural Parameters for Globular Clusters in NGC 5128. II: HST/ACS Imaging and New Clusters111 Based on observations made with the NASA/ESA Hubble Space Telescope, obtained at the Space Telescope Science Institute, which is operated by the Association of Universities for Research in Astronomy, Inc., under NASA contract NAS 5-26555. These observations are associated with program #10260. Support for program 10260 was provided in part by NASA through a grant from the Space Telescope Science Institute, which is operated by the Association of Universities for Research in Astronomy, Inc., under NASA contract NAS 5-26555.
Abstract
We report the first results from an imaging program with the ACS camera on HST designed to measure the structural characteristics of a wide range of globular clusters in NGC 5128, the nearest giant elliptical galaxy. From 12 ACS/WFC fields, we have measured a total of 62 previously known globular clusters and have discovered 69 new high-probability cluster candidates not found in any previous work. We present magnitudes and color indices for all of these, along with rough measurements of their effective diameters and ellipticities. The luminosity distribution of this nearly-uncontaminated sample of clusters matches well with the normal GCLF for giant elliptical galaxies, and the cluster scale size and ellipticity distributions are similar to those in the Milky Way system. The indication from this survey is that many hundreds of individual clusters remain to be found with carefully designed search techniques in the future. A very rough estimate of the total cluster population from our data suggests in NGC 5128, over all magnitudes and within a projected radius from the galaxy center.
1 Introduction
Interest in the structural “fundamental plane” (FP) for globular clusters (Djorgovski, 1995; McLaughlin, 2000; McLaughlin & van der Marel, 2005) has grown rapidly over the past few years. We can now explore the structure of such objects in great detail, and in several types of host galaxies, over a range of almost 4 orders of magnitude in cluster mass. Furthermore, there is growing evidence that the uppermost end of the globular cluster (GC) mass range ( and even beyond) is inhabited by a wider variety of objects than was previously realized. The FP region above is populated with objects easily categorized as classic globular clusters, but also by structures such as the compact nuclei of dwarf elliptical galaxies, “extended luminous” clusters (Huxor et al., 2005), and the new class of Ultra-Compact Dwarfs (e.g. Phillipps et al., 2001; Haşegan et al., 2005; Jones et al., 2006), themselves perhaps a mixed collection of objects. Some of these other types of objects are proving hard to distinguish from normal GCs at large distances, because their effective radii and ratios are only slightly larger. It is also this mass range at which the downward extrapolation of the E-galaxy scaling relation intersects the GC locus (Drinkwater et al., 2003; Haşegan et al., 2005).
The nearest galaxy containing large numbers of these most massive globular (or globular-like) clusters is NGC 5128, the giant elliptical at the center of the Centaurus group at a distance of just 4 Mpc. With the help of high-resolution imaging, we have the opportunity to define the FP of a globular cluster system accurately and homogeneously over its entire mass range and within a single galaxy, as well as to study GCs within a giant elliptical individually and in unequalled detail. Defining as large as possible a sample of individual GCs is also a prerequisite to many other kinds of investigations, including the kinematics and dynamics of the cluster system, its metallicity distribution, and cluster ages, all of which are needed to build up a complete understanding of its evolutionary history (e.g. Harris et al., 1992; Peng, Ford, & Freeman, 2004b; Harris et al., 2004b; Woodley, Harris, & Harris, 2005).
HST-based imaging of GCs in NGC 5128 was carried out by Harris et al. (1998) for a single outer-halo cluster, and by Holland, Côté, & Hesser (1999) for a selection of inner-halo clusters; these studies were both done with the WFPC2 camera. Subsequent work by Rejkuba (2001) and Gómez et al. (2006) has shown that ground-based imaging at seeing conditions can be used to identify GCs with high probability and even to measure key structural parameters (half-light diameters and central concentrations). Identifying cluster candidates in NGC 5128 this way is, in fact, far more efficient than other techniques such as color indices and radial velocity surveys because of the high degree of field contamination at the Galactic latitude of this galaxy (see Harris et al., 2004a, for more extensive discussion).
The superior resolution of the cameras on board HST is, however, the only available way to measure these clusters at high enough resolution to establish their core radii and even central surface brightnesses with some confidence. In Harris et al. (2002), hereafter referred to as Paper I, we used data from the WFPC2 and STIS cameras to study 27 individual clusters in NGC 5128. Velocity dispersions and mass estimates have been obtained for 14 of the very most luminous of these by Martini & Ho (2004). In this paper, we present new imaging data for a much larger sample of 131 GCs, 69 of which are newly discovered.
2 Imaging Observations
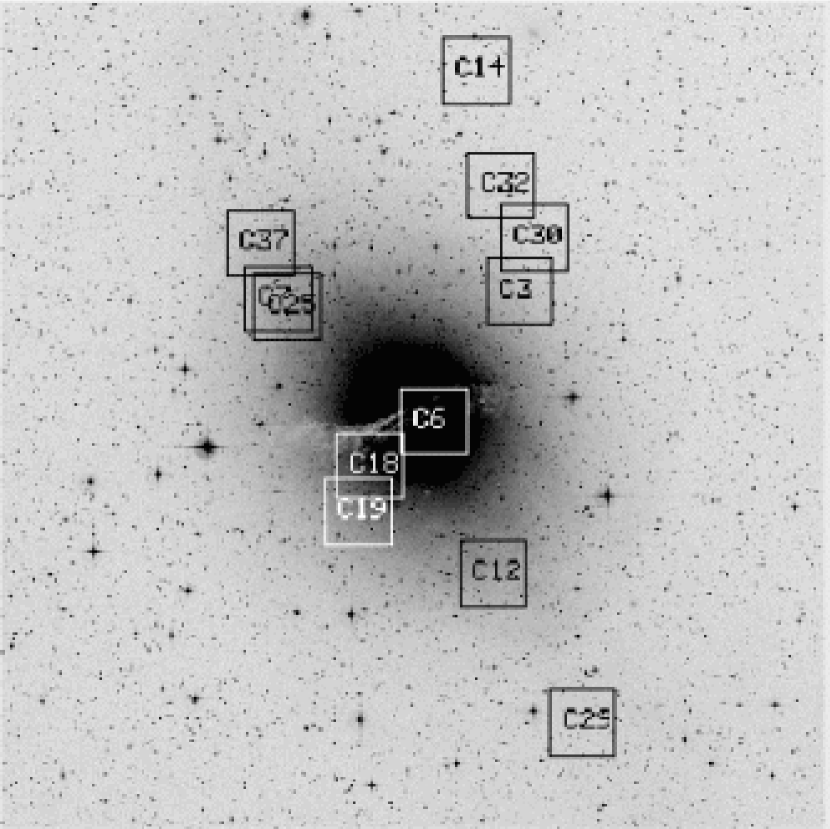
Our HST program 10260 was targetted at imaging many of the most massive known GCs in both M31 and NGC 5128. The M31 material will be presented in a later paper (Barmby et al., in preparation). In NGC 5128, 12 fields were imaged, centered on the clusters C3, C6, C7, C12, C14, C18, C19, C25, C29, C30, C32, and C37 (Harris et al., 1992). We used the ACS camera in its Wide Field Channel (field size and scale per pixel), and with a total exposure time on each field of one full orbit of 2500 sec divided into three equal sub-exposures, in the F606W (“Wide ”) filter. In Figure 1 we show the locations of these 12 target fields around NGC 5128. Our intentions in employing these moderately long exposures with the wide field were, first, to allow us to trace the cluster envelopes to significantly larger radii than we could do in Paper I; and second, to add to our sample by identifying new GCs in the fields. Because the brightest red-giant stars in the halo of NGC 5128 (and in its clusters) are resolved on these images, our chances of identifying clusters versus contaminating objects such as background galaxies with roughly similar sizes are much improved over even the best ground-based imaging.
3 Identification of Clusters and Cluster Candidates
For all the data analysis we used the combined, multidrizzled images taken from the HST Archive. These images are corrected in scale and flux normalizations for the ACS geometric distortion. Three separate passes of visual inspection combined with IRAF/imexamine were made on each frame, to search for clearly nonstellar objects that were also noticeably resolved into stars themselves and to obtain their profile widths and approximate shapes. Objects with FWHMs smaller than px (i.e. slightly larger than the stellar profile width of px), and that were not resolved into stars, were rejected. We also rejected objects clearly redder than the color range enclosing normal GCs (see below); these red objects were not resolved into stars, and most had structural features and asymmetries marking them as probable background galaxies. Finally, the complete list of previously known GCs from the literature was checked to make sure that our final list included all 62 that turned out to fall within our field boundaries. Our measurement procedure had already independently rediscovered all but half a dozen of these, indicating that our detection completeness rate for finding real clusters was above 90%. The handful that were missed have very compact structures with FWHM values barely larger than the stellar point spread function; in principle, automated and more quantitative profile measurements for all the objects on the frames might have recovered these, but at the risk of increasing the contamination of the sample by foreground stars.
Over all 12 fields, we found a total of 62 previously known GCs, along with 69 new objects that are not in any previous list and that we regard as highly probable GCs. This set of objects greatly increases the HST-based imaging sample of clusters for which accurate structural parameters can be obtained, and provides a strong basis for defining the GC fundamental plane in NGC 5128. In Paper III (McLaughlin et al., in preparation), we will discuss those results in full. Here we present an overview of the sample.
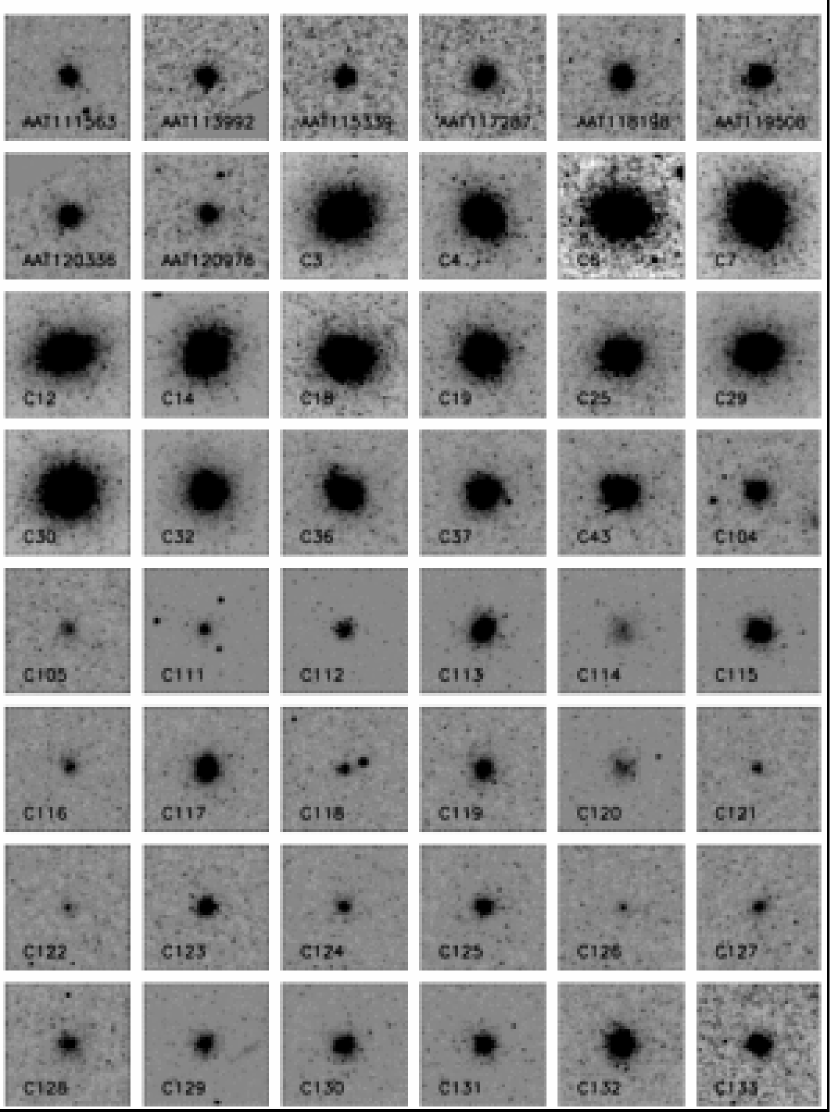
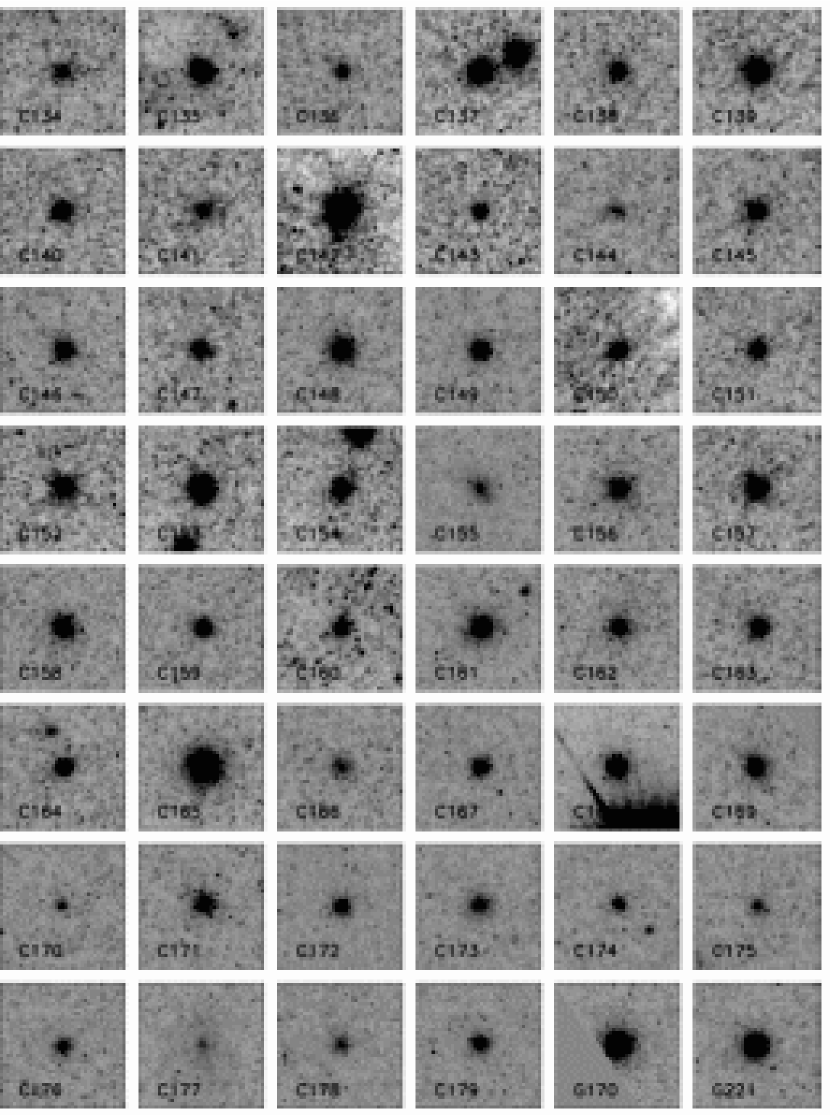
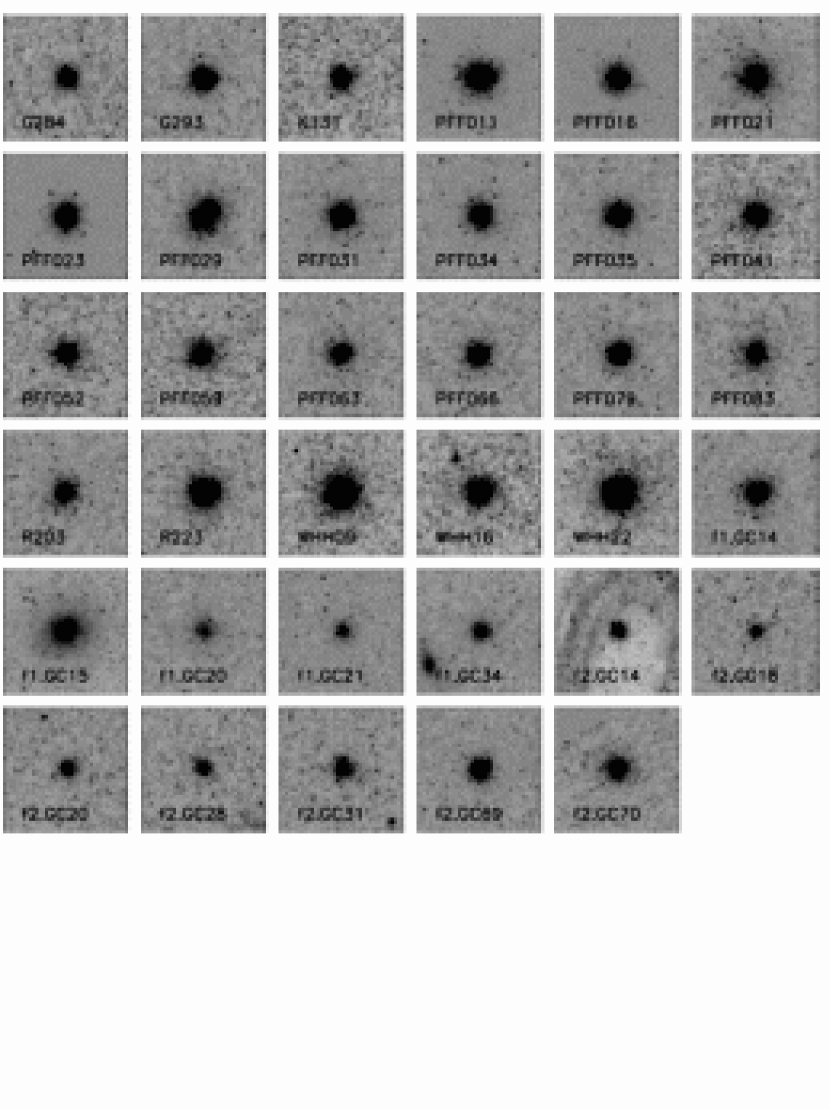
Images for all the individual clusters in our ACS frames are shown in Figures 2a,b,c. These clearly show the wide range of luminosities they have, as well as a noticeable range in ellipticity and effective radius. The single cluster whose integrated colors might be affected adversely by differential reddening from the central dust lane in NGC 5128 is C150 (see again Fig.2b; all the others are in clear regions of the halo (or, in the case of field C6, the bulge). Any candidates that were very heavily affected by differential reddening would, in fact, have been pushed beyond our adopted color limits and rejected from the sample. For a more extensive discussion on the reddening effects within the bulge region, see Harris et al. (1992).
In Table 1 we list the previously known GCs falling within our fields. The successive columns of the Table include the object coordinates (J2000); position relative to the center of NGC 5128 (where radius is in arcminutes and azimuthal angle is measured East of North); photometric indices in the Washington system, taken from the lists of Harris et al. (1992) and Harris et al. (2004b) (hereafter referred to as HHG04); and the ellipticity and Moffat-profile FWHM (in pixels) as obtained from imexamine. Conveniently, at the 3.9-Mpc distance of NGC 5128, one pixel of corresponds to a linear scale of very close to 1 parsec. For the cluster identification numbers, the ‘C’ and ‘G’ clusters are from Harris et al. (1992); PFF numbers from Peng, Ford, & Freeman (2004b); WHH numbers from Woodley, Harris, & Harris (2005); f1 and f2 numbers from Rejkuba (2001); AAT numbers from Beasley et al. (2006); and K numbers from Kraft et al. (2001).
In Table 2, we give the same information for the 69 newly discovered cluster candidates. These are labelled continuing with the C-numbers from Harris et al. (1992) and Paper I, starting at C111. The last two columns list the ACS field on which each one appeared, and any notes of peculiarities.
During the process of inspecting the previously cataloged clusters on our images, we found two that were clearly foreground stars, not clusters (they have stellar FWHMs, are unresolved, and show faint diffraction spikes): these were PFF010 and AAT114993. Interestingly, these two have measured radial velocities of 344 and 352 km s-1, just in the velocity range where NGC 5128 clusters can overlap with high-velocity Milky Way halo stars (Peng, Ford, & Freeman, 2004b; Woodley, Harris, & Harris, 2005). Their magnitudes and colors fall within the normal range of the NGC 5128 GCs ( for PFF010; for AAT114993).
A few of our ACS target fields overlapped each other, such that 16 of our GCs fell on more than one frame. These allowed useful consistency checks of the measured profile widths and ellipticities. We found that both and the FWHM agreed internally between frames extremely well, with rms scatter of just in and px in FWHM.
Some of the new clusters (Table 2) do not appear in the HHG04 database, in most cases because they lie relatively close to the galaxy center in the bulge region not covered in their work. These are the ones without or color indices in Table 2. To estimate approximate magnitudes for them, we used the aperture magnitudes from imexamine and correlated them with the values for clusters in common with HHG04. This mean shift was then applied to to get a rough value for ; however, these should not be considered as accurate to better than mag.
The astrometric zeropoints for our listed coordinates are not those in the raw ACS image headers, which can be wrong by an arcsecond or more. We applied small offsets to the world coordinate systems of these images so that the positions of stars in the fields matched those in the 2MASS point source catalog. These revised coordinates were further checked against the database of Harris et al. (2004a), which gives coordinates of all objects in a one-degree field centered on NGC 5128 and tied to the USNO UCAC1 system with a claimed accuracy of (see Harris et al., 2004a, for extensive discussion). Our object coordinates listed in Table 1 and 2 agree with that system to within a median , quite consistent with the expected accuracy.
As a final note on the coordinates, we found through these comparisons that the values for the clusters in our Paper I – which were determined from the STIS image headers – were systematically wrong by more than an arcsecond, with most of the error coming in declination. The coordinates in Paper I need to be corrected by seconds of time and seconds of arc. We have calculated these shifts by rematching the 27 separate clusters in Paper I with their coordinates in the HHG04 database. These () values are confirmed by the five clusters in the present ACS imaging study that overlap with the ones in Paper 1. For completeness, in Table 3 we provide the revised coordinates and the Washington photometric indices for the clusters we observed in Paper I.
4 Discussion of Results
In Figure 3, we show the distributions in magnitude () and colors ( and for all 149 of the objects that we have imaged under high resolution with the HST cameras (Tables 1 to 3). The classically bimodal color distribution of GCs, already well known in NGC 5128 (e.g. Harris et al., 1992; Rejkuba, 2001; Woodley, Harris, & Harris, 2005) as in other giant galaxies, shows up in the graph particularly (see Woodley et al. 2005 for histograms with the same color indices and a larger database). It is apparent from Fig. 3 that this method of identifying clusters, first by image morphology and second by color, does not discriminate against the fainter clusters as much as radial velocity studies have done. In other words, this sample is more uniformly distributed in magnitude than those identified with velocities (to date, the radial velocity data for the NGC 5128 clusters are all from 4m-class telescopes, and these samples have effective faint-end limits near ; see Peng et al. 2004a and Woodley et al. 2005). In particular, the newly discovered cluster candidates are mostly fainter than , with many of them fainter than the classic GCLF turnover point. This work suggests that there are likely to be many hundreds of globular clusters remaining to be found in NGC 5128, and that high-resolution imaging is an effective tool for isolating candidates. A very small number of objects are noticeably bluer than the normal old-halo clusters, possibly indicating younger ages for these.
In Figure 4, we show the distribution of FWHM values from Tables 1 and 2. Many of our clusters and candidates have effective diameters in the range of pc or less and would be quite hard to resolve under ground-based seeing conditions. The fact that the histogram keeps rising almost up to the PSF diameter of px (dashed line) indicates that we may still be missing some clusters with extremely small effective diameters. Such objects will be quite hard to find except perhaps through radial velocity surveys where all objects in a given region are targetted regardless of morphology. Although the FWHM values should be taken only as a rough estimate of the effective diameters, the distribution already resembles that for the Milky Way globular clusters shown in the lower panel of the Figure, where the majority of the globular clusters have half-light diameters in the range pc. It is worth noting as well that the histogram of cluster diameters has a long, extended tail to larger radii, and that we have found a significant number of such objects in our ACS survey; these could easily be picked out from ground-based imaging in sub-arcsecond seeing conditions and should be more carefully looked for in a more extended survey, particularly in the outer halo.
In Figure 5, the FWHM estimates are plotted against galactocentric radius. In general, the clusters with smaller diameters tend to be found preferentially closer to the galactic center, although the trend is not strong and many rather extended clusters are visible at all radii. Similarly, there is a weak trend for the FWHM to be larger for the bluer (more metal-poor) clusters. Our data follow the same general trends of GC size versus galactocentric radius and color as in the comprehensive analysis of the Virgo galaxies by Jordan et al. (2005) (see also Larsen et al. 2001 for an earlier study of GCs in elliptical galaxies that found similar observational trends). In our Paper III, we will present more rigorous effective radii for our cluster sample based on full model fitting, where it will be possible to study these correlations better than in our current (preliminary) dataset.
The great majority of the clusters in our ACS sample have low ellipticities, roughly in the range of familiar globular clusters. In Paper I we suggested from our much smaller sample of clusters imaged with STIS and WFPC2 that NGC 5128 had proportionally more high clusters than does the Milky Way. The larger sample we have from our present study is shown in Figure 6, including 120 clusters brighter than . For comparison, 100 Milky Way clusters with known ellipticities (Harris, 1996) are shown as well. These two samples are now very similar in both size and distribution by ellipticity, and a two-sample test shows no statistically significant difference between them. Though this comparison must be viewed with some caution because the values were measured in different ways for the two samples (see Paper I for additional discussion), we conclude that the GCs appear quite similar in shape in these two galaxies. The few objects in Tables 1 and 2 that have are all cases where the cluster is moderately faint and noticeably crowded by neighboring, relatively bright stars. Rejecting these few, we find a mean for the clusters in our total sample. The dropoff of the NGC 5128 histogram for may not be significant, since the average value for imexamine measurements of stars on our images is . In Paper III, we will present the results of more rigorously derived structural parameters, effective radii, and model profile fits.
A point of obvious interest in our new dataset is the globular cluster luminosity function (GCLF). As noted above, the ACS images reach deep enough that clusters of almost all luminosities are about equally easy to find by the combination of resolution into stars and profile measurement, with the exception of very faint or extended ones in crowded starfields. For this reason, it should be possible to construct a relatively clean GCLF that is not strongly biased by luminosity. Rejkuba (2001) used a similar approach with her ground-based imaging data, but our HST/ACS list is larger and more nearly contamination-free. HHG04 made an attempt to construct a GCLF for the entire halo of the galaxy on a statistical basis from their wide-field survey data, but their results were severely compromised by the heavy field contamination. By contrast, the only obvious bias that should exist in our sample is that the original frames were deliberately targetted at individual bright clusters. Other than these single bright clusters, the objects found on the remainder of the ACS images constitute a nearly unbiased sample from several different places in the halo, and should give us a reasonable estimate of the GCLF over nearly its full range.
In Figure 7, we show the results of this exercise. If we combine all the objects in Tables 1, 2, and 3, and then eliminate the 25 bright clusters that were the deliberately chosen centers of each ACS and STIS image, we are left with 124 objects defining a nearly unbiased, nearly uncontaminated sample of GCs. These are plotted in half-magnitude bins in as the solid dots in the Figure. Putting back the 25 bright target-center clusters gives the open circles in the Figure, clearly showing the bright-end bias that they generate. For comparison, we show a “standard” GCLF curve for giant elliptical galaxies superimposed on the data. This is a Gaussian curve with standard deviation mag, and a peak at corresponding to a turnover luminosity (Harris, 2001), shown by the horizontal line in Fig. 3. The match of the standard curve to the data indicates that a small amount of incompleteness on the fainter half of the distribution may still exist in the sample. But in general, it suggests to us that the GCLF for NGC 5128 is at least roughly normal, falling easily into the same pattern seen in other galaxies.222The slight asymmetry of the plotted points relative to the Gaussian curve (a) is not statistically significant particularly in view of the possible faint-end incompleteness, and (b) in any case resembles what is seen in the Milky Way and M31; see Harris (2001). Since the shape of the bright half of the GCLF is determined largely by the initial mass distribution of the clusters and the faint half by both the initial numbers and later dynamical evolution, there is no physical reason to expect the GCLF to show exact symmetry when plotted in this form.
Although the GCLF shown here is still constructed from a rather small sample, it is worth noting that the GCLF for the Milky Way – which for decades has acted as the baseline comparison system for all other galaxies – is based on a sample of just the same size. In NGC 5128, however, there is obvious promise for building up a much larger census of objects that is virtually free of contamination (as is also true for M31, though the total GC population there is likely to be only one-third that in NGC 5128).
5 The Total Cluster Population in NGC 5128
The total size of the globular cluster system in NGC 5128 has been extraordinarily hard to gauge. More than 20 years after the first quantitative wide-field survey of the system (Harris et al., 1984), our estimates of the total GC population may still not be reliable to any better than 50% or so. As is more thoroughly discussed in Harris et al. (2004a), the essence of the problem is that the large angular size of the NGC 5128 halo on the sky severely dilutes the globular cluster population against the very heavy field contamination by both foreground stars and faint background galaxies; of all the objects in the field around the galaxy that are in the same magnitude and color range occupied by the GCs, no more than about 2% are actually the clusters we want to find. The statistical profile of the GC population derived from the wide-field CCD photometric survey of HHG04 yielded a total clusters over all radii, an estimate that can probably be viewed as a firm lower limit to the population since it adopted a conservative background-count level. A fairly generous upper limit (Harris et al., 1984) is probably near 2000.
The 12 ACS fields in our new survey give us another way, even if very rough, to estimate the GC system profile and total population. Although the total area covered by these fields is quite small compared with the whole extent of the halo (only 6% of the whole area within ; see below), they are located at a wide range of radii and so can be used to gauge the radial falloff of the cluster population. Most importantly, the cluster sample they provide is a homogeneous and relatively “pure” one more nearly free of contamination than any previous material. From the GCLF data (see Fig. 7), we can plausibly expect that we have found all of the GCs in our frames down to at least a magnitude fainter than the GCLF turnover level except in the inner bulge regions where severe crowding and projections on the dust lanes reduce the discovery fraction. Then if we plot up the number of detected GCs per frame against the projected galactocentric distance of the frame, we should expect to see a radial falloff, albeit with much random scatter because of small-number statistics.
A plot of this type is shown in Figure 8. As expected, the innermost field (C6 at ) appears to be heavily affected by incompleteness, falling well below the trend set by the other 11 fields. A least-squares fit of a simple power law to these 11 points gives , shown by the solid line in Fig. 8. It is obvious from the Figure that these data are extremely sketchy, and the power-law slope is no better determined than ; nevertheless, it is quite consistent with the value derived by HHG04, as well as with expected from the known correlation of with host galaxy luminosity (see HHG04).
Using the fact that each ACS/WFC frame has an area arcmin2, and integrating the derived profile over the radial range , we then estimate a total of 1020 clusters over that range and brighter than our adopted limit . (Here we assume, more or less arbitrarily, that the 10 clusters in our data fainter than that limit will compensate for the slight incompleteness that we suspect may be present brighter than that level, as noted above. Within the accuracy of our calculation, this correction is negligible.) Inside the density profile of the GC system flattens off (HHG04), so to estimate the number of clusters in the core we take a constant arcmin-2 over that area, giving a further 190 clusters for . Finally, since the limiting magnitude will include % of the total cluster population over all luminosities for a GCLF dispersion of 1.3 mag, we derive a final, very approximate estimate clusters. This value is unlikely to be accurate to better than %, but it suggests to us that the estimate of clusters over all radii by HHG04 was too conservative, and was probably the result of a slightly too-high background count level in the presence of the severe field contamination. For a galaxy luminosity (HHG04), the specific frequency of the NGC 5128 cluster system is then , on the low end of the “normal” range for giant E galaxies.
Our new estimate of the cluster system size and profile obviously needs much refinement. Nevertheless, we believe that several hundred more clusters in the halo of NGC 5128 remain to be found, by appropriately designed search techniques. Most of these will be in the magnitude range (within a magnitude of the turnover point), corresponding roughly to . Furthermore, our surveys to this point have covered only the radial region out to a radius, which is less than 30 kpc from the galaxy center. It is already well known that the halo of NGC 5128 extends much further out than that (Peng, Ford, & Freeman, 2004a; Rejkuba et al., 2005), indicating that significant numbers of clusters at larger radii can probably be found as well. Extrapolating the density curve in Fig. 8 outward to (say) (57 kpc) would predict anywhere from 100 to 400 more clusters in the outer halo, depending on various plausible assumptions about how steeply the GCS profile drops off at these larger radii (see also HHG04). Thus the global GC population in NGC 5128 over its entire halo might approach 2000.
The fact that such a rough, first-order argument as we have just used can still yield a competitive estimate of the cluster population is a forceful indicator of just how much we need a wide-field imaging survey of the NGC 5128 halo under subarcsecond seeing conditions.
6 Summary
We have used deep HST/ACS images of 12 fields scattered around the bulge and halo of NGC 5128 to find a total of 131 globular clusters or cluster candidates. Of these, 62 are previously known GCs, leaving 69 newly discovered objects. The objects range in magnitude from down to .
The objects in our list are all highly probable globular clusters, with profiles distinctly more extended than those of foreground stars. Even with first-order profile measurement (i.e. rough FWHM values), they display a wide range of magnitude and effective radius. The luminosity distribution (GCLF) for the clusters appears to be very close to normal for giant E galaxies, once a small bright-end bias in the sample is corrected for.
Finally, a new estimate of the cluster population around NGC 5128 suggests that the system contains globular clusters over all magnitudes and within a projected radius of . If this is the case, then the specific frequency of the system is .
References
- Beasley et al. (2006) Beasley, M. et al. 2006, in preparation
- Drinkwater et al. (2003) Drinkwater, M.J., Gregg, M.D., Hilker, M., Bekki, K., Couch, W.J., Ferguson, H.C., Jones, J.B., & Phillipps, S. 2003, Nature, 423, 519
- Djorgovski (1995) Djorgovski, S. 1995, ApJ, 438, L29
- Gómez et al. (2006) Gómez, M., Geisler, D., Harris, W.E., Richtler, T., Harris, G.L.H., & Woodley, K.A. 2006, A&A, 447, 877
- Harris et al. (2004a) Harris, G.L H., Geisler, D., Harris, W.E., Schmidt, B.P., Hesser, J.E., Reid, M., Milne, M., Hulme, S.C., & Kidd, T.T. 2004a, AJ, 128, 712
- Harris et al. (2004b) Harris, G.L.H., Harris, W.E., & Geisler, D. 2004b, AJ, 128, 723 (HHG04)
- Harris et al. (1992) Harris, G.L.H., Geisler, D., Harris, H.C., & Hesser, J.E. 1992, AJ, 104, 613
- Harris et al. (1984) Harris, G.L.H., Hesser, J.E., Harris, H.C., & Curry, P.J. 1984, ApJ, 287, 175
- Harris et al. (1998) Harris, G.L.H., Poole, G B., & Harris, W.E. 1998, AJ, 116, 2866
- Harris (1996) Harris, W.E. 1996, AJ, 112, 1487
- Harris (2001) Harris, W.E. 2001, in Star Clusters, Saas-Fee Advanced Course 28 (New York: Springer), ed. L.Labhardt & B.Binggeli
- Harris et al. (2002) Harris, W.E., Harris, G.L.H., Holland, S.T., & McLaughlin, D.E. 2002, AJ, 124, 1435 (Paper I)
- Haşegan et al. (2005) Haşegan, M. et al. 2005, ApJ, 627, 203
- Holland, Côté, & Hesser (1999) Holland, S., Côté, P., & Hesser, J.E. 1999, A&A, 348, 418
- Huxor et al. (2005) Huxor, A.P., Tanvir, N.R., Irwin, M.J., Ibata, R., Collett, J.L., Ferguson, A.M.N., Bridges, T., & Lewis, G.F. 2005, MNRAS, 360, 1007
- Jones et al. (2006) Jones, J.B. et al. 2006, AJ, 131, 312
- Jordan et al. (2005) Jordan, A. et al. 2005, ApJ, 634, 1002
- Kraft et al. (2001) Kraft, R.P., Kregenow, J.M., Forman, W.R., Jones, C., & Murray, S.S. 2001, ApJ, 560, 675
- larsen et al. (2001) Larsen, S.S., Brodie, J.P., Huchra, J.P., Forbes, D.A., & Grillmair, C. 2001, AJ, 121, 2974
- McLaughlin (2000) McLaughlin, D.E. 2000, ApJ, 539, 618
- McLaughlin & van der Marel (2005) McLaughlin, D. E., & van der Marel, R. 2005, ApJS, 161, 304
- Martini & Ho (2004) Martini, P., & Ho, L.C. 2004, ApJ, 610, 233
- Peng, Ford, & Freeman (2004a) Peng, E.W., Ford, H.C., & Freeman, K.C. 2004a, ApJ, 602, 685
- Peng, Ford, & Freeman (2004b) Peng, E.W., Ford, H.C., & Freeman, K.C. 2004b, ApJ, 602, 705
- Phillipps et al. (2001) Phillipps, S., Drinkwater, M.J., Gregg, M.D., & Jones, J.B. 2001, ApJ, 560, 201
- Rejkuba (2001) Rejkuba, M. 2001, A&A, 369, 812
- Rejkuba et al. (2005) Rejkuba, M., Greggio, L., Harris, W.E., Harris, G.L.H., & Peng, E.W. 2005, ApJ, 631, 262
- Woodley, Harris, & Harris (2005) Woodley, K.A., Harris, W.E., & Harris, G.L.H. 2005, AJ, 129, 2654
| Cluster | FWHM | Field | ||||||||
|---|---|---|---|---|---|---|---|---|---|---|
| PFF011 | 13 24 36.85 | -43 19 16.3 | 20.36 | 207.1 | 18.553 | 0.778 | 1.398 | 0.09 | 4.13 | C29 |
| C29 | 13 24 40.37 | -43 18 5.3 | 19.02 | 207.0 | 17.533 | 0.838 | 1.924 | 0.08 | 3.92 | C29 |
| PFF016 | 13 24 43.59 | -42 53 7.2 | 11.37 | 314.9 | 19.334 | 0.876 | 1.853 | 0.01 | 4.36 | C30 |
| PFF021 | 13 24 54.16 | -42 54 50.4 | 8.78 | 315.9 | 18.814 | 0.703 | 1.318 | 0.03 | 3.14 | C3,C30 |
| C30 | 13 24 54.35 | -42 53 24.7 | 9.84 | 321.8 | 16.681 | 0.813 | 1.789 | 0.05 | 5.71 | C30 |
| PFF023 | 13 24 54.54 | -42 48 58.6 | 13.59 | 333.6 | 18.971 | 0.768 | 1.511 | 0.06 | 3.70 | C32 |
| AAT111563 | 13 24 56.06 | -43 10 16.4 | 10.80 | 212.3 | 20.049 | 0.678 | 1.091 | 0.12 | 4.20 | C12 |
| C3 | 13 24 58.21 | -42 56 10.0 | 7.33 | 312.8 | 17.081 | 0.801 | 1.940 | 0.06 | 3.94 | C3 |
| PFF029 | 13 25 1.59 | -42 54 40.8 | 8.03 | 323.7 | 19.098 | 0.401 | 0.621 | 0.18 | 6.08 | C3 |
| C4 | 13 25 1.81 | -43 9 25.5 | 9.53 | 209.7 | 17.498 | 0.738 | 1.451 | 0.15 | 6.10 | C12 |
| PFF031 | 13 25 2.74 | -43 11 21.3 | 11.18 | 204.0 | 18.952 | 0.796 | 1.479 | 0.02 | 3.37 | C12 |
| PFF034 | 13 25 3.35 | -43 11 39.7 | 11.41 | 202.9 | 19.384 | 0.808 | 1.502 | 0.07 | 4.31 | C12 |
| C32 | 13 25 3.37 | -42 50 46.1 | 11.29 | 336.9 | 17.854 | 0.852 | 2.006 | 0.02 | 2.99 | C32 |
| PFF035 | 13 25 4.45 | -43 10 48.5 | 10.55 | 203.7 | 19.132 | 0.936 | 2.000 | 0.04 | 4.70 | C12 |
| C43 | 13 25 4.79 | -43 9 38.9 | 9.47 | 206.1 | 18.068 | 0.780 | 1.521 | 0.16 | 4.69 | C12 |
| C12 | 13 25 5.69 | -43 10 30.8 | 10.19 | 203.2 | 17.358 | 0.869 | 1.984 | 0.17 | 4.15 | C12 |
| WHH09 | 13 25 8.51 | -43 2 57.4 | 3.93 | 242.6 | 18.300 | 0.868 | 1.979 | 0.02 | 4.63 | C6 |
| f2.GC70 | 13 25 8.93 | -43 8 53.7 | 8.47 | 203.8 | 20.039 | 0.663 | 1.253 | 0.19 | 7.21 | C12 |
| f2.GC69 | 13 25 9.06 | -43 10 2.1 | 9.51 | 200.9 | 19.301 | 0.917 | 1.813 | 0.03 | 2.87 | C12 |
| AAT113992 | 13 25 10.49 | -43 3 24.0 | 3.86 | 234.3 | 19.818 | 0.966 | 1.955 | 0.03 | 4.85 | C6 |
| C14 | 13 25 10.49 | -42 44 52.8 | 16.57 | 349.1 | 17.407 | 0.752 | 1.655 | 0.07 | 4.38 | C14 |
| PFF041 | 13 25 11.14 | -43 3 9.6 | 3.62 | 236.2 | 19.007 | 0.761 | 1.471 | 0.02 | 3.40 | C6 |
| AAT115339 | 13 25 18.42 | -43 4 9.8 | 3.45 | 209.1 | 19.561 | 0.815 | 1.546 | 0.04 | 3.67 | C6 |
| C6 | 13 25 22.17 | -43 2 45.9 | 1.90 | 211.6 | 16.510 | 0.835 | 1.858 | 0.17 | 5.61 | C6 |
| PFF052 | 13 25 25.73 | -43 5 16.6 | 4.14 | 184.8 | 19.416 | 0.755 | 1.442 | 0.05 | 3.59 | C18 |
| WHH16/K102 | 13 25 27.97 | -43 4 2.2 | 2.89 | 178.7 | 18.599 | 0.925 | 2.036 | 0.04 | 3.60 | C18 |
| f2.GC31 | 13 25 29.45 | -43 7 41.7 | 6.56 | 177.1 | 20.154 | 0.772 | 1.395 | 0.10 | 4.02 | C19 |
| f2.GC28 | 13 25 30.17 | -43 6 54.6 | 5.78 | 175.4 | 21.156 | 0.663 | 1.701 | 0.05 | 7.40 | C19 |
| AAT117287 | 13 25 31.06 | -43 4 16.9 | 3.20 | 168.6 | 20.450 | 0.107 | 1.374 | 0.02 | 6.87 | C18 |
| f2.GC23 | 13 25 32.78 | -43 7 2.3 | 5.97 | 170.9 | 18.186 | 0.789 | 1.708 | 0.02 | 3.22 | C19 |
| f2.GC20 | 13 25 33.14 | -43 7 1.3 | 5.96 | 170.2 | 21.013 | 0.766 | 1.870 | 0.14 | 5.46 | C19 |
| f2.GC18 | 13 25 33.65 | -43 7 19.2 | 6.27 | 169.9 | 21.147 | 0.781 | … | 0.02 | 3.53 | C19 |
| K131 | 13 25 32.86 | -43 4 29.1 | 3.47 | 164.0 | 18.741 | 0.906 | 2.104 | 0.02 | 2.76 | C18 |
| WHH22 | 13 25 35.31 | -43 5 29.0 | 4.56 | 162.0 | 18.032 | 0.766 | 1.631 | 0.03 | 3.50 | C18,C19 |
| f2.GC14 | 13 25 35.89 | -43 7 16.1 | 6.31 | 166.1 | 20.824 | 0.439 | 1.678 | 0.09 | 4.06 | C19 |
| AAT118198 | 13 25 37.45 | -43 5 45.0 | 4.94 | 158.7 | 19.031 | 0.909 | 2.110 | 0.06 | 2.79 | C18,C19 |
| PFF059 | 13 25 39.63 | -43 4 1.4 | 3.62 | 142.6 | 19.479 | 0.855 | 1.943 | 0.04 | 4.36 | C18 |
| C18/K163 | 13 25 39.86 | -43 5 1.8 | 4.48 | 150.0 | 16.891 | 0.618 | 1.603 | 0.17 | 4.79 | C18,C19 |
| f2.GC03 | 13 25 40.89 | -43 8 16.1 | 7.52 | 161.2 | 19.384 | 0.700 | 1.240 | 0.04 | 3.33 | C19 |
| AAT119508 | 13 25 42.51 | -43 3 41.5 | 3.73 | 133.1 | 19.857 | 0.883 | 1.832 | 0.12 | 6.46 | C18 |
| C19 | 13 25 43.38 | -43 7 22.9 | 6.87 | 155.2 | 17.554 | 0.780 | 1.661 | 0.03 | 4.64 | C19 |
| PFF063 | 13 25 43.79 | -43 7 55.0 | 7.39 | 156.4 | 19.452 | 0.674 | 1.176 | 0.08 | 3.15 | C19 |
| G284 | 13 25 46.58 | -42 57 3.0 | 5.37 | 40.2 | 19.412 | 0.789 | 1.853 | 0.04 | 2.85 | C25 |
| PFF066 | 13 25 47.14 | -43 6 8.9 | 6.14 | 144.5 | 19.436 | 0.774 | 1.629 | 0.05 | 3.89 | C19 |
| AAT120336 | 13 25 50.21 | -43 6 8.6 | 6.48 | 140.4 | 19.668 | 0.835 | 1.809 | 0.07 | 4.74 | C19 |
| AAT120976 | 13 25 54.28 | -42 56 20.5 | 6.84 | 45.4 | 19.991 | 0.740 | 1.511 | 0.03 | 4.19 | C7,C25 |
| PFF079 | 13 25 58.90 | -42 53 18.8 | 9.70 | 36.1 | 19.140 | 0.718 | 1.484 | 0.04 | 3.05 | C37 |
| C104/AAT121826 | 13 25 59.47 | -42 55 30.7 | 8.10 | 45.9 | 19.403 | 0.743 | 1.405 | 0.08 | 3.58 | C7,C25 |
| G221 | 13 26 1.10 | -42 55 13.4 | 8.52 | 45.9 | 18.828 | 0.775 | 1.715 | 0.06 | 3.75 | C7,C25 |
| PFF083 | 13 26 1.81 | -42 58 15.0 | 6.89 | 65.1 | 19.436 | 0.774 | 1.683 | 0.04 | 3.17 | C25 |
| C25 | 13 26 2.84 | -42 56 57.0 | 7.68 | 56.9 | 17.965 | 0.863 | 1.952 | 0.13 | 3.44 | C7,C25 |
| G293 | 13 26 4.19 | -42 55 44.7 | 8.59 | 51.1 | 18.693 | 0.664 | 1.349 | 0.07 | 3.28 | C7,C25 |
| C105 | 13 26 5.04 | -42 55 36.3 | 8.80 | 51.0 | 21.758 | 0.821 | 1.922 | 0.32 | 10.38 | C25 |
| f1.GC20 | 13 26 5.38 | -42 55 22.4 | 9.00 | 50.1 | 21.216 | 0.788 | 1.839 | 0.26 | 10.39 | C7,C25 |
| C7 | 13 26 5.40 | -42 56 32.4 | 8.30 | 56.3 | 16.644 | 0.682 | 1.534 | 0.08 | 5.83 | C7,C25 |
| G170 | 13 26 6.92 | -42 57 35.0 | 8.02 | 63.6 | 18.727 | 0.835 | 1.844 | 0.03 | 3.72 | C7 |
| C36 | 13 26 7.72 | -42 52 0.2 | 11.72 | 38.7 | 17.944 | 0.667 | 1.378 | 0.14 | 3.57 | C37 |
| f1.GC15 | 13 26 8.87 | -42 53 42.5 | 10.59 | 45.4 | 19.531 | 0.915 | 2.224 | 0.07 | 3.36 | C37 |
| f1.GC14 | 13 26 9.37 | -42 53 17.5 | 10.95 | 44.2 | 19.671 | 0.712 | 1.421 | 0.06 | 6.95 | C37 |
| f1.GC34 | 13 26 9.67 | -42 53 16.9 | 11.00 | 44.3 | 20.961 | 0.855 | 1.896 | 0.03 | 3.15 | C37 |
| f1.GC21 | 13 26 10.51 | -42 55 0.2 | 9.96 | 51.9 | 21.358 | 0.956 | 2.071 | 0.02 | 6.83 | C37 |
| C37 | 13 26 10.57 | -42 53 42.6 | 10.81 | 46.6 | 17.962 | 0.758 | 1.691 | 0.03 | 3.15 | C37 |
| Cluster | FWHM | Field | Notes | ||||||||
|---|---|---|---|---|---|---|---|---|---|---|---|
| C111 | 13 24 26.97 | -43 17 20.0 | 19.62 | 214.4 | 21.363 | 0.885 | 1.172 | 0.03 | 4.23 | C29 | |
| C112 | 13 24 32.66 | -43 18 48.8 | 20.32 | 209.6 | 21.310 | 0.913 | 1.668 | 0.21 | 9.79 | C29 | |
| C113 | 13 24 37.75 | -43 16 26.5 | 17.81 | 210.8 | 19.120 | 0.748 | 1.378 | 0.13 | 3.30 | C29 | |
| C114 | 13 24 40.48 | -42 53 35.3 | 11.46 | 311.3 | 21.423 | 0.971 | 2.037 | 0.12 | 12.96 | C30 | |
| C115 | 13 24 48.71 | -42 52 35.5 | 11.12 | 320.3 | 19.507 | 0.726 | 1.372 | 0.05 | 5.62 | C30 | |
| C116 | 13 24 55.46 | -43 9 58.5 | 10.61 | 213.7 | 21.837 | 0.901 | 1.967 | 0.12 | 5.34 | C12 | |
| C117 | 13 24 56.06 | -42 54 29.6 | 8.81 | 319.1 | 19.262 | 0.920 | 2.011 | 0.07 | 3.75 | C3 | |
| C118 | 13 24 57.17 | -43 8 42.6 | 9.39 | 216.3 | 20.672 | 1.085 | 1.924 | 0.30 | 3.98 | C12 | |
| C119 | 13 24 57.69 | -42 55 48.4 | 7.64 | 314.3 | 20.669 | 0.349 | 0.487 | 0.11 | 7.09 | C3 | |
| C120 | 13 24 57.95 | -42 52 4.9 | 10.56 | 329.1 | 21.433 | 0.904 | 1.828 | 0.08 | 15.64 | C30 | |
| C121 | 13 24 58.42 | -43 8 21.2 | 8.97 | 216.5 | 22.446 | 0.565 | 1.080 | 0.22 | 5.79 | C12 | |
| C122 | 13 24 59.01 | -43 8 21.4 | 8.91 | 215.9 | 22.330 | … | … | 0.10 | 5.30 | C12 | (1) |
| C123 | 13 24 59.92 | -43 9 8.6 | 9.46 | 212.3 | 20.244 | 0.859 | 1.637 | 0.10 | 4.05 | C12 | |
| C124 | 13 25 0.37 | -43 10 46.9 | 10.85 | 207.3 | 21.574 | 0.784 | 1.498 | 0.05 | 6.61 | C12 | |
| C125 | 13 25 0.83 | -43 11 10.6 | 11.16 | 206.0 | 20.664 | 0.887 | 1.671 | 0.08 | 6.07 | C12 | |
| C126 | 13 25 0.91 | -43 9 14.5 | 9.45 | 211.1 | 22.663 | 0.875 | 1.354 | 0.19 | 4.08 | C12 | |
| C127 | 13 25 1.32 | -43 8 43.4 | 8.97 | 212.4 | 21.620 | 0.801 | 1.593 | 0.31 | 6.13 | C12 | |
| C128 | 13 25 1.46 | -43 8 33.0 | 8.81 | 212.9 | 20.947 | 1.089 | 2.131 | 0.07 | 10.23 | C12 | |
| C129 | 13 25 1.63 | -42 50 51.3 | 11.34 | 335.2 | 20.831 | 0.876 | 1.757 | 0.03 | 4.45 | C32 | |
| C130 | 13 25 1.86 | -42 52 27.8 | 9.88 | 331.5 | 19.851 | 0.730 | 1.368 | 0.09 | 3.69 | C30 | |
| C131 | 13 25 3.67 | -42 51 21.7 | 10.72 | 335.9 | 20.202 | 0.778 | 1.363 | 0.08 | 5.87 | C32 | |
| C132 | 13 25 8.79 | -43 9 9.6 | 8.72 | 203.2 | 18.896 | 0.794 | 1.480 | 0.06 | 3.60 | C12 | |
| C133 | 13 25 11.05 | -43 1 32.3 | 3.05 | 262.6 | 19.300 | … | … | 0.12 | 3.80 | C6 | (3) |
| C134 | 13 25 13.20 | -43 2 31.3 | 2.97 | 242.4 | 20.711 | 0.931 | 1.735 | 0.34 | 6.11 | C6 | |
| C135 | 13 25 14.07 | -43 0 51.8 | 2.49 | 276.5 | 18.900 | … | … | 0.11 | 3.56 | C6 | (3) |
| C136 | 13 25 14.07 | -43 3 35.0 | 3.47 | 225.4 | 21.190 | 0.305 | 1.295 | 0.11 | 4.90 | C6 | |
| C137 | 13 25 16.06 | -43 2 19.3 | 2.42 | 240.9 | 19.040 | … | … | 0.03 | 3.69 | C6 | (3) |
| C138 | 13 25 16.91 | -43 3 8.0 | 2.79 | 224.6 | 19.974 | 0.815 | 1.555 | 0.03 | 3.80 | C6 | |
| C139 | 13 25 17.06 | -43 2 44.6 | 2.50 | 230.4 | 18.863 | 0.760 | 1.866 | 0.03 | 3.26 | C6 | |
| C140 | 13 25 17.42 | -43 3 25.2 | 2.94 | 219.3 | 19.830 | 0.818 | 1.570 | 0.06 | 5.01 | C6 | |
| C141 | 13 25 18.14 | -43 2 50.9 | 2.43 | 225.5 | 20.945 | 0.604 | 1.288 | 0.60 | 12.11 | C6 | |
| C142 | 13 25 18.50 | -43 1 16.4 | 1.67 | 265.7 | 17.640 | … | … | 0.09 | 4.41 | C6 | |
| C143 | 13 25 23.20 | -43 3 12.9 | 2.22 | 201.3 | 20.525 | 0.823 | 1.345 | 0.22 | 5.83 | C6 | |
| C144 | 13 25 26.28 | -43 4 38.5 | 3.50 | 184.0 | 21.959 | 0.405 | 1.257 | 0.68 | 8.76 | C18 | |
| C145 | 13 25 28.81 | -43 4 21.6 | 3.22 | 176.1 | 17.814 | 0.726 | 1.510 | 0.06 | 3.99 | C18 | |
| C146 | 13 25 29.87 | -43 5 9.2 | 4.03 | 174.1 | 19.940 | 0.843 | 1.773 | 0.04 | 4.08 | C18 | |
| C147 | 13 25 30.65 | -43 3 47.1 | 2.70 | 168.1 | 20.055 | 0.829 | 1.523 | 0.12 | 5.77 | C18 | |
| C148 | 13 25 31.75 | -43 5 46.0 | 4.68 | 170.7 | 20.207 | 0.585 | 1.042 | 0.16 | 10.55 | C18 | |
| C149 | 13 25 32.32 | -43 7 17.1 | 6.20 | 172.0 | 19.680 | 0.743 | 1.343 | 0.03 | 3.67 | C19 | |
| C150 | 13 25 33.82 | -43 2 49.6 | 2.03 | 146.0 | 19.780 | … | … | 0.11 | 3.75 | C18 | (3) |
| C151 | 13 25 33.93 | -43 3 51.4 | 2.94 | 156.9 | 19.952 | 0.948 | 2.317 | 0.02 | 3.42 | C18 | |
| C152 | 13 25 34.64 | -43 3 16.4 | 2.48 | 148.9 | 17.820 | … | … | 0.10 | 4.80 | C18 | (3) |
| C153 | 13 25 34.64 | -43 3 27.8 | 2.65 | 151.0 | 18.230 | … | … | 0.03 | 5.10 | C18 | (3) |
| C154 | 13 25 34.71 | -43 3 30.2 | 2.69 | 151.2 | 19.580 | … | … | 0.08 | 4.48 | C18 | (3) |
| C155 | 13 25 36.47 | -43 8 3.5 | 7.10 | 166.8 | 21.358 | 0.855 | 1.627 | 0.28 | 9.20 | C19 | |
| C156 | 13 25 38.43 | -43 5 2.6 | 4.37 | 153.1 | 17.651 | 0.899 | 2.106 | 0.10 | 3.66 | C18,C19 | |
| C157 | 13 25 38.45 | -43 3 28.9 | 3.06 | 139.7 | 19.210 | … | … | 0.03 | 3.77 | C18 | (2) |
| C158 | 13 25 38.76 | -43 5 34.5 | 4.88 | 155.3 | 20.061 | 0.801 | 1.606 | 0.04 | 7.41 | C18,C19 | |
| C159 | 13 25 39.17 | -43 4 33.8 | 4.02 | 148.3 | 19.929 | 0.896 | 1.986 | 0.03 | 3.30 | C18 | |
| C160 | 13 25 40.09 | -43 3 7.1 | 3.01 | 130.8 | 19.990 | … | … | 0.18 | 4.20 | C18 | (2) |
| C161 | 13 25 40.52 | -43 7 17.9 | 6.59 | 159.0 | 19.261 | 0.892 | 1.953 | 0.00 | 3.28 | C19 | |
| C162 | 13 25 40.87 | -43 5 0.4 | 4.56 | 147.9 | 20.909 | 0.505 | 1.046 | 0.19 | 9.15 | C18 | |
| C163 | 13 25 41.63 | -43 3 45.8 | 3.66 | 135.6 | 20.431 | 0.815 | 1.547 | 0.13 | 8.06 | C18 | |
| C164 | 13 25 42.09 | -43 3 19.5 | 3.43 | 129.5 | 19.600 | … | … | 0.08 | 4.22 | C18 | (4) |
| C165 | 13 25 43.43 | -43 4 56.5 | 4.77 | 142.7 | 18.173 | 0.812 | 1.931 | 0.00 | 3.71 | C18 | |
| C166 | 13 25 44.90 | -43 4 21.1 | 4.50 | 135.4 | 20.720 | … | … | 0.29 | 12.46 | C18 | (1) |
| C167 | 13 25 45.97 | -43 6 45.4 | 6.54 | 149.1 | 20.410 | … | … | 0.05 | 3.59 | C19 | (3) |
| C168 | 13 25 48.46 | -43 7 12.5 | 7.16 | 147.9 | 19.710 | … | … | 0.04 | 4.30 | C19 | (5) |
| C169 | 13 25 51.01 | -42 55 36.3 | 7.00 | 37.7 | 20.389 | 0.616 | 1.212 | 0.13 | 6.27 | C25 | |
| C170 | 13 25 56.11 | -42 56 12.9 | 7.17 | 46.6 | 22.161 | 0.670 | 1.148 | 0.19 | 4.36 | C25 | |
| C171 | 13 25 57.78 | -42 55 36.1 | 7.82 | 44.8 | 20.670 | 0.784 | 1.577 | 0.08 | 11.31 | C7,C25 | |
| C172 | 13 25 57.95 | -42 53 4.3 | 9.80 | 34.5 | 20.907 | 0.546 | 1.242 | 0.04 | 5.76 | C37 | |
| C173 | 13 25 59.57 | -42 55 1.5 | 8.46 | 43.7 | 21.057 | 0.945 | 2.092 | 0.04 | 9.40 | C7,C25 | |
| C174 | 13 25 59.63 | -42 55 15.7 | 8.30 | 44.8 | 21.424 | 0.992 | 1.812 | 0.04 | 4.66 | C25 | |
| C175 | 13 26 0.93 | -42 58 28.9 | 6.65 | 66.4 | 21.838 | 0.694 | 1.668 | 0.00 | 5.81 | C25 | |
| C176 | 13 26 2.79 | -42 57 5.0 | 7.61 | 57.7 | 21.297 | 0.621 | 1.053 | 0.13 | 5.32 | C7,C25 | |
| C177 | 13 26 3.20 | -42 54 30.1 | 9.30 | 44.4 | 21.087 | 1.024 | 1.867 | 0.24 | 7.01 | C7 | |
| C178 | 13 26 3.85 | -42 56 45.3 | 7.95 | 56.5 | 21.534 | 0.791 | 1.481 | 0.13 | 7.71 | C25 | |
| C179 | 13 26 9.87 | -42 56 36.0 | 8.96 | 59.5 | 21.043 | 0.672 | 1.088 | 0.09 | 8.24 | C7 |
Notes to Table 1: (1) Faint globular? (2) Very crowded, in inner bulge region (3) Very compact globular or possible star (4) Possible globular, slightly elliptical (5) Globular next to very bright star
| Cluster | |||||
|---|---|---|---|---|---|
| C40 | 13 23 42.33 | -43 09 37.8 | 18.490 | 0.791 | 1.630 |
| C41 | 13 24 38.97 | -43 20 06.5 | 17.969 | 0.951 | 1.980 |
| C29 | 13 24 40.37 | -43 18 05.3 | 17.533 | 0.838 | 1.924 |
| G19 | 13 24 46.44 | -43 04 11.6 | 18.636 | 0.748 | 1.422 |
| G277 | 13 24 47.36 | -42 58 29.9 | 18.607 | 0.764 | 1.530 |
| C2 | 13 24 51.47 | -43 12 11.2 | 17.937 | 0.778 | 1.546 |
| C100 | 13 24 52.06 | -43 04 32.7 | 19.030 | 0.694 | 1.409 |
| G302 | 13 24 53.27 | -43 04 34.8 | 18.728 | 0.775 | 1.450 |
| C11 | 13 24 54.70 | -43 01 21.6 | 17.197 | 0.786 | 2.011 |
| C31 | 13 24 57.42 | -43 01 08.1 | 17.710 | 0.881 | 2.023 |
| C32 | 13 25 03.37 | -42 50 46.1 | 17.854 | 0.852 | 2.006 |
| C44 | 13 25 31.73 | -43 19 22.8 | 18.148 | 0.701 | 1.441 |
| C17 | 13 25 39.72 | -42 55 59.1 | 17.186 | 0.533 | 1.422 |
| C101 | 13 25 40.56 | -42 56 01.0 | 20.077 | 0.820 | 1.762 |
| C102 | 13 25 52.09 | -42 59 12.8 | 21.038 | 0.829 | 1.673 |
| C21 | 13 25 52.73 | -43 05 46.5 | 17.397 | 0.773 | 1.576 |
| C22 | 13 25 53.55 | -42 59 07.5 | 17.696 | 0.643 | 1.516 |
| C23 | 13 25 54.57 | -42 59 25.3 | 16.686 | 0.749 | 1.904 |
| C103 | 13 25 55.01 | -42 59 13.8 | 18.439 | 1.997 | 1.993 |
| C104 | 13 25 59.48 | -42 55 30.7 | 19.403 | 0.742 | 1.404 |
| G221 | 13 26 01.10 | -42 55 13.4 | 18.828 | 0.775 | 1.715 |
| C25 | 13 26 02.83 | -42 56 57.0 | 17.965 | 0.862 | 1.952 |
| G293 | 13 26 04.19 | -42 55 44.7 | 18.693 | 0.665 | 1.349 |
| C105 | 13 26 05.04 | -42 55 36.3 | 21.758 | 0.821 | 1.922 |
| C7 | 13 26 05.40 | -42 56 32.4 | 16.644 | 0.681 | 1.533 |
| C106 | 13 26 06.19 | -42 56 44.1 | 20.657 | 0.799 | 1.879 |
| C37 | 13 26 10.57 | -42 53 42.6 | 17.962 | 0.758 | 1.691 |