Atomic Carbon in APM 08279+5255 at z=3.91 111Based on observations carried out with the IRAM Plateau de Bure Interferometer. IRAM is supported by INSU/CNRS (France), MPG (Germany) and IGN (Spain).
Abstract
We present a detection of [CI] 3PP0 emission in the lensed quasar APM 08279+5255 at z=3.91 using the IRAM Plateau de Bure interferometer. The [CI] line velocity and width are similar to the values of previously detected high-J CO and HCN lines in this source, suggesting that the emission from all of these species arises from the same region. The apparent luminosity of the [CI] line is K km s-1 pc2, which implies a neutral carbon mass, M⊙, where is the lensing magnification factor. The [CI] line luminosity is consistent with the large molecular gas mass inferred from the nuclear CO line luminosity (10 M⊙). We also present an upper limit on the H2O 1101 line luminosity in APM 08279+5255 of, K km s-1 pc2 (3-).
1 Introduction
The ultraluminous quasar APM 08279+5255 at z=3.91 (Irwin et al. 1998) is strongly gravitationally lensed (Ledoux et al. 1998; Ibata et al. 1999; Egami et al. 2000) and appears to be one of the most luminous objects in the Universe, with an apparent infrared luminosity of 1015 L⊙ (Lewis et al. 1998). Observations over a wide range of wavelengths (e.g., Downes et al. 1999; Ellison et al. 1999; Gallagher et al. 2002; Soifer et al. 2004; Wagg et al. 2005) have shown that APM08279+5255 contains an active nucleus and likely a starburst component.
The combination of extreme intrinsic luminosity and amplification by strong gravitational lensing has allowed APM 08279+5255 to be detected in many rotational lines of CO (J=4-3 and J=9-8 Downes et al. 1999, hereafter D99; J=1-0 and J=2-1 Papadopoulos et al. 2001; Lewis et al. 2002 ), including the unique detection in the high excitation J=11-10 line (A. Weiss et al., in preparation). From high angular resolution observations, D99 suggest that the high-J CO emission arises in a warm, dense circumnuclear disk of sub-kiloparsec size. The detection of both HCN J=5-4 and HCO+ J=5-4 line emission support the idea that the molecular gas is dense (Wagg et al. 2005; Garcia-Burillo et al. 2006)
Given the wealth of molecular lines detected in APM 08279+5255, observations of additional diagnostic lines can provide further constraints on the physical conditions in this high-redshift object. One important tracer of the dense neutral gas within a galaxy’s interstellar medium is atomic carbon, in particular the [CI] 3PP0 line with rest frequency 492.161 GHz (Gérin & Phillips 1998, 2000). This line has not been observed widely in local galaxies due to poor atmospheric transmission near this frequency; however, this line is redshifted into better atmospheric windows for objects at redshifts, z 1. The [CI] 3PP0 line provides a complimentary probe of the physical conditions of dense, neutral gas, and the [CI]/CO ratio may also provide information on the role of X-rays in the molecular excitation (Maloney et al. 1996). In addition, Papadopoulos et al. (2004a, b) argue that this line can provide a measure of the total molecular hydrogen (H2) gas mass, independent of CO line emission.
To date, [CI] emission has been detected in four objects at z , most of which are thought to be gravitationally lensed. The 3PP0 line was first detected in H1413+117 at z=2.6 (the “Cloverleaf”; Barvainis et al. 1997), and more recently the higher excitation 3PP1 line was also detected in this object (Weiss et al. 2003). Other high-redshift objects with [CI] 3PP0 line detections include IRAS F10214 at z=2.3 (and an upper-limit on the [CI] 3PP1 line intensity is reported by Papadopoulos 2005), SMM J14011+0252 at z=2.6 (Weiss et al. 2005), and PSS 2322+1944 at z=4.1 (Pety et al. 2005).
Another important species that acts as a major coolant of dense gas is water. In general, H2O lines at local velocites are not accessible from the ground, but they have been observed from space and are ubiquitous in dense molecular cloud cores in the Galaxy (Ashby et al. 2000; Snell et al. 2000). At high-redshift, a tentative detection of the H2O 2202 line, with rest frequency 752.033 GHz, was reported in IRAS F10214 at z=2.3 (Encrenaz et al. 1993; Casoli et al. 1994). At more modest redshifts, the fundamental transition of ortho-water, H2O 1101 has been detected in absorption towards B0218+357 at z=0.685 (Combes & Wiklind 1997). For APM 08279+5255, the lower excitation H2O 1101 line with rest frequency 556.936 GHz is redshifted into the 3 millimeter atmospheric window.
Here we report a detection of [CI] 3PP0 line emission in APM 08279+5255 at z=3.91, and an upper-limit on H2O 1101 line emission, obtained with the IRAM Plateau de Bure Interferometer (PdBI). Throughout this paper we adopt a -dominated cosmology: km s-1 Mpc-1, , and (Spergel et al. 2006).
2 Observations
We used the IRAM PdBI to search for the [CI] 3PP0 and H2O 1101 lines in APM 08279+5255, redshifted to the 3-millimeter band, on six dates in 1999 and 2001. All of the observations were made in compact configurations of the four or five available antennas. The receivers were tuned to 100.216 GHz for the [CI] line, and 113.406 GHz for the H2O line. Spectral correlators covered a velocity range of 1500 km s-1 for [CI], and 1300 km s-1 for H2O. The phase center was offset by from the CO peak position in D99. Baseline lengths ranged from 17 to 81 meters, and the synthesized beam sizes were (position angle 89o) for the [CI] image, and (position angle 82o) for the H2O image. The nearby quasar 0749+540 was used for complex gain calibration. The flux scale was set using standard sources including MWC349, CRL618, 3c345.3 and 0923+392, and should be accurate to better than 20%. The on-source integration time for the [CI] and H2O images were equivalent to 7.3 hours and 3.1 hours, respectively, with the full six antenna array. The resulting [CI] image has an rms noise of 0.36 mJy beam-1 in a 150 km s-1 channel, and the H2O image has a higher rms noise of 0.96 mJy beam-1 in a 130 km s-1 channel, reflecting lower atmospheric transmission near the edge of the 3-millimeter window.
3 Results
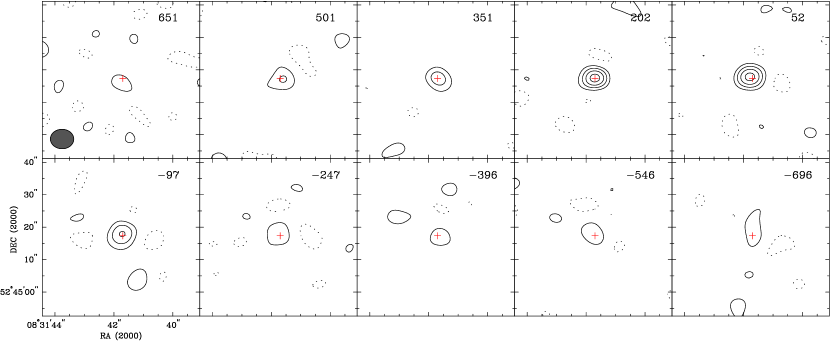
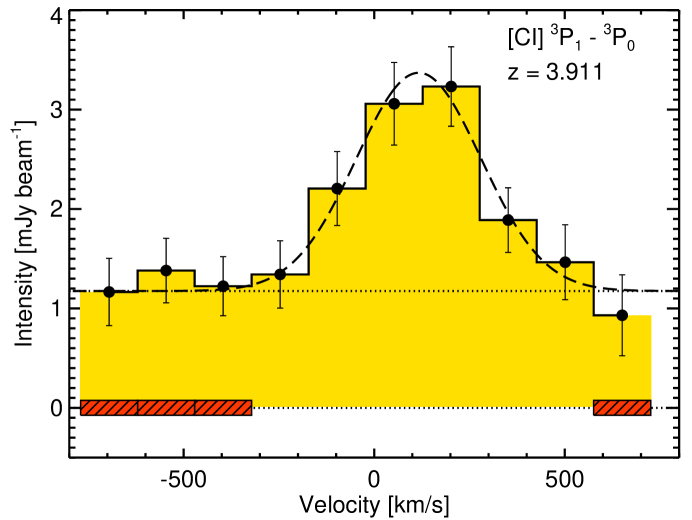
Figure 1 shows images of the [CI] line and continuum emission over the full velocity range observed. The line emission is clearly detected in several velocity bins and appears spatially unresolved. The position of peak emission is consistent with that found previously for the dust continuum, CO lines, and HCN line. Figure 2 shows the spectra of the [CI] and H2O lines at this position. There is no evidence for significant H2O line emission. For the [CI] spectrum, we estimate the continuum level at 100.2 GHz using the “line-free” channels to be mJy. For the H2O spectrum, we estimate the continuum level at 113.4 GHz using all of the channels to be mJy. These values are consistent with the 93.9 GHz continuum flux of mJy measured by D99 and a thermal spectrum. A Gaussian fit to the continuum subtracted [CI] 3PP0 spectrum yields a peak of mJy, central velocity km s-1 (z=), and km s-1. The integrated intensity of the [CI] 3PP0 line is Jy km s-1, which implies a line luminosity K km s-1 pc2, following Solomon et al. (1992). Table 1 lists the fitted and derived [CI] 3PP0 line parameters.
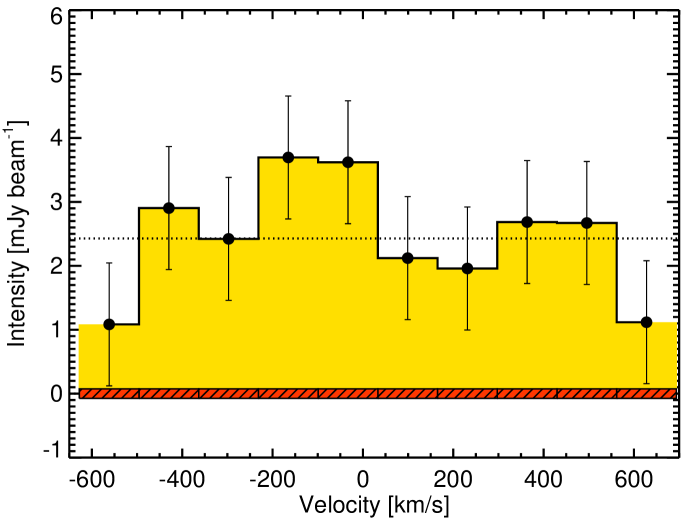
We place an upper limit on the H2O 1101 line emission from the noise around the mean in the spectrum, assuming = 450 km s-1 like the CO, HCN, and [CI] lines. The 3- upper limit to the integrated intensity is Jy km s-1, which implies an upper limit to the H2O line luminosity K km s-1 pc2.
4 Discussion
4.1 Emission Region and [CI]/CO Luminosity Ratio
The fitted [CI] line center and width are compatible with previous observations of the HCN J=5-4 and HCO+ J=5-4 lines (Wagg et al. 2005; Garcia-Burillo et al. 2006), though offset by km s-1 from the mean redshift determined from the high-J CO lines (D99; Weiss et al. 2006, in preparation). While the line center difference between the [CI] and CO is formally significant at the 4 level, the true significance is likely lower, since the line profiles from this complex source are almost certainly not described accurately by a single Gaussian. Given this uncertainty, the modest signal-to-noise ratios, and the lack of any resolved velocity structure in the observed line profiles, we simplify our analysis by assuming the [CI] emission region is cospatial with the CO line emission region, such that the conditions derived for a model with a single physical component apply to both species. We stress that even if all of the observed lines do arise from a single physical component, the fitted Gaussian centers and widths of lines with different excitation properties will not necessarily match each other perfectly, given the complexity of the underlying source structure and optical depth effects. Data of higher quality and from more transitions will be required to relax the single component assumption and to justify more sophisticated modeling.
The gas in the single component region is warm and dense, and is likely to be a circumnuclear disk of sub-kiloparsec size. The CO emission clearly has been magnified by gravitational lensing, and models suggest a magnification factor in the range 3 to 20 (D99, Lewis et al. 2002), or even higher in the models by Egami et al. (2000). The exact magnification factor depends critically on the intrinsic size of the emitting region. If the [CI], CO, and HCN emission are truly co-spatial, however, then the magnification factors are the same, and line luminosity ratios will not suffer any biases due to differential lensing effects.
The luminosity ratio between the [CI] and CO lines is a potential diagnostic of the gas excitation and carbon chemistry. To compare the luminosities of [CI] and CO in APM 08279+5255, we use the nuclear component of the CO J=1-0 emission (Lewis et al. 2002), which gives . This value falls within the range found for local galaxies (Gérin & Phillips 2000), and also the range 0.15 - 0.32 for the other four high-redshift objects that have been detected in both [CI] and CO emission. This ratio does not appear to have any strong dependence on environment, either in the local galaxy sample, or at high-redshifts. Given the significant uncertainties in the [CI]/CO luminosity ratio for any individual object, it is not possible to place strong constraints on the contribution of X-ray irradiation to the molecular gas excitation.
We can estimate the [CI/CO] abundance ratio from the observations, adopting the physical conditions derived from multi-transition CO observations (Wagg et al. 2005; A. Weiss et al. in preparation) and a simple radiative transfer model. Using the RADEX222http://www.strw.leidenuniv.nl/~moldata/radex.html LVG code (Schöier et al. 2005), we find that an abundance ratio, [CI/CO] 0.6, reproduces the observed [CI] 3PP0 to CO J=1-0 line luminosity ratio. This ratio is similar to that found in the nearby starburst galaxy M82 ([CI/CO] 0.5; Schilke et al. 1993, White et al. 1994).
4.2 Neutral Carbon Mass
The luminosity of the [CI] 3PP0 line can be used to derive the neutral carbon mass (Weiss et al. 2005), as
| (1) |
where ( K and K are the energies of the 3P1 and 3P2 levels above the ground state) is the partition function. The only high-redshift object for which both the [CI] 3PP0 and [CI] 3PP1 lines have been measured is the “Cloverleaf” quasar, where K (Weiss et al. 2003, 2005). Without a measurement of the higher [CI] 3PP1 line in APM 08279+5255, the value of is uncertain. However, Weiss et al. (2005) show that for K and LTE, the estimated neutral carbon mass is insensitive to the assumed excitation temperature. Adopting a nominal value of K for the [CI] 3PP0 line in APM 08279+5255 (from the derived molecular gas and dust temperatures), the neutral carbon mass within the nuclear region of APM 08279+5255 is M⊙, where is the lensing magnification factor. If were K, then the estimated [CI] mass would be 30% lower.
4.3 Molecular Gas Mass
The luminosity in the CO J=1-0 line is the traditional tracer of molecular gas (= H2) mass in the Galaxy and in a variety of extragalactic environments. For nearby ultraluminous infrared galaxies (ULIRGs; Sanders & Mirabel 1996; Sanders et al. 1988), which are believed to be analogues to the currently detectable luminous high-redshift galaxies, the empirical scaling factor between CO J=1-0 luminosity and H2 gas mass is 1 M⊙ (K km s-1 pc2)-1 (Downes & Solomon 1998). If we apply this factor to the nuclear CO J=1-0 line emission in APM 08279+5255 (Papadopoulos et al. 2001; Lewis et al. 2002), then the molecular gas mass implied is M⊙.
Following Papadopoulos et al. (2004a), the small scatter in the observed [CI]/CO luminosity ratio suggests that [CI] 3PP0 emission may provide an independent estimate of molecular gas mass. Papadopoulos et al. (2004a) relate the integrated [CI] line intensity, , to molecular (= H2) gas mass, as
| (2) |
where is the [CI]-to-H2 abundance ratio (we assume ), is the Einstein A-coefficient ( s-1), and is the excitation factor which depends on the kinetic temperature, and density of the gas (we adopt ). The cosmology dependence is included through the luminosity distance, . Using the observed integrated intensity of the [CI] 3PP0 line in APM 08279+5255 gives M⊙, in good agreement with the molecular gas mass estimated from the CO J=1-0 line.
Table 2 presents the molecular gas mass estimates derived from [CI] and from CO for the five high-redshift objects where both lines are detected, adjusted to a common cosmology. The [CI] 3PP0 line integrated intensities for IRAS F10214, SMM J14011+0252, and H1413+117 are taken from Weiss et al. (2005), and for PSS 2322+1944 from Pety et al. (2005). The CO J=1-0 line has been detected only in APM 08279+5255 and PSS 2322+1944 (Carilli et al. 2002). For the other objects, which are not detected in the CO J=1-0 line, we use observations of the CO J=3-2 line (IRAS F10214; Solomon et al. 1992, H1413+117; Weiss et al. 2003, SMM J14011+0252; Downes & Solomon 2003), which is approximately equal to the luminosity in the CO J=1-0 line at high-redshifts for warm, dense gas (Solomon et al. 1992). Though the uncertainties are large, there is very good agreement between the molecular gas mass estimates from the two tracers.
4.4 H2O
We did not detect any significant H2O 1101 line emission in APM 08279+5255. We can estimate the H2O line luminosity expected for the circumnuclear region for a nominal water abundance, again adopting the previously derived physical conditions for the region. In Galactic molecular clouds, a typical ortho-H2O abundance is relative to H2 (Snell et al. 2000; Ashby et al. 2000). For = 80 K, cm-3, an LVG calculation gives cm-2(km s-1)-1, K km s-1 pc2, more than two orders of magnitude below the upper limit. In strongly shocked regions, the H2O abundance has been observed to be enhanced by more than an order of magnitude, but even if that were the case, calculations show that the H2O 1101 line emission would remain well below the achieved detection threshold.
5 Summary
We detected [CI] 3PP0 line emission in the ultraluminous quasar APM 08279+5255 at z=3.91. The [CI] 3PP0 line width and center are similar to those of previously detected millimeter CO and HCN lines. Estimates of the molecular gas mass based on the [CI] 3PP0 line and based on CO lines yield similar results, and there is no evidence for any substantial contribution from a primarily atomic medium. Though the observational uncertainties remain large, this seems to be the case for the five high-redshift sources with reported detections of both CO and [CI] emission lines. The [CI] 3PP0 line may be a valuable alternative probe of molecular gas mass in systems lacking high excitation CO line emission, where the molecular medium is more diffuse and cooler ( K,and cm-3; Papadopoulos et al. 2004a). The Atacama Large Millimeter Array will greatly expand the number of high-redshift sources accessible in [CI] and CO emission, and will have the capability to spatially resolve the emission to show directly the extent of the gas.
6 Acknowledgments
We thank the IRAM PdBI staff for carrying out these observations. J.W. is grateful to the SAO for support through a predoctoral student fellowship and the Department of Astrophysics at INAOE for a graduate student scholarship. This work is partially supported by CONACYT grant 39953-F. J.W. thanks Sébastien Muller for helpful tips on PdBI data reduction, and also Padeli Papadopoulos and Matthew Ashby for discussions about [CI] and H2O excitation and emission at high-redshift. We thank the referee for a thorough reading of the submitted manuscript and helpful suggestions.
References
- (1)
- (2) Ashby, M. L. N., et al. 2000, ApJ, 539, L115
- (3)
- (4) Barvainis, R., Maloney, P., Antonucci, R., Alloin, D., 1997, ApJ, 484, 695
- (5)
- (6) Carilli C. L., Cox P., Bertoldi F., Menten K. M., Omont A., Djorgovski S. G., Petric A., Beelen A., Isaak K. G., McMahon R. G. 2002, ApJ, 575, 145
- (7)
- (8) Casoli F., Gerin M., Encrenaz P. J., Combes F., 1994, A&A, 287, 716
- (9)
- (10) Combes, F. & Wiklind, T. 1997, ApJ 486, L79
- (11)
- (12) Downes, D. & Solomon, P.M. 1998, ApJ, 507, 615
- (13)
- (14) Downes D., Neri R., Wiklind T., Wilner D. J., Shaver P. A. 1999, ApJ, 513, L1 (D99)
- (15)
- (16) Downes, D. & Solomon, P.M. 2003, ApJ, 528, 37
- (17)
- (18) Egami E., Neugebauer G., Soifer B. T., Matthews K., Ressler M., Becklin E. E., Murphy T. W., Dale D. A., 2000, ApJ, 535, 561
- (19)
- (20) Ellison S. L., Lewis G. F., Pettini M., Sargent W. L. W., Chaffee F. H., Foltz C. B., Rauch M., Irwin M. J., 1999, PASP, 111, 946
- (21)
- (22) Encrenaz P. J., Combes F., Casoli F., Gerin M., Pagani L., Horellou C., Gac C., 1993, A&A, 273, L19
- (23)
- (24) Gallagher S. C., Brandt W. N., Chartas G., Garmire G. P., 2002, ApJ, 567, 37
- (25)
- (26) Garcia-Burillo S., et al., 2006, astro-ph/0605656
- (27)
- (28) Gérin M. & Phillips T.G. 1998, ApJ, 509, L17
- (29)
- (30) Gérin M. & Phillips, T.G. 2000, ApJ, 537, 644
- (31)
- (32) Ibata R. A., Lewis G. F., Irwin M. J., Lehár J., Totten E. J., 1999, AJ, 118, 1922
- (33)
- (34) Irwin M. J., Ibata R. A., Lewis G. F., Totten E. J., 1998, ApJ, 505, 529
- (35)
- (36) Lewis, G.F., Chapman, S.C., Ibata, R.A., Irwin, M.J., & Totten, E.J. 1998, ApJ, 505, L1
- (37)
- (38) Lewis, G.F., Carilli, C., Papadopoulos, P., Ivison, R.J., 2002, MNRAS, 330, L15
- (39)
- (40) Maloney, P.R., Hollenbach, D.J., Tielens, G.G.M. 1996, ApJ, 466, 561
- (41)
- (42) Papadopoulos, P., Ivison, R.J., Carilli, C., Lewis., G. 2001, Nature, 409, 58
- (43)
- (44) Papadopoulos, P.P., Thi, W.-F., Viti, S. 2004a, MNRAS, 351, 147
- (45)
- (46) Papadopoulos, P.P. & Greve, T.R. 2004b, ApJ, 615, L29
- (47)
- (48) Papadopoulos P. P., 2005, ApJ, 623, 763
- (49)
- (50) Pety J., Beelen A., Cox P., Downes D., Omont A., Bertoldi F., Carilli C. L. 2005, A&A, 428, L21
- (51)
- (52) Sanders, D.B., Soifer, B.T., Elias, J.H., Madore, B.F., Matthews, K., Neugebauer, G., & Scoville, N.Z. 1988, ApJ, 325, 74
- (53)
- (54) Sanders, D.B. & Mirabel, I.F. 1996, ARA&A, 34, 749
- (55)
- (56) Schilke, P., Carlstrom, J.E., Keene, J., Phillips, T.G., 1993, ApJ, 417, L67
- (57)
- (58) Schöier, F.L., van der Tak, F.F.S., van Dishoek, E.F., Black, J.H., 2005, A&A, 432, 369
- (59)
- (60) Snell, R. L., et al. 2000, ApJ, 539, L101
- (61)
- (62) Soifer B. T., et al. 2004, ApJS, 154, 151
- (63)
- (64) Solomon, P.M., Downes, D., Radford, S.J.E., 1992, ApJ, 398, L29
- (65)
- (66) Spergel D. N., et al., 2006, astro-ph/0603449
- (67)
- (68) Wagg J., Wilner D. J., Neri R., Downes D., Wiklind T. 2005, ApJ, 634, L13
- (69)
- (70) Weiss A., Henkel C., Downes, D., Walter F. 2003, A&A, 409, L41
- (71)
- (72) Weiss A., Downes D., Henkel C., Walter F. 2005, A&A, 429, L25
- (73)
- (74) White, G.J., Ellison, B., Claude, S., Dent, W.R.F., Matheson, D.N., 1994, A&A, 284, L23
- (75)
| [CI] 3PP0 peak: | mJy |
| [CI] 3PP0 : | km s-1 |
| [CI] 3PP0 aavelocity with respect to z=3.911, determined from CO lines.: | km s-1 |
| : | Jy km s-1 |
| bbThe [CI] 3PP0 luminosity is not corrected for lensing magnification.: | K km s-1 pc2 |
| Object | aaRedshift of CO emission. | M[CI] | M(CO) | M([CI]) | Refs. |
|---|---|---|---|---|---|
| [M⊙/107] | [M⊙/1010] | [M⊙/1010] | CO,[CI] | ||
| IRAS F10214 | 2.29 | (2.70.3) | (11.32.5) | (18.82.4) | 1,2 |
| H1413+117 | 2.56 | (8.11.2) | (44.30.7) | (55.88.6) | 3,2 |
| SMM J14011+0252 | 2.57 | (3.70.6) | (9.51.0) | (25.94.3) | 4,2 |
| APM 08279+5255 | 3.91 | (4.40.6) | (13.43.0) | (26.73.7) | 5,6 |
| PSS 2322+1944 | 4.12 | (3.80.6) | (12.55.3) | (25.23.7) | 7,8 |
Note. — is the gravitational lensing magnification factor
References – (1) Solomon et al. 1992; (2) Weiss et al. 2005; (3) Weiss et al. 2003; (4) Downes & Solomon 2003; (5) Lewis et al. 2002; (6) This paper; (7) Carilli et al. 2002; (8) Pety et al. 2005