Extended Emission by Dust in the Dwarf Galaxy UGC 10445
Abstract
We present Spitzer Space Telescope images of the isolated dwarf galaxy UGC 10445. The galaxy is detected at all photometric bands (3.6-160 ) as well as in the Multiband Imaging Photometer for Spitzer (MIPS) spectral energy distribution mode (55-95 ). We derive a star formation rate of 0.25 M⊙ yr-1 based on H and infrared flux densities. There is over M⊙ of cold dust (T 18 K) in the galaxy, represented by 160 emission, that extends to a larger radius than the ultraviolet (UV), optical and near-infrared light. Such extended emission has been seen previously only in dwarf galaxies in cluster environments. We suggest the source of heating for this dust is UV light originating in star forming complexes. To produce the large quantity of dust requires a higher rate of star formation in the past than is observed currently.
Subject headings:
galaxies: individual (UGC 10445) – infrared: galaxies1. Introduction
Late-type dwarf galaxies are recognized generally as systems important to the understanding of the evolution of galaxies since they may resemble higher redshift star-forming systems. They have low metallicities, typically less than one-third solar, and are gas-rich; irregular and spiral-like dwarfs are currently undergoing bursts of star formation in low-density environments. Past work has identified the characteristics of star formation in dwarf galaxies by investigating H i content (Thuan & Martin 1981; Salzer et al. 2002) and using optical and H imaging (Hunter et al. 1993; Patterson & Thuan 1996; van Zee 2000), as well as optical and near-infrared spectroscopy (e.g., Skillman et al. 1994). Molecular gas tracers have proven to be more difficult to detect (Taylor et al. 1998) and have only recently begun to shed increasing light on the nature of dwarfs (Leroy et al. 2005).
In comparison, there has been a burst of discoveries in the last ten years concerning dust content in dwarfs. One of the first investigations of dwarf galaxies in the infrared was based on Infrared Astronomical Satellite (IRAS) data of a sample of irregular galaxies (Hunter et al. 1989). Following this, differences in infrared colors between dwarfs and regular spirals were discovered in IRAS data (Melisse & Israel 1994), with dwarf galaxies having higher 60/100 flux ratios and lower 12/25 flux ratios than the spirals. Thuan et al. (1999), using ISOCAM (Cesarsky et al. 1996) spectra from the Infrared Space Observatory (ISO; Kessler et al. 1996), showed that even very low metallicity systems () could contain large dust masses, between and M⊙, leading to high extinctions (mag) in regions previously assumed to have little or no dust. Other low metallicity galaxies were probed, including NGC 5253 (Crowther et al. 1999), a quiescent molecular cloud in the SMC (Reach et al. 2000), and N66 in the SMC (Contursi et al. 2000). Dust masses and luminosities for dwarfs were derived from ISOPHOT observations in the far-infrared (FIR; Popescu et al. 2002), which also found that some dwarfs in the Virgo Cluster have emission components from cold dust that extend beyond the main optical emitting bodies of the galaxies.
Some dwarfs have measurements in the submillimeter or millimeter where the very cold dust content also can be probed (Lisenfeld et al. 2002; Böttner et al. 2003). However, observations in this spectral regime usually lack the surface brightness sensitivity for detecting diffuse emission, which is better probed in the FIR at the peak of the dust emission. Galliano et al. (2003; 2005), Madden et al. (2005), and Bot et al. (2004) combined data at multiple wavelengths, including the mid-IR and the submillimeter, for a fuller discussion of the dust properties and content of dwarfs. They showed that these galaxies generally have fainter aromatic (PAH) bands than are found in other starforming galaxies and that they often have an overabundance of small dust grains, with large, very cold (T 10 K) dust masses.
The terminology in the literature regarding dust temperature varies. For the purposes of this paper, we use “cold” to describe the T K dust, following many precedents (e.g., Contursi et al. 2001; Hippelein et al. 2003; Xilouris et al. 2004; Vlahakis et al. 2005; Stevens et al. 2005; Clements et al. 2005; Holwerda et al. 2005; Krause et al. 2006; Pérez González et al. 2006). This dust is to be distinguished from the much more strongly heated dust, situated around star-forming regions, which we will refer to as ”warm” (T K). There is, as mentioned above, even colder dust in galaxies, e.g., in very opaque molecular clouds, where grains receive practically no photons and may have temperatures below 10 K, and we will refer to this as ”very cold”, following Stickel et al. (2005) and Galliano et al. (2005).
With the increased sensitivity and higher spatial resolution of the Spitzer Space Telescope over previous IR missions, we now have the opportunity to explore the temperatures, spatial distributions, and morphologies of dust in galaxies with mid and far-IR wavelength imaging at a level of detail never seen before for a dwarf. One of the first dwarfs to be examined with Spitzer was the blue compact object SBS 0335-052 (Houck et al. 2004a) using the Infrared Spectrograph (IRS; Houck et al. 2004b). They detected a hot (T 150 K) dust component as well as a cooler (T 65 K), more massive dust component. A more complete sample of dwarfs was presented by Rosenberg et al. (2005) where the focus on star-forming, low-luminosity dwarfs led to the discovery of diverse mid-IR colors and properties for the sample. Strong emission at 8 indicated the presence of a hot dust and/or PAH component in some of the dwarfs, contrary to previous expectations for these galaxies, which predicted that dust escapes from star-forming dwarfs. A recent survey of low-metallicity dwarf galaxies with Spitzer (Engelbracht et al. 2005) showed that the mid-IR colors, i.e, the 8 - to - 24 flux density ratio, depend strongly on metallicity in a manner consistent with a weakening of the aromatic features at very low metallicity. Hogg et al. (2005) have also studied a sample of low-luminosity star-forming galaxies that appeared to show very little dust and molecular emission.
Here we describe Infrared Array Camera (IRAC; Fazio et al. 2004) and Multiband Imaging Photometer for Spitzer (MIPS; Rieke et al. 2004) imaging data for UGC 10445, which was observed as part of a larger guaranteed time observing (GTO) program concentrating on dwarf and low surface brightness galaxies. UGC 10445 has a small bulge to disk ratio with late-type spiral features. It is generally classified as an SBc starbursting galaxy and is at a distance of 15.08 Mpc (van Zee 2000) with an optical extent of 28 17 and an inclination of 30 (de Jong 1996). Its proximity and the low IR background near the galaxy, as well as the extensive ground-based optical, H (van Zee 2000; James et al. 2004), near-IR (de Jong 1996), and H i (van der Hulst 2002; Lee et al. 2002) data available for it, make UGC 10445 an ideal case for study.
2. Observations and Data Reduction
2.1. Spitzer Images
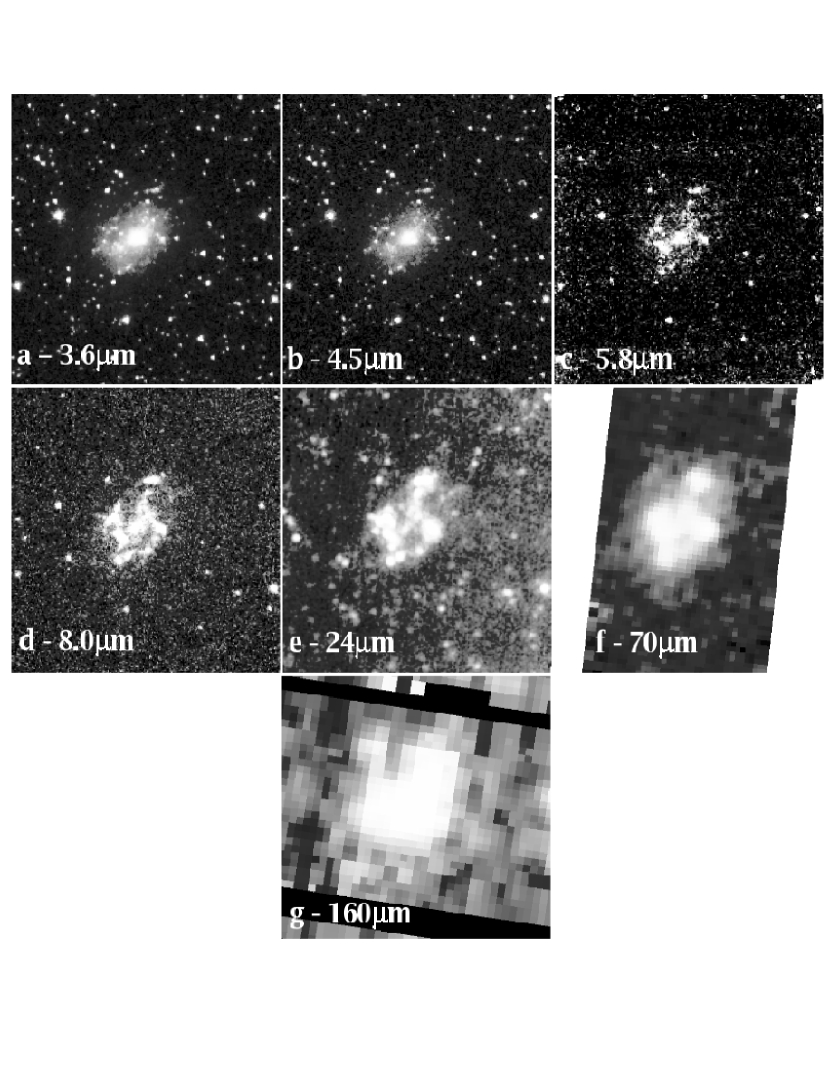
We obtained IRAC images at 3.6, 4.5, 5.8, and 8.0 and MIPS photometry mode data at 24, 70, and 160 . The IRAC data were acquired in five dithered frames with a total exposure time of 150 s. The MIPS exposure times were 690 s at 24 , 250 s at 70 , and 42 s at 160 . The IRAC images were reduced with the standard Spitzer Science Center data pipeline. The MIPS data were reduced using the Data Analysis Tool (DAT) v. 2.96 developed by Gordon et al. (2005). Figure 1 shows the full suite of images taken by IRAC and MIPS. The IRAC spatial resolution is 2 at all wavelengths. The MIPS spatial resolutions are 6, 18, and 40 at 24, 70, and 160 , respectively.
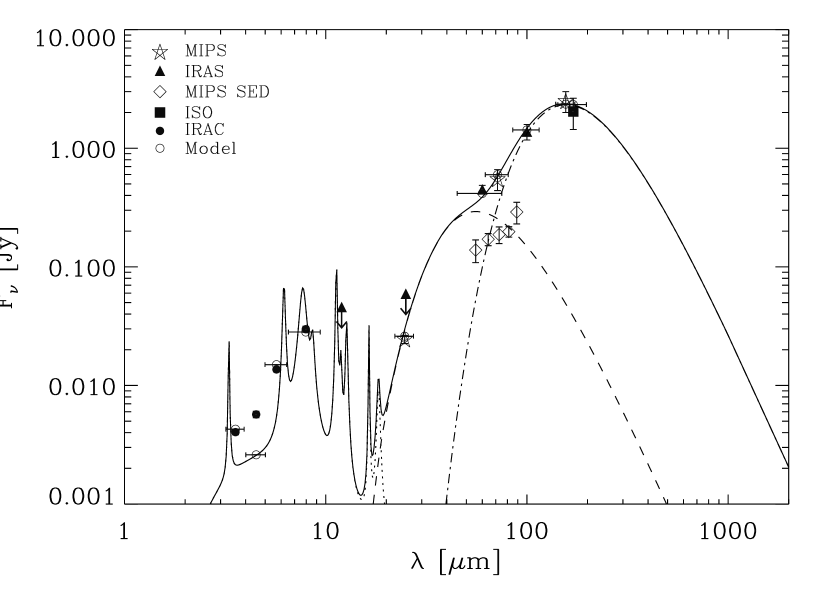
We used a simple circular aperture to calculate flux densities at the IRAC and MIPS wavelengths shown in Figure 2 and listed in Table 1. Additional processing in the form of background subtraction was done first by subtracting a constant value from each image. The value of this constant was determined by taking an average of the pixel values outside the circular aperture used for the photometry. In Table 1, we include and -band points from de Jong & van der Kruit (1994) as well as fluxes and limits from IRAS and a 170 flux density from the ISO Serendipity Survey (Stickel et al. 2004). Our derived fluxes agree with the ISO and IRAS detections or limits where the bandpasses between the two data sets are similar. The IRAC uncertainties are estimated to be 5% at 3.6 and 4.5 (3% absolute calibration uncertainty; Reach et al. 2005: and a small additional contribution for scattered light in an extended source; W. Reach, private communication) but could range up to 15% at 5.8 and 8.0 due to scattered light (W. Reach, private communication). The MIPS flux calibration uncertainties are 10% at 24 and 20% at 70 and 160 .
2.2. MIPS Spectral Energy Distribution Mode Data
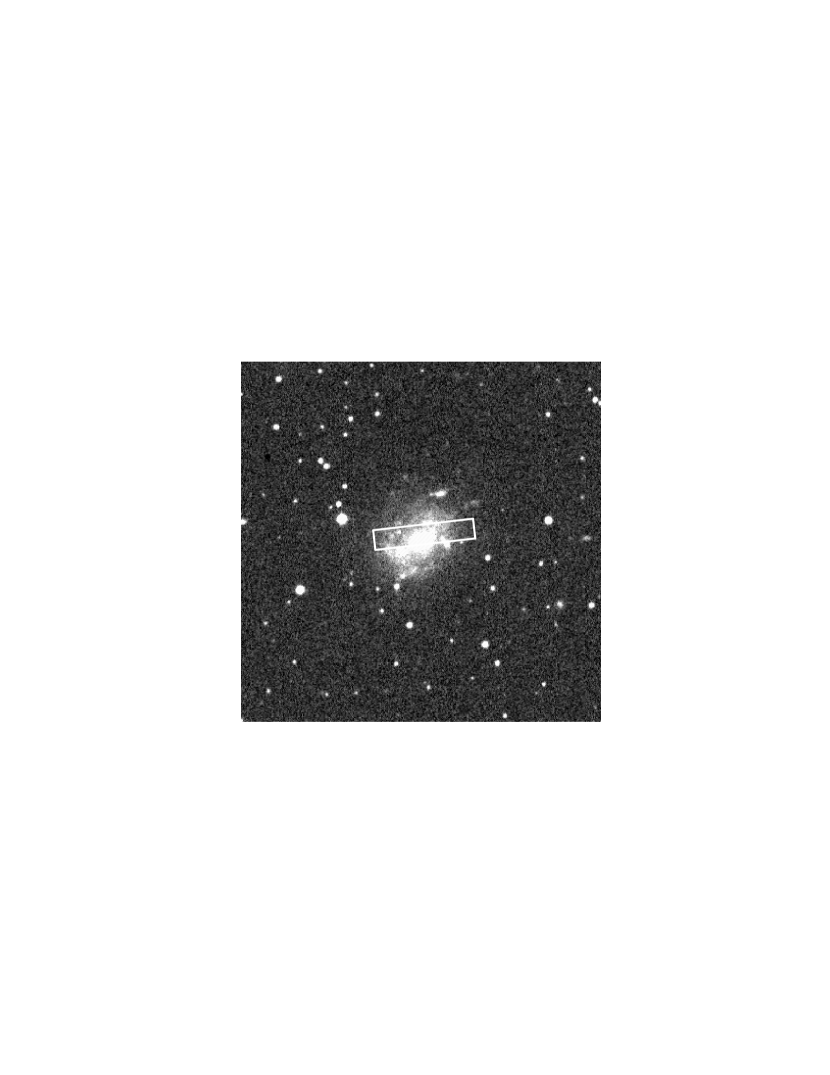
UGC 10445 is the only one of the GTO sample for which spectral energy distribution (SED) data were obtained, providing low resolution (R 15-25) spectroscopy from 51-90 . The reflective “slit” width is two pixels projected onto the 70 detector array of MIPS ( 20), and an extraction aperture covering 9 pixels ( 89) was used. The slit was centered on the optical nucleus of the galaxy (J2000 RA: 16h 33m 47.6s, Dec: +28d 59 06) at a position angle of 966, where we obtained a 360 s exposure. Figure 3 shows the position of the MIPS SED mode slit superposed on the galaxy. These data were also reduced using the DAT with illumination and other corrections specifically derived for SED mode. Flux variations along the slit caused by sensitivity fluctuations between array columns were corrected using observations obtained for NGC 4418. NGC 4418 is essentially a point source at 70 , and its flux was measured as the object was stepped along the SED slit. These results were used to revise the illumination correction image applied to the data during the DAT reduction process.
Flux calibration for the SED observation used Arcturus as a standard star. The 50-100 continuum of the star was assumed to be with Jy at the effective wavelength of the 70 filter bandpass. An instrumental response function was derived for Arcturus taking into account slit losses as a function of wavelength. This response was applied to the extracted SED spectrum of UGC 10445 uncorrected for slit losses since the object extends over the entire area sampled by the slit at 70 .
The narrow slit width and the faint extended nature of the galaxy at 70 make analysis of the SED observation challenging. Based on the 70 imaging photometry, we estimate that only 25% of the total flux of the galaxy falls within the SED slit. To achieve a signal-to-noise ratio of 5 or greater over most of the spectrum, the 9 columns making up the spectral extraction aperture were median combined to filter out noisy pixels. The root-mean-square of the combined pixels was used as an estimate of the flux density uncertainty at the appropriate wavelength along the spectrum. We then re-binned the spectrum into five flux density measurements, shown in Table 1 and Figure 2, that represent the general shape of the continuum. The estimated uncertainties listed in Table 1 for the flux density measurements are the standard deviation about the mean of the pixels within each wavelength bin. The SED data points are systematically below the photometry of UGC 10445 shown in Figure 2 because the SED data sample only a small central section of the galaxy.
2.3. Ancillary Data: UV, H, and Hi
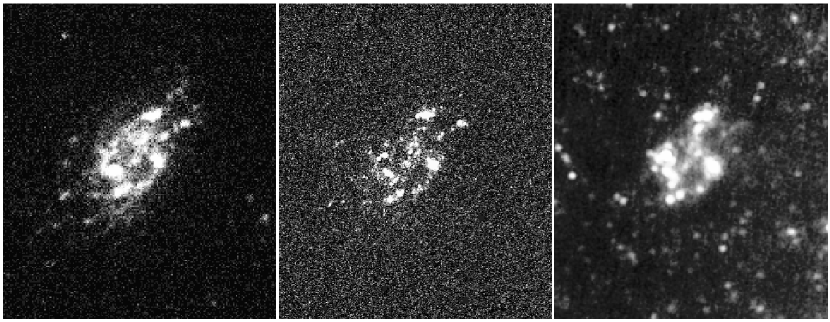
Supplementary ground-based data were obtained from a variety of sources. A Galaxy Evolution Explorer (GALEX; Martin et al. 2005) far-ultraviolet (FUV; 1344-1786 Å) image of UGC 10445 is shown in Figure 4. These data are taken from the archive available online via the MultiMission Archive at Space Telescope Science Institute (MAST). They are at an effective wavelength of 1528 Å. Detailed explanations of background determination and subtraction, image processing and source extraction can be found in the GALEX documentation available at http://www.galex.caltech.edu/DATA/gr1_docs/index.html.
An H image available through the NASA Extragalactic Database (NED) from van Zee (2000) is also shown in Figure 4. These images were obtained with the KPNO 0.9 m telescope with the f/7.5 secondary in 1998 June in seeing of 17. Data reduction followed standard practice, and details can be found in van Zee (2000). The integrated H flux derived for this image is 7.040.17 erg s-1 cm-2 (van Zee 2000). James et al. (2004) find an H flux of 7.80.8 erg s-1, in good agreement.
H i maps of UGC 10445 are available through the Westerbork observations of neutral Hydrogen in Irregular and SPiral galaxies (WHISP) survey (van der Hulst 2002). The map has flux out to 3 from the center of the galaxy. The galaxy is also well-detected by Lee et al. (2002) using the Arecibo Observatory radio telescope.
3. Analysis
3.1. Morphology
The IRAC and MIPS images shown in Figure 1 demonstrate morphologies expected of a dwarf spiral galaxy. The 3.6 and 4.5 images show a small dim bulge of old stars and spiral arms superimposed on a diffuse disk. In the 5.8 and 8 images, the spiral arms become more distinct. The 24 image displays little or no bulge component with many regions of star formation along spiral arm structures. This is reflected again in the lower resolution 70 image. The 160 image, while not capable of showing the level of detail of the other wavelengths, shows a similar shape.
Figure 4 shows the wavelengths typically associated with star formation in galaxies: UV, H, and 24 . Morphologically, the structures in all the images are similar, with emission dominated by pockets of star formation. Fainter, more extended structures in the northwestern region of the galaxy are present in all images.
3.2. Star Formation Rates
The H ii regions in UGC 10445 are probably relatively lightly obscured, as indicated both by the low metallicity, by the similar morphologies in the UV, H, and infrared, and because the Balmer decrement in the spectrum (Wegner et al. 2003) is 4.52, consistent with moderate extinction. In such a case, a simple single-parameter indicator of the star formation rate (SFR) may be misleading (e.g., Pérez-González et al. 2006). Instead, we make two SFR estimates, one from the infrared output and the second from H, and add them, on the basis that the escaping H gives an indication of the amount of star formation in regions where dust absorption is mild, while the absorbed ionizing flux will appear in the infrared. Pérez-González et al. (2006) give examples in M 81 that demonstrate that this two-parameter approach gives a better indication of the SFR than a single-parameter one.
We begin with the Kennicutt (1998) relation and the van Zee (2000) H flux to derive a SFR of 0.19 M⊙ yr-1. The James et al. (2004) H measurement gives nearly the same value, 0.21 M⊙ yr-1.
We then use two approaches to estimate the amount of the SFR represented by the infrared output. Kennicutt (1998) presents a relation based on IRAS fluxes. If we apply this relation to a total infrared luminosity from the IRAS 12-100 measurements of UGC 10445, we obtain a star formation rate of 0.05 M⊙ yr-1. We have not included the substantial amount of extra luminosity from any cold dust emission that would be detected at 160 , because it would not have been included in the calibration of the Kennicutt relation. In addition, it appears that this luminosity in a number of galaxies is not associated directly with the recent star formation (e.g., Hinz et al. 2004 and references therein). For a second SFR estimate, we use Equation (3) of Alonso-Herrero et al. (2006), which is based on the 24 flux density only. With L 1041 ergs s-1, the Alonso-Herrero et al. (2006) relation gives 0.04 M⊙ yr-1.
The sum and our best estimate of the SFR for UGC 10445 is therefore 0.25 M⊙ yr-1. If we instead use the empirical calibration of Buat & Xu (1996) based on UV and IRAS flux measurements, we obtain a SFR of 0.1 M⊙ yr-1. An upper limit can be derived from the extinction-corrected H and the Balmer decrement, which is 0.4 M⊙ yr-1. We adopt the ”best” value of 0.25 M⊙ yr-1 with an uncertainty of about a factor of 1.5 for the following discussion. This SFR is about a factor of two below the rate for other small, normal star-forming galaxies such as M 33 (e.g., Hippelein et al. 2003), which is also about 1.5 times larger in diameter than UGC 10445.
3.3. Metallicity
We calculate the metallicity for UGC 10445 using the values for the indicators given in Wegner et al. (2003) and the empirical relations and techniques described in Salzer et al. (2005). The [N ii]/H ratio for UGC 10445 is -1.0568 (Wegner et al. 2003) and falls into a “turn-around region” where it is safest to calculate a coarse metallicity using both the [N ii]/H and [O iii]/H ratios. Several empirical relations exist for various calibrations, giving values of 12 + log(O/H) between 8.12 and 8.44 for UGC 10445, with the average metallicity calculated for all these relations being 8.23, or 1/3 solar.
3.4. Extended Dust
Figure 5 shows azimuthally averaged radial intensity profiles for the galaxy. The 24 profile traces faint emission in the inner 03, then bright emission associated with star formation in the clumpy spiral arm structures of the galaxy at 04. This emission drops to the background level by 08. The 70 emission is bright out to a radius of 04, then tapers slowly off to the background level at 1. The 160 emission, however, remains well above the background and extends out to 2 , even as the 24 flux disappears. This extended emission is not the result of resolution differences at the two wavelengths. We tested this assertion by convolving the 70 data with a kernel that transforms the 70 image to the resolution of the 160 data, then recomputing the azimuthally averaged radial profiles. The kernel was created using a Fourier technique on the MIPS PSFs generated by STinyTim (Gordon et al. in preparation). The convolved 70 radial profile is shown as a dashed line on the uppermost panel of Figure 5. Also shown is a dotted line representing the profile for the 3.6 image, which presumably shows the extent of the old stellar population of the galaxy, convolved to the 160 resolution and scaled. The 160 emission appears to go beyond this mature stellar component. The ‘bump’ of emission between a radius of 1 and 15 seen in 160 is not present at shorter wavelengths. The 160 halo indicates a component of diffuse cold dust in the galaxy. Emission by cold dust has been found to be more extended than the warm dust in previous studies of galaxies of greater angular extent as well (e.g., Davies et al. 1999; Engelbracht et al. 2004). Cold dust emission extending beyond the optical bodies of galaxies was previously detected by Popescu & Tuffs (2003) in the case of the spiral NGC 891, and by Popescu et al. (2002) for two Virgo dwarf galaxies.
Sources for heating this cold dust component have been explored, among other works, for spirals in the Virgo cluster by Popescu et al. (2002). Their proposal is that the cold dust is predominantly heated by the diffuse nonionizing UV radiation produced by the young stellar population, with a smaller contribution to the dust heating coming from the optical radiation produced by old stars. This proposal appears to be consistent with model predictions (Popescu et al. 2000; Misiriotis et al. 2001). In the case of UGC 10445, there seems to be little diffuse FUV or near-IR (3.6 ) flux corresponding to the 160 emission as evidenced by the radial profiles in Figure 5. However, the FUV flux needed to heat the dust grains to the temperatures predicted by the blackbody fits may not be very large, and a sufficient amount of UV radiation leaking out of the large star formation complexes could be the source of heating. A simple comparison of FUV and 160 luminosities indicates that the quantities are approximately equal, showing that a modest level of extinction would absorb sufficient UV evergy to power the 160 emission. Dust providing a small level of visual extinction would have sufficient optical depth in the UV to power the far-IR emission through absorption of diffuse UV radiation.
For some dwarf galaxies in the Virgo Cluster where the cold dust emission extends beyond the main optical body of the galaxy, Popescu et al. (2002) suggest that the source of dust heating might be collisional rather than radiative in nature. In particular, they point out that galaxies undergoing bursts of star formation activity produce galactic winds that interact with the intergalactic medium, creating wind bubbles with shocked gas where any dust grains would then be collisionally heated. However, the dynamical and wind interactions implied by this theory are much less likely to be significant in an isolated dwarf like UGC 10445.
3.5. Dust Modeling
The emission by dust in UGC 10445 was modeled by an equation of the form
| (1) |
where ( 15 Mpc), is the mass absorption coefficient, is the Planck function, is the dust mass, and the sum extends over the number of dust components. For UGC 10445, the relatively large 5.8 and 8 fluxes require a hot component that we ascribe to aromatic molecules. While the 100, 160, and 170 emission could be fit with a single-temperature component, including the 24 and 70 fluxes requires an additional component at a different temperature. To satisfactorily fit the full SED of UGC 10445, we adopt a three component dust model: warm and cold silicates () and PAHs, the former to reproduce the 24 - 170 emission and the latter, the 5.8 and 8 emission. The grain size is relatively unimportant; the dust mass, , is proportional to . In the small particle regime (), ; this limit is relevant here as , especially for wavelengths greater than 70 where the bulk of the dust mass is emitting. Therefore, is independent of , the grain size. This is true regardless of the choice of composition.
The dust fraction used in the fitting is reported in Column 3 of Table 1. Mass absorption coefficients for astronomical silicates were computed from Mie theory using the dielectric functions of Laor & Draine (1993). Cross sections for the PAH molecules were taken from Li & Draine (2001). As the canonical PAH spectrum (NGC 7027; e.g, Gezari et al. 1995) exhibits no features beyond 20 , we re-computed the PAH cross-sections (and mass absorption coefficients) leaving off the last three terms of Li & Draine’s Eq. 11. The PAH component is included for completeness of the fit. The mass and temperature estimates afforded by Eq. 1 are unreliable for the PAH component as PAH emission is a stochastic rather than equilibrium process as assumed in Eq. 1.
We adopted a Monte Carlo-type approach to sample densely the parameter space (Mdust,i,TD,i) of our dust model, computing a statistic for each parameter set. Typically, we computed models. We find that the IRAC, MIPS, IRAS 60 and 100 , and ISO data points together are best fit by a PAH component, a warm silicate component with a temperature of K and a cold silicate component at K, shown in Figure 2, where the quoted errorbars are one-sigma. The temperature of the cold dust agrees well with estimates derived from ISO observations of dwarfs (Popescu et al. 2002) as well as those derived from submillimeter data for dwarf galaxies (Lisenfeld et al. 2002; Böttner et al. 2003). We estimate the dust masses of the galaxy to be M⊙ for the warm component and M⊙ for the cold material. These values are only modestly affected by composition choice. Carbonaceous grains used in place of silicates generate dust temperature and mass values of K and M⊙ for a warm component and K and M⊙ for the cold component. Therefore, we see that the cold dust dominates the dust mass. Our data are not sensitive to dust colder than 18 K, so our value should be taken as a lower limit to the cold dust mass. UGC 10445 falls within the dust mass range of 106-108 M⊙ found for normal spiral galaxies (e.g., Sodroski et al. 1997; Bendo et al. 2003).
The necessity of a three-component model with a cold dust component is further verified by the SED-mode MIPS data. A linear least squares fit of all of the SED-mode data points, weighted by the estimated uncertainties, results in a fit of the form
| (2) |
where is the spectral index, is the flux density in Jy, and is the frequency in Hz. The y-intercept of this fit is 17.13.5. From this fit we can estimate flux densities at all three MIPS wavelengths from the area within the extraction aperture. If 25% of the total flux of the galaxy falls within the SED slit, we can then scale the values to arrive at estimates of 0.19, 0.87, and 2.77 Jy at 24, 70, and 160 , respectively. These estimates are reasonably close to the results of the imaging photometry at 70 and 160 but grossly overestimate the 24 flux value. That is, the spectrum must be flatter at 70 than at 24 . The three component model fit easily explains this flatter spectrum because the weaker high-temperature blackbody peaks at 60 .
The diffuse and predominately cold (T 18 K) dust component seen here for UGC 10445 has been known to exist more generally in many different types of galaxies, as shown by millimeter wave measurements and ISO (e.g., Guelin et al. 1995; see review by Tuffs & Popescu 2005). The presence of cold dust in our own Galaxy was confirmed by the COsmic Background Explorer (COBE) satellite (e.g., Reach et al. 1995; Lagache et al. 1998).
An independent estimate of the dust mass can be made using the relation between extinction and NH for diffuse clouds from Draine (2003). A mass column of 3 g cm-2 is required for A, the minimum extinction to result in a high conversion efficiency from UV to the FIR. Taking the geometry of the absorbing dust to be a spherical shell of radius 4 kpc (1 at the distance of UGC 10445) and dust as present in Milky Way diffuse clouds, the total mass of dust for A is 3 M⊙, in excellent agreement with the lower limit to the dust mass of 3 M⊙ calculated from the FIR emission properties of UGC 10445.
The calculated total H i mass for the galaxy is 1.63 109 M⊙ from the WHISP data (van der Hulst 2002); Lee et al. (2002) derive a mass, in agreement, of 1.70 109 M⊙. Using these values with our dust mass estimate, the H i gas mass to dust mass ratio for UGC 10445 is 500. The mean value of this ratio for normal spiral galaxies given by Stevens et al. (2005) is 71 49 based on high-quality SCUBA data in conjunction with ISO and IRAS results. They find a significant correlation between the mass of atomic hydrogen and the mass of cold dust for their sample, but the value of 500 calculated for UGC 10445 does not lie on that relation. However, because our cold dust mass should be considered a lower limit, and because of the relatively large uncertainties in our dust mass values, it is possible that UGC 10445 is consistent with the Stevens et al. (2005) relation.
If UGC 10445 does have high dust content H i gas, this has interesting implications for the nature of the galaxy, which we demonstrate here in a simplified calculation. We take the percentage yield in heavy elements in the dwarf through stellar processes to be 0.2% (de Naray et al. 2004), where a slightly modified Salpeter initial mass function (Bell et al. 2003) is assumed. The H i line width implies a rotation velocity of about 65 km s-1 (Lee et al. 2002), implying that no more than 50% of the metals will be retained in the gravitational well of the galaxy (Garnett 2002). There is a tendency for a decreasing proportion of metals to form in dust with decreasing metallicity (e.g., Inoue 2003). It then follows that more than 3 109 M⊙ of stars must have formed to produce the 3 106 M⊙ of dust observed at 160 . If the near-IR output is from the old stellar population left from this long duration star formation, we can calculate a -band stellar mass-to-light (M/L∗,K) ratio and retrieve the mass of stars necessary to create the total dust mass. Using the relations in Bell & de Jong (2001), we select a M/L∗,K of 0.33 which, when used in combination with the -band magnitude of de Jong & van der Kruit (1994), leads to a total stellar mass of 3.9 109 M⊙. This value is confirmed by a similar calculation in Zavala et al. (2003) and is consistent with the above requirement, given the uncertainty of our dust mass estimate. The current star formation rate would require 16 Gyr to form this mass of stars. Therefore, the galaxy must be below the typical star forming rate over its lifetime.
4. Summary
Spitzer IR images of the isolated dwarf galaxy UGC 10445 are presented. Combining the H luminosity with that in the MIPS bands, we calculate a SFR for UGC 10445 of 0.25 M⊙ yr-1. We find a smooth diffuse cold dust component that extends out to a radius of 2, as well as a warmer component of smaller extent. This extended component is consistent with ISO results for cluster dwarfs but has not been seen previously in isolated dwarf galaxies. We calculate the temperatures of the components to be 50 and 18 K with a total dust mass for the galaxy of 3 106 M⊙; the cold component dominates the dust mass. The source of heating for the cold dust component is most likely UV photons leaking from active star forming complexes in the disk. The stellar mass of the galaxy is adequate to produce the large amount of dust but requires that UGC 10445 form stars at a rate greater in the past than in the current epoch.
References
- (1)
- (2) Alonso-Herrero et al. 2006, submitted to ApJ
- (3)
- (4) Bell, E. F., & de Jong, R. S. 2001, ApJ, 550, 212
- (5)
- (6) Bell, E. F., McIntosh, D. H., Katz, N., Weinberg, M. D. 2003, ApJS, 149, 289
- (7)
- (8) Bendo, G. J., et al. 2003, AJ, 125, 2361
- (9)
- (10) Bot, C., Boulanger, F., Lagache, G., Cambrésy, L., & Egret, D. 2004, A&A, 423, 567
- (11)
- (12) Böttner, C., Klein, U., & Heithausen, A. 2003, A&A, 408, 493
- (13)
- (14) Buat, V., & Xu, C. 1996, A&A, 306, 61
- (15)
- (16) Calzetti, D., et al. 2005, astro-ph 0507427
- (17)
- (18) Cesarsky, C. J., et al. 1996, A&A, 315, L32
- (19)
- (20) Clements D. L., Farrah, D., Rowan-Robinson, M., Afonso, J., Priddey, R., & Fox, M. 2005, MNRAS, 363, 229
- (21)
- (22) Contursi, A., et al. 2000, A&A, 362, 310
- (23)
- (24) Contursi, A., Boselli, A., Gavazzi, G., Bertagna, E., Tuffs, R., & Lequeux, J. 2001, A&A, 365, 11
- (25)
- (26) Crowther, P. A., Beck, S. C., Willis, A. J., Conti, P. S., Morris, P. W., & Sutherland, R. S. 1999, MNRAS, 304, 654
- (27)
- (28) Dale, D. A. & Helou, G. 2002, ApJ, 576, 159
- (29)
- (30) Davies, J. I., Alton, P., Trewhella, M., Evans, R., & Bianchi, S. 1999, MNRAS, 304, 495
- (31)
- (32) de Jong, R. S., & van der Kruit, P. C. 1994, A&AS, 106, 451
- (33)
- (34) de Jong, R. S. 1996, Journal of Astronomical Data, 2, 1
- (35)
- (36) de Naray, R. K., McGaugh, S. S., & de Blok, W. J. G. 2004, MNRAS, 335, 887
- (37)
- (38) Draine, B. T. 2003, ARA&A, 41, 241
- (39)
- (40) Engelbracht, C. W., et al. 2004, ApJS, 154, 248
- (41)
- (42) Engelbracht, C. W., Gordon, K. D., Rieke, G. H., Werner, M. W., Dale, D. A., & Latter, W. B. 2005, ApJ, 628, L29
- (43)
- (44) Fazio, G. G., et al. 2004, ApJS, 154, 10
- (45)
- (46) Galliano, F., Madden, S. C., Jones, A. P., Wilson, C. D., Bernard, J.-P., & Le Peintre, F. 2003, A&A, 407, 159
- (47)
- (48) Galliano, F., Madden, S. C., Jones, A. P., Wilson, C. D., & Bernard, J.-P. 2005, A&A, 434, 867
- (49)
- (50) Garnett, D. R. 2002, ApJ, 581, 1019
- (51)
- (52) Gezari, D. Y., Thornley, M. D., & Varosi, F. 1995, Ap&SS, 224, 465
- (53)
- (54) Gordon, K. D., et al. 2004, ApJS, 154, 215
- (55)
- (56) Gordon, K. D., et al. 2005, PASP, 117, 503
- (57)
- (58) Guelin, M., et al. 1995, A&A, 298, L29
- (59)
- (60) Hinz, J. L., et al. 2004, ApJS, 154, 259
- (61)
- (62) Hippelein, H., Haas, M., Tuffs, R. J., Lemke, D., Stickel, M., Klaas, U., & Völk, H. J. 2003, A&A, 407, 137
- (63)
- (64) Hogg, D. W., Tremonti, C. A., Blanton, M. R., Finkbeiner, D. P., Padmanabhan, N., Quintero, A. D., Schlegel, D. J., & Wherry, N. 2005, ApJ, 624, 162
- (65)
- (66) Holwerda, B. W., Gonzalez, R. A., Allen, R. J., Calzetti, D., van der Kruit, P. C., & SINGS Team 2005, American Astronomical Society Meeting Abstracts, 207, #64.12
- (67)
- (68) Houck, J. R., et al. 2004a, ApJS, 154, 211
- (69)
- (70) Houck, J. R., et al. 2004b, ApJS, 154, 18
- (71)
- (72) Hunter, D. A., Gallagher, J. S., Rice, W. L., & Gillett, F. C. 1989, ApJ, 336, 152
- (73)
- (74) Hunter, D. A., Hawley, W. N., & Gallagher, J. S. 1993, AJ, 106, 1797
- (75)
- (76) Inoue, A. 2003, PASJ, 55, 901
- (77)
- (78) James, P. A., et al. 2004, A&A, 414, 23
- (79)
- (80) Kennicutt, R. C. 1998, ARA&A, 36, 189
- (81)
- (82) Kessler, M. F., et al. 1996, A&A, 315, L27
- (83)
- (84) Krause, M., Wielebinski, R., & Dumke, M. 2006, A&A, 448, 133
- (85)
- (86) Lagache, G., Abergel, A., Boulanger, F., & Puget, J.-L. 1998, A&A, 333, 709
- (87)
- (88) Laor, A., & Draine, B. T. 1993, ApJ, 402, 441
- (89)
- (90) Lee, J. C., Salzer, J. J., Impey, C., Thuan, T. X., & Gronwall, C. 2002, AJ, 124, 3088
- (91)
- (92) Leroy, A., Bolatto, A. D., Simon, J. D., & Blitz, L. 2005, ApJ, 625, 763
- (93)
- (94) Li, A., & Draine, B. T. 2001, ApJ, 554, 778
- (95)
- (96) Lisenfeld, U., Israel, F. P., Stil, J. M., & Sievers, A. 2002, A&A, 382, 860
- (97)
- (98) Madden, S. C., Galliiano, F., Jones, A. P., & Sauvage, M. 2005, astro-ph/0510086
- (99)
- (100) Martin, D. C., et al. 2005, ApJ, 619, L1
- (101)
- (102) Melisse, J. P. M., & Israel, F. P. 1994, A&A, 285, 51
- (103)
- (104) Misiriotis, A., Popescu, C. C., Tuffs, R., & Kylafis, N. D. 2001, A&A, 372, 775
- (105)
- (106) Osterbrock, D. E. 1989, Astrophysics of Gaseous Nebulae and Active Galactic Nuclei (Mill Valley: University Science Books)
- (107)
- (108) Patterson, R. J., & Thuan, T. X. 1996, ApJS, 107, 103
- (109)
- (110) Pérez-González, P. G., et al. 2006, submitted to ApJ
- (111)
- (112) Popescu, C. C., Misiriotis, A., Kylafis, N. D., Tuffs, R. J., & Fischera, J. 2000, A&A, 362, 138
- (113)
- (114) Popescu, C. C., Tuffs, R. J., Völk, H. J., Pierini, D., & Madore, B. F. 2002, ApJ, 567, 221
- (115)
- (116) Popescu, C. C. & Tuffs, R. J. 2003, A&A, 410, L21
- (117)
- (118) Reach, W. T., et al. 1995, ApJ, 451, 188
- (119)
- (120) Reach, W. T., Boulanger, F., Contursi, A., & Lequeux, J. 2000, A&A, 361, 895
- (121)
- (122) Reach, W. T., et al. 2005, PASP, 117, 978
- (123)
- (124) Rieke, G. H., et al. 2004, ApJS, 154, 25
- (125)
- (126) Rosenberg, J. .L., Ashby, M. L. N., Salzer, J. J., & Huang, J. 2005, astro-ph/0509566
- (127)
- (128) Salzer, J. J., et al. 2000, AJ, 120, 80
- (129)
- (130) Salzer, J. J., Rosenberg, J. L., Weisstein, E. W., Mazzarella, J. M., & Bothun, G. D. 2002, AJ, 124, 191
- (131)
- (132) Salzer, J. J., Lee, J. C., Melbourne, J., Hinz, J. L., Alonso-Herrero, A., & Jangren, A. 2005, ApJ, 624, 661
- (133)
- (134) Skillman, E. D., Televich, R. J., Kennicutt, R. C., Garnett, D. R., & Terlevich, E. 1994, ApJ, 431, 172
- (135)
- (136) Sodroski, T. J., Odegard, N., Arendt, R. G., Dwek, E., Weiland, J. L., Hauser, M. G., & Kelsall, T. 1997, ApJ, 480, 173
- (137)
- (138) Stevens, J. A., Amure, M., & Gear, W. K. 2005, MNRAS, 357, 361
- (139)
- (140) Stickel, M., Lemke, D., Klaas, U., Krause, O., & Egner, S. 2004, A&A, 422, 39
- (141)
- (142) Taylor, C. L., Kobulnicky, H. A., & Skillman, E. D. 1998, AJ, 116, 2746
- (143)
- (144) Thuan , T. X., & Martin, G. E. 1981, ApJ, 247, 823
- (145)
- (146) Thuan, T. X., Sauvage, M., & Madden, S. 1999, ApJ, 516, 783
- (147)
- (148) Tuffs, R. J., & Popescu, C. C. 2005, AIP Conf. Proc. 761: The Spectral Energy Distributions of Gas-Rich Galaxies, 761, 344
- (149)
- (150) van der Hulst, J. M. 2002, ASP Conf. Ser. 276: Seeing Through the Dust: The Detection of HI and the Exploration of the ISM in Galaxies, 276, 84
- (151)
- (152) van Zee, L. 2000, AJ, 119, 2757
- (153)
- (154) Vlahakis, C., Dunne, L., & Eales, S. 2005, MNRAS, 364, 1253
- (155)
- (156) Wegner, G., Salzer, J. J., Jangren, A., Gronwall, C., & Melbourne, J. 2003, AJ, 125, 2373
- (157)
- (158) Zavala, J., Avila-Reese, V., Hernández-Toledo, H., & Firmani, C. 2003, A&A, 412, 633
- (159)
| () | Fν (Jy) | Dust Fraction | Aperture Radius | Reference |
|---|---|---|---|---|
| (Percent) | (pixels) | |||
| 1.65 | 0.043 8.0E-3 | 0.0 | 1 | |
| 2.2 | 0.031 1.2E-2 | 0.0 | 1 | |
| 3.6 | 0.020 1.0E-3 | 20.2 | 65 | 2 |
| 4.5 | 0.016 8.0E-4 | 35.6 | 65 | 2 |
| 5.8 | 0.021 1.1E-3 | 65.0 | 65 | 2 |
| 8.0 | 0.034 1.7E-3 | 87.6 | 65 | 2 |
| 12 | 5.93E-02 | 3 | ||
| 23.68 | 0.025 2.0E-3 | 98.0 | 85 | 2 |
| 25 | 4.58E-02 | 3 | ||
| 60 | 0.45 3.6E-2 | 100.0 | 3 | |
| 71.42 | 0.55 0.11 | 100.0 | 20 | 2 |
| 100 | 1.38 0.21 | 3 | ||
| 155.9 | 2.50 0.50 | 100.0 | 15 | 2 |
| 170.0 | 2.04 0.60 | 100.0 | 4 | |
| MIPS SED Mode Data | ||||
| 55.6 | 0.14 0.03 | 100.0 | 29 | 2 |
| 64.2 | 0.17 0.02 | 100.0 | 29 | 2 |
| 72.7 | 0.19 0.03 | 100.0 | 29 | 2 |
| 81.3 | 0.20 0.02 | 100.0 | 29 | 2 |
| 89.0 | 0.30 0.06 | 100.0 | 29 | 2 |
Note. — References. — (1) de Jong & van der Kruit (1994); (2) this paper; (3) IRAS Faint Source Catalog, v2.0; (4) Stickel et al. 2004