Diffuse Light in Hickson Compact Groups: The Dynamically Young System HCG 44
Abstract
Context. Compact groups are associations of a few galaxies in which the environment plays an important role in galaxy evolution. The low group velocity dispersion favors tidal interactions and mergers, which may bring stars from galaxies to the diffuse intragroup light. Numerical simulations of galaxy clusters in hierarchical cosmologies show that the amount of the diffuse light increases with the dynamical evolution of the cluster.
Aims. We search for diffuse light in the galaxy group HCG 44 in order to determine its luminosity and luminosity fraction. Combining with literature data, we aim to constrain the dynamical status of Hickson compact groups.
Methods. We use Intra Group planetary nebulae (IGPNe) as tracers of diffuse light. These are detected by the so-called on band-off band technique.
Results. We found 12 emission line objects in HCG 44, none of them associated with the galaxies of the group. The absence of PNe in the elliptical galaxy, NGC 3193, implies that this galaxy is located behind the group, leaving only three spiral galaxy members in HCG 44. 6/12 emission line objects are consistent with being IGPNe in HCG 44, but are also consistent with being Ly background galaxies. Thus we derive an upper limit to the diffuse light fraction in HCG 44 of , corresponding to 1.06 and mean surface brightness of mag arcsec-2. We find a correlation between the fraction of elliptical galaxies and the amount of diffuse light in Hickson compact groups. Those with large fraction of diffuse light are those with large fractions in number and luminosity of E/S0 galaxies. This indicates that the diffuse light is mainly created in dynamical processes during the formation of bright elliptical galaxies in major mergers.
Conclusions. We propose an evolutionary sequence for Hickson compact groups in which the amount of diffuse light increases with the dynamical evolution of the group.
Key Words.:
Galaxies: evolution – Galaxies:clusters – Galaxies:interactions1 Introduction
The Hickson Compact Groups (HCG; Hickson 1982) are characterized by a small number of galaxies (4 to 10) and low velocity dispersion ( km s-1) in the group. They have high galaxy densities (comparable to the cores of galaxy clusters), and are located in low galaxy density environments. The combination of high galaxy density in low density environments makes them ideal laboratories to investigate the role of the environment on galaxy evolution. The stability of galaxy groups have been probed by numerical simulations (Gómez-Flechoso & Domínguez-Tenreiro 2001). Nonetheless, the question is open regarding their dynamical state. The fact that we only measure projected properties of galaxy groups may imply that these groups are not physically bound systems. Several interpretations were proposed in the literature: transient dense configurations (Rose 1977; Sargent & Turner 1972); chance alignments in loose groups (Mamon 1986, 1995; Walke & Mamon 1989); filaments seen end-on (Hernquist et al. 1995).
Galaxies in high density environments may evolve differently than in the field due to several physical mechanisms affecting their gas and/or stellar content. Ram pressure stripping (e.g., Gunn & Gott 1972; Quilis et al. 2000) or starvation (e.g., Larson, Tinsley & Caldwell 1980; Bekki et al. 2002) are mechanisms which can affect the gas content due to the interaction of the galaxies with a hot X-ray medium. On the other hand, galaxy-galaxy interactions modify the morphology of the galaxies by stripping galaxy material (gas and stars), being more efficient when galaxies have low relative velocities (e.g., Gerhard & Fall 1983; Mihos 2004). Therefore, it is likely that tidal interactions modify group galaxies, and may indicate the evolutionary state of the system. More evolved groups are expected to be those with galaxies whose morphologies are most disturbed.
The search for signs of interactions in group galaxies was driven in the past by different tracers: tidal features, HI galaxy content, and X-ray emission. Galaxy-galaxy interactions and galaxy mergers produce long tidal tails, stripping stars from galaxies which are deposited in the intragroup region, building-up the intragroup or diffuse light. Thus, the amount of the diffuse light in groups would be larger in more evolved galaxy groups. But, tidal stripping can also decrease the HI content of the galaxies in the groups. In this way, Verdes-Montenegro et al. (2001) proposed and evolutionary scenario in which the amount of HI would decrease further with evolution. The X-ray emission in some Hickson groups has been detected by the ROSAT satellite (Ebeling et al. 1994; Pildis et al. 1995a), and demonstrates that the galaxies in X-ray emitting groups are bound and interacting with a hot intragroup gas.
The presence of diffuse light in rich galaxy clusters was first suspected in Zwicky’s (1951) work on the Coma cluster. It has now been reliably detected in nearby and rich galaxy clusters in several different ways: direct detection of intracluster planetary nebulae (Theuns & Warren 1997; Arnaboldi et al. 2002, 2003, 2004; Aguerri et al. 2005; Feldmeier et al. 1998, 2003a, 2004a), detection of individual intracluster RGB stars (Ferguson et al. 1998; Durrell et al. 2002); surface brightness measurements after galaxy subtraction (Zibetti et al. 2005); detection of tidal tails around galaxies in clusters (Mihos et al. 2005; Adami et al. 2005); deep surface photometry (Feldmeier et al. 2002, 2004b). These works provide a consistent estimate that 10-20 of the light in galaxy clusters is located in the intracluster region.
Numerical simulations of galaxy cluster formation in CDM cosmology show that the origin of the diffuse light is related with the formation of bright elliptical galaxies by mergers (Murante et al., in preparation), and the fraction of ICL depends on the gravitational matter and the state of evolution of the cluster. Thus, the fraction of ICL was found to increase from 10-20 in clusters with to up to 50 for very massive clusters with (Murante et al. 2004). For a fixed mass (), Sommer-Larsen (2006) and Rudick et al. (2006) show that the fraction of ICL increases also with the degree of dynamical evolution of the clusters. Those clusters with large differences in the magnitudes of the two brightest galaxies () are evolved clusters and show the largest fraction of the diffuse light. Some of these predictions have been confirmed in the Virgo cluster where an important amount of diffuse light have been observed in regions near to the brightest cluster galaxy M87 and the subgroup formed by M84 and M86 (Aguerri et al. 2005; Mihos et al. 2005).
Little is known about the diffuse light in groups of galaxies. Pildis et al. (1995b) studied the diffuse light in 12 galaxy groups, finding that only one, HCG 94, has diffuse light in the group potential (with a luminosity of 7). In contrast, the other groups do not contain more than in diffuse light. Feldmeier et al. (2003b) and Castro-Rodriguez et al. (2003) measured the intragroup light (IGL) by searching for intragroup planetary nebulae (IGPNe) in the M81 and Leo groups, respectively. They found that at most a few percent of the light of these groups is located in the intragroup region. In contrast, White et al. (2003) found that the fraction of diffuse light in HCG 90 was 38-48. Da Rocha & de Oliveia (2005) also measured the fraction of intragroup light in three Hickson groups. They found the the IGL contributes 0-45 to the total galaxy light. The broad range in the observed diffuse light fraction was interpreted in the sense that these groups being in different states of evolution.
The aim of this paper is to study the amount of diffuse light in HCG 44 through the detection of IGPNe, to give a description of the evolutionary state of the group, and to investigate the implications of the combined data for the groups analysed so far. The paper is organized as follows: in Section 2 we present a description of the group HCG 44. The observations and data reduction are described in Section 3. The detection of IGPNe in HCG 44 is described in Section 4, and the fraction of IGL is discussed in Section 5. In Section 6 we analyze the dependence of the diffuse light fraction on the galaxy content of compact groups, and the conclusions are given in Section 7.
2 HCG 44
HCG 44 is an association of four galaxies: NGC 3190, NGC 3193, NGC 3185 and NGC 3187, located within a circle of 16.4 arcmin diameter and centered at 10:18:05, +21:48:44111The central coordinates and the angular diameter of HCG 44 were taken from Hickson (1982). The mean velocity of the galaxies in the group is 1379 km s-1, and the galaxy velocity dispersion is 219 km s-1 (Hickson et al. 1992). This implies a group distance of 18.4 Mpc, assuming km s-1 Mpc-1. The distance to the galaxies of this group was also obtained from the Tully-Fisher (TF) relation and the surface brightness fluctuations method (SBF). Williams et al. (1991) measure the TF distances of the three spiral galaxies in the group (NGC 3190, NGC 3185 and NGC 3187). They conclude that these three galaxies are at a common distance of 19 Mpc,corresponding to a distance modulus of 31.4. This distance is in good agreement with that obtained from their recessional velocities, and will be the adopted distance to the group in the present paper. Tonry et al. (2001) computed the distance modulus of the elliptical galaxy in the association, NGC 3193, using surface brightness fluctuations. They obtained a distance modulus of 32.71, corresponding a distance of 35 Mpc. Thus, this galaxy is located at a much larger distance than the three spirals and has a large peculiar velocity with respect to the Hubble flow.
These results show that HCG 44 consists of three spiral galaxies. The brightest galaxy, NGC 3190, is an almost edge on early-type spiral, showing a strong dust lane and disturbed outer isophotes. Close to NGC 3190 is located the faintest galaxy of the group, NGC 3187. This is a peculiar barred galaxy with two open arms. However, Rubin et al. (1991) proposed that NGC 3187 is not really a barred galaxy, and what we are observing are two tidal tails coming out of the plane of a spiral galaxy. They also found strange velocity patterns in these two galaxies, concluding that this is a consequence of a recent tidal interaction. This interaction is also visible in HI: Williams et al. (1991) found a faint HI bridge, connecting NGC 3190 and NGC 3187. This was the only gas detected outwards the galaxies. They conclude that HCG 44 is a dynamically young group of galaxies. The third spiral galaxy of the group, NGC 3185, does not show signs of interactions. It has a nuclear emission knot surrounded by a ring of HII regions with no H emission within. This galaxy has been reported to be a Seyfert 2 (Huchra & Burg 1992). Table 1 shows the main characteristics of the galaxies in HCG 44.
In the present study we will try to give a constraint to the evolutionary state of the group by measuring the amount of IGL in HCG 44.
3 Observations and Data Reduction
We have observed one field centered on HCG 44 at (J2000)=10:17:58, (J2000)=+21:48:44 in December 2003, using the Wide Field Camera (WFC) at the 2.5m Isaac Newton Telescope (INT) located in La Palma insland.
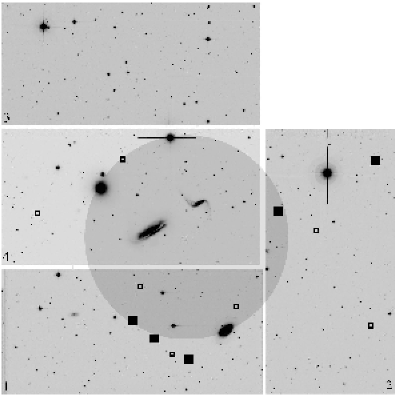
The WFC is an optical mosaic camera mounted at the prime focus of the telescope. It consists of 4 thinned EEV 2kx4k CCDs with a pixel size of 0.33”/pixel. This gives a total field of view of 3434′. The galaxy group was imaged through a B band broad filter and an [OIII] narrow band filter. The broad-band filter was centered at 4407 and had a width of 1022, and the narrow-band filter was centered at 5027 and had a width of 60 . The exposure times were 83000 s and 24600 s for the [OIII] and B band images, respectively. The images were obtained under photometric conditions and the final seeing was 1.5 arcsec in both filter. After stacking all the images the total effective area was 874.13 arcmin2. Figure 1 shows the B band image of the group.
| Name | (1950) | (1950) | V (km s-1) | B mag. |
|---|---|---|---|---|
| NGC3190 | 10:15:20.6 | +22:04:54.9 | 1293 | 11.5 |
| NGC3193 | 10:15:39.6 | +22:08:36.8 | 1378 | 11.6 |
| NGC3185 | 10:14:53.3 | +22:56:18.8 | 1218 | 12.5 |
| NGC3187 | 10:15:02.5 | +22:07:25.4 | 1579 | 13.1 |
3.1 Data reduction
The data were reduced using the mosaic IRAF tasks package MSCRED. The images were corrected by dark, bias and flat-field. In addition to the standard flat-fields, we created a superflat image combining the scientific images. Then, the images were corrected by superflat in order to correct for second order sky structures not removed by twilight flats, which are usually present in wide field images.
The calibration of the broad-band image was obtained using several Landolt fields. For the narrow-band filter spectrophotometric stars were observed. Fluxes were then normalized to the AB magnitude system, following Theuns & Warren (1997). A detailed description of the calibration steps and the relation between AB magnitudes and the “m(5007)” [OIII] magnitude introduced by Jacoby (1989) are given in Arnaboldi et al. (2002). For the filters used in the present observations, the relation between the AB magnitudes and m(5007) is given by: m(5007)=m(AB)+3.02.
3.2 PNe as traces of diffuse light in groups and clusters of galaxies
Arnaboldi et al. (1996) detected for the first time 3 PNe in the Virgo cluster with different radial velocity from that of the nearby M86 galaxy. This difference in the radial velocity pointed to the fact that these PNe were not bound to any galaxy and they were free flying in the Virgo cluster potential. This demonstrates that the diffuse light in clusters can be traced by the detection of ICPNe. This method has been used for the Fornax (Theuns & Warren 1997), several fields in the Virgo cluster (Arnaboldi et al. 2002, 2003; Aguerri et al. 2005; Feldmeier et al. 1998, 2003a, 2004a), and for several nearby galaxy groups (M81, Feldmeier et al. 2003b, and Leo, Casto-Rodríguez et al. 2003).
The detection of the ICPNe is based on the strong emission of these objects in the 5007 [OIII] line. PNe are detected using the so-called ON-OFF band technique (Jacoby et al. 1990). This observational technique requires two images of the field. One image is taken through a narrow-band filter (on-band filter) centered at the wavelength of the [OIII] emission at the redshift of galaxy group or cluster under study, and the other image is taken through a broad-band filter (off-band filter) not containing the [OIII] emission. Then, the photometric IGPN candidates are those objects detected in the on-band filter and not detected in off-band filter. They should also be point-like objects, because PNe at the distance of galaxy clusters or groups can not be resolved.
4 Selection of IGPNe candidates
Our group has developed an automatic procedure for the detection of ICPNe candidates in the Virgo cluster (see Arnaboldi et al. 2002 and Aguerri et al. 2005 for a full description of the method), which can be applied to HCG 44. This technique is based on the classification of the detected objects in the on- and off-band images according to their positions in a color-magnitude diagram (CMD). We measure the on- and off-band photometry of all objects located in the images. This was done using SExtractor (Bertin & Arnouts 1996). All objects were plotted in the CMD vs , being and the narrow and broad band magnitudes of each object, respectively. The most reliable IGPNe photometric candidates are point-like sources with no detected continuum emission and observed EW greater than 100 Å after convolution with the photometric errors as a function of magnitude (see Arnaboldi et al. 2002; Aguerri et al. 2005). We selected only objects with EW greater than 100 Å to avoid contamination from [OII] emitters at whose emission falls into the [OIII] filter for HCG 44, and we must properly take into account the photometric errors in order to avoid contamination by continuum objects (see the discussion in Arnaboldi et al. 2002 and Aguerri et al. 2005).
4.1 Simulations and limiting magnitude of the images
We run Monte Carlo simulations to optimize source detection and determine the [OIII] limiting magnitude of the image of HCG 44. We distributed several thousands point-like objects on the scientific images far away from stars or extended objects. The magnitudes of the simulated objects were randomly distributed in the range , following an exponentially increasing luminosity function (LF). We measured, for a given detection threshold, how many simulated objects were recovered in the photometry, the number of spurious objects due to noise, and the limiting [OIII] magnitude defined as the magnitude at which 50 of the simulated objects were not recovered. This process was repeated with different SExtractor detection thresholds from 0.7 to 1.3, being the RMS sky background of the image. The maximum number of simulated objects and the minimum fraction of spurious ones were detected with the 1 SExtractor detection threshold (see Arnaboldi et al. 2002 for more details about this simulations). Figure 2 shows the CMD for the objects detected in HCG 44 with 1 SExtractor detection threshold. The corresponding value of the [OIII] limiting magnitude for this detection threshold is .
The B band limiting magnitude was determined by the expression , where is the radius of the seeing disc, the rms background of the B band image, and the zero point of the image. We obtained for our broad band image. Thus, the broad band image is magnitudes deeper than the [OIII] one.
The distance to HCG 44 is 19 Mpc from TF measurements (Williams et al. 1991), therefore the distance modulus is . The brightest PNe at a distance of 19 Mpc have fluxes of 5.65 ergs s-1 cm-2 (Ciardullo et al. 2002a) or m(5007)=. When expresed in AB magnitudes, given the characteristics of our filters, this is equivalent to m(AB)=, which is brighter than our limiting magnitude. So the brightest magnitude of the PNLF is accessible to our photometry.
We found that the total number of emission line objects which fulfil or the conditions for being IGPNe in HCG 44 were 12. Table 2 gives the coordinates and magnitudes of these objects.

4.2 Background object contamination
In Aguerri et al. (2005) we carried out a detailed study of the possible background contaminants in such surveys, mainly: continuum objects and Ly background galaxies.
The selection of the candidates was based on a threshold in their [OIII] fluxes. This can produce a contamination of the sample by mis-classified faint continuum objects. In Aguerri et al. (2005) this contamination was analyzed, and it was pointed out that this contamination is negligible if the off-band image is deep enough. The difference in the limiting magnitudes between the off- and on- band images for HCG 44 is 1.5, which ensures us to be free of these contaminants. This was confirmed by simulations of point-like continuum objects, similar to Aguerri et al. (2005), which shows that we do not have faint continuum objects in our sample.
The other main contamination comes from Ly background galaxies. The Ly emission of these objects at falls near the [OIII] line at the redshift of HCG 44. We can take into account this contamination by computing the number of expected Ly objects from blank fields in which the emission line objects were detected using the same technique (Castro-Rodriguez et al. 2003; Ciardullo et al. 2002a) . Taking into account the differences in area, filters width and limiting magnitude we expect that the number of Ly in HCG 44 should be 25 and 11, respectively. This suggests that all the emission line objects detected in HCG 44 could be Ly background galaxies.

We have also compared the LF of the emission line objects detected in HCG 44, those from Ly surveys (Kudritzki et al. 2000, Ciardullo et al. 2002a; Castro-Rodriguez et al. 2003), and in one field in the Virgo cluster (LPC field) which turns out to be compatible with Ly objects only (see Aguerri et al. 2005). The result is shown in Fig. 3. It can be seen that the LF of the emission line objects detected in HCG 44 is compatible with the LF of Ly galaxies.
| Name | m(5007) | mB | ||
|---|---|---|---|---|
| HCG44-ES1 | 10:17:58.0 | +21:39:01.9 | 27.21 | 26.64 |
| HCG44-ES2 | 10:18:05.4 | +21:40:24.9 | 26.75 | 28.31 |
| HCG44-ES3 | 10:18:13.4 | +21:41:58.8 | 26.50 | 26.43 |
| HCG44-ES4 | 10:17:33.8 | +21:43:44.4 | 27.43 | 26.37 |
| HCG44-ES5 | 10:18:10.7 | +21:45:03.1 | 27.20 | 26.08 |
| HCG44-ES6 | 10:17:52.8 | +21:38:41.1 | 26.85 | 27.11 |
| HCG44-ES7 | 10:17:04.7 | +21:49:49.1 | 26.93 | 26.03 |
| HCG44-ES8 | 10:17:18.9 | +21:51:29.5 | 26.66 | 26.06 |
| HCG44-ES9 | 10:16:45.0 | +21:41:24.2 | 27.14 | 26.25 |
| HCG44-ES10 | 10:16:42.7 | +21:55:52.9 | 26.39 | |
| HCG44-ES11 | 10:18:48.2 | +21:51:06.7 | 27.39 | 28.25 |
| HCG44-ES12 | 10:18:17.1 | +21:56:02.1 | 27.30 | 28.24 |
4.3 Are there PNe candidates in individual HCG44 galaxies?
The detected emission line objects are located in the intragroup region, away from the galaxies of the group, see Fig. 1. No emission line objects were detected in those regions where the stellar contiuum from the group galaxies were also visible.
How many PNe do we expect to be associated with the HCG44 spiral galaxies? The brightest spiral galaxy, NGC 3190, in HCG44 has an absolute B magnitude , which is similar to the absolute magnitude of NGC 5886 and NGC 3351. Ciardullo et al. (2002b) carried out PNe surveys in these two spirals and the number of PNe detected in the first 0.5 mag of the PNLF is of order 10; therefore we would expect similar numbers for NGC 3190. No detection of PNe in NGC 3190 may imply that this galaxy is at a somewhat larger distance than the 19 Mpc derived from the TF relation (Williams et al. 1991). If one applied the Virgo infall model to the observed redshifts, the mean distance to NGC 3185 and NGC 3190 would then be 21.7 Mpc (Kraan-Korteweg 1986), which is slightly larger than the one inferred from the TF relation.
At the distance of 21.7 Mpc, the bright cut off of the PNe luminosity function would be at , which is 0.32 mag brighter than our limiting magnitude, and the expected number of PNe would fall by a factor . A slightly larger distance and the intrinsic dust absorption in disk galaxies, may be a likely explanation for no-PNe detected in the spiral galaxies of the HCG44 group.
One of the galaxies of the group (NGC 3193) is an elliptical. At the distance of HCG 44 the bright cut off of the PNe luminosity function (PNLF) would be at , which is 0.6 magnitudes brighter than the limiting magnitude of our images. The absolute magnitude of NGC 3193 is which corresponds to a luminosity of . This means that according to the luminosity specific PNe density (Ciardullo et al. 1989) for the M31 bulge for the first 0.5 mag of the PNLF we expect that PNe would be detectable in this elliptical galaxy given our limiting magnitude. The fact that we have not seen PNe in NGC3193 confirms that this galaxy is not at the same distance of the group, and sets a lower limit of 31.9 to its distance modulus, consistent with the Tonry et al. (2001) measurement from surface brightness fluctuations of 32.71. This implies that the bright cut-off of the PNLF of this galaxy is at which is 0.7 magnitudes fainter than our limiting magnitude. This makes impossible the detection of PNe associated with this galaxy.
5 Estimate of fraction of IGL
We have seen that the emission line objects detected in HCG 44 may be compatible with Ly background galaxies, because their luminosity function is similar to the luminosity function of Ly galaxies detected in other surveys. In the Leo group Castro-Rodriguez et al. (2003) found that the bright cut-off of the LF of the detected emission line objects was about 1.2 magnitudes fainter than the bright cut-off of the LFs from PNe associated with the galaxies of the group. They concluded therefore that the emission line objects detected in this group were all Ly background galaxies. In HCG 44 the PNLF bright cut-off at the group distance is m(5007)=26.88. Our sample have 5/12 emission line objects brighter than the PNLF bright cut-off, and 7/12 fainter. Those objects brighter than the bright cut-off of the PNLF at the group TF distance can not be PNe. The most probable explanation for them is that they are Ly background galaxies or possibly intragroup HII regions (Gerhard et al. 2002). Nonetheless, the 7 objects fainter than the bright cut-off may them be IGPNe in HCG 44. We have analyzed the position of these objects, relative to the group galaxies, and found that 5 of them were located in CCDs number 1 and 4, among the galaxies of the group, and 2 were located in CCD number 2 (see Fig. 1). One of the objects in CCD number 2 is located at a distance of 19.6 arcmin from the cluster center, more than 2 times the radius which encircle the group galaxies (see Fig 1). The other 6 objects are within 13.6 arcmin of the group center. Thus, we considered those 6 objects as possible IGPNe, and the most distant object as a Ly background object. Then, we can put an upper limit to the amount of diffuse light in HCG 44 assuming that the number of IGPNe is 6.
The amount of IGL can be inferred from the stellar light associated with the IGPNe. This can be computed considering the luminosity specific planetary nebulae density (). In Aguerri et al. (2005) we discussed the different possible values of , and used three representative values, which will be the same adopted in the present work. For HCG44 the [OIII] limiting magnitude is 0.62 magnitudes fainter than the PNLF bright cut-off at the distance of the group. This means that the brightest 0.5 magnitude of the PNLF is accessible to our photometry. Then, we will use the value of for computing the stellar light associated with the IGPNe. But, only 4/6 of the selected emission line objects as IGPNe are brighter then , being the PNLF bright cut-off. We will consider this IGPNe to compute the stellar light associated with them. One value of corresponds to that obtained for the bulge of M31 (Ciardullo et al. 1989), which is . Then, the luminosity of the IGL associated to this value in HCG44 is 1.37. The second value of results from the RGB intracluster stellar population observed in Virgo cluster by Durrell et al. (2002). For that value, the luminosity of the IGL in HCG 44 is 0.97. The third value of was taken from the -color relation discovered by Hui et al. (1993). The mean B-V of the galaxies of HCG 44 is 0.75222The V magnitudes were taken from de Vaucouleurs et al. (1991). Then, according to the -color relation of Hui et al. (1993) we have , the luminosity of the IGL is 0.85. Taking the mean of these numbers we give an upper limit of the luminosity of the IGL in HCG 44 of 1.06.
We can compare the luminosity of the IGL with the luminosity of the galaxies of HCG 44. According to their apparent B magnitudes (see Table 1) the total light from the HCG44 galaxies is 2.15333The total luminosity of the galaxies in the group was computed with NGC 3190, NGC 3185 and NGC 3187. We have assumed a distance of 19 Mpc for the three galaxies.; then the upper limit of the IGL contribution is 4.7.
We have also computed the surface brightness of the diffuse light in HCG44. The adopted area is given by the circle centered on the group center, and with a radius equal to the distance to the center of the most distant IGPNe in our sample. This corresponds to an area of 581.06 arcmin2. Thus, the resulting surface brightness of the diffuse light in HCG44 is mag arcsec-2.
The amount of intragroup light depends on the adopted distance modulus of HCG44. Williams et al. (1991) reported an error of 0.2 to the measured distance modulus of this group. When this error in the distance is taken into account, the number of possible IGPNe would be . Similar numbers are found when we considered the distance to the group to be 21.7 as inferred from the Virgo infall model to NGC 3185 and NGC 3190. The fraction of diffuse light in the group is in both cases.
6 Implications for diffuse light and dynamical evolution in Hickson Compact Groups.
Diffuse light has so far always been observed in gravitationally bound systems such as galaxy groups or clusters. Numerical simulations of galaxy clusters in hierarchical cosmologies predict that the amount of diffuse light depends directly on the cluster mass (Murante et al. 2004), and the dynamical status (Sommer-Larsen 2006; Rudick et al. 2006). Simulations also indicate that most of the diffuse light is created during interactions and major mergers resulting in the largest cluster dominant elliptical galaxies (Murante et al., in preparation). These predictions are consistent with the observations in the Virgo cluster where important amounts of diffuse light have been observed in regions near the dominant galaxy M87 and the subgroup formed by M84 and M86 (Aguerri et al. 2005; Mihos et al. 2005).
HCG 44 was catalogued by Hickson (1982) as a galaxy group formed by four members. However, SBF measurements of the elliptical galaxy, NGC 3193, showed that this galaxy is at a larger distance than the rest of the group (Tonry et al. 2001). Two of the spiral galaxies, NGC 3190 and NGC3187, show morphological distortions which indicate the interaction between them. This interaction is also visible through the faint HI bridge between the two galaxies (Williams et al. 1991). Pildis et al. (1995a) did not find an extended X-ray emission in HCG 44, Ponman et al. (1996) gave an upper limit of the X-ray emission of this group, being erg s-1. This probably means that this group does not have a deep potential well. Those results together with the low upper limit of diffuse light in HCG 44 indicate that HCG 44 is not a dynamically evolved system, or only the two spiral galaxies are group members. This would fit well in the framework of Diaferio et al. (1994) which suggests that compact groups with low or no X-ray emission and containing galaxies with signs of interactions would have formed only recently.
The fact that HCG 44 is not a dynamically evolved system opens a long posed question about the dynamical state of these galaxy associations. The Hickson (1982) catalog is based on projected galaxy properties, and a large fraction of those cataloged as compact groups may not be physically related galaxy systems or dynamically evolved systems. As mentioned before the detection of diffuse light in clusters is always associated with gravitationally bound galaxy associations, and its amount depends on the dynamical evolution of the system (Sommer-Larsen 2006; Rudick et al. 2006). Thus, the detection of diffuse light in galaxy groups can tell us about the dynamical state of the system.
Several studies of diffuse light in groups have been carried out in the past. Pilis et al. (1995b) studied the diffuse component in 12 Hickson Compact Groups. They found that only one of the groups contained a significant amount of diffuse light. Feldmeier et al. (2003b) and Castro-Rodríguez et al. (2003) searched for IGPNe in the M81 and the Leo groups, respectively. They found that a few percent of the light in these groups is located in the intragroup regions. In contrast, White et al. (2003) found that the fraction of diffuse light in HCG 90 was 38-48. Da Rocha & de Oliveira (2005) found a broad range (0-46 ) of diffuse light for three compact groups. These results indicate that only of the so far studied groups show considerable amount of diffuse light. Those that they are dynamically bound and evolved systems.
We have studied the Hickson compact groups with measurements of diffuse light in the literature (HCG 44, HCG 79, HCG 88, HCG 90, HCG 94 and HCG 95). Their diffuse light components were observed using different methods, and we briefly summarise the strategies and the results.
HGC 44- The search for diffuse light in HCG44 was carried out by the detecting IGPNe associated with the stellar light bound to the gravitational potential of the group but not to individual galaxies. The result from the current analysis is
HCG 94 - this was the only group studied by Pildis et al. (1995b) with diffuse light. They measured the diffuse light by analysing the residuals after galaxy subtraction on the images, obtaining and (see Pildis et al. 1995b). Then, the luminosity of diffuse light in this group is , representing 42 of the light in the group.
HCG 79, HCG 88 and HCG 95 - These groups were studied by Da Rocha & de Oliveira (2005) using wavelet technique. After assuming a scale for the physical extentions of group galaxies, the diffuse light is defined as any additional light which is asymmetric and/or outside galaxies. One of the groups (HCG 88) contains no diffuse light. However, the diffuse light component in HCG 79 and HCG 95 represents 46 and 11 of the total light, respectively. The mean surface brightness of the diffuse component is and mag arcsec-2 for HCG 95 and HCG 79, respectively.
HCG 90 - This last group was studied by White et al. (2003), who considered as diffuse component all the light in structures whose surface brightness is fainter than mag arcsec-2. The light in these structures amounts to 38 of the total light in the group. Given the bright surface brightness cut-off, some of the luminous structures may indeed be associated with tidal tails or plumes still bound to group galaxies. A cautionary approach may consider the amount of diffuse light reported for this group only as upper limit.

We have investigated the relation between the amount of diffuse light and their X-ray luminosity and galaxy types. No correlation was found between X-ray luminosity and amount of diffuse light, most X-ray measurements are only upper limits. However, we found a relation between the amount of diffuse light and the fraction of E/S0 galaxies (Hickson 1982; Hickson et al. 1989). Figure 4 shows this relation: the groups with the lowest fraction of diffuse light are HCG 88 and HCG 44, both of them contain no E/S0 (see Hickson 1982). HCG 95 has 11 of light as diffuse light (Da Rocha & de Oliveira 2005) and the fraction of E/S0 galaxies for this group is 0.25 (Hickson 1982). The largest amount of diffuse light were measured for HCG 79, HCG 90 and HCG 94, being: 46 (Da Rocha & de Oliveira 2005), 38-40 (White et al. 2003) and (Pildis et al. 1995b), respectively. These are the groups with the largest fraction of ellipticals: 0.75, 0.75 and 0.85 for HCG 79, HCG 90 and HCG 94, respectively. There is also a relation between the fraction of light from E/S0 galaxies in the group (see Fig. 4). Groups for which the galaxy light is dominated by E/S0 galaxies (HCG 79, HCG 90 and H94) show the largest fraction of diffuse light. We found no correlation between the amount of diffuse light and the magnitude difference between the two brightest galaxies of the group (see Fig 4), in contrast to what is claimed in the numerical simulations of diffuse light in galaxy structures (see Sommer-Larsen 2006). The results in Fig. 4 indicate that the diffuse light is created during the formation process of elliptical galaxies.
We can define an evolutionary sequence for galaxy groups according to the fraction of elliptical galaxies and the amount of diffuse light. At the beginning of this evolutionary process would be those groups with small amount of diffuse light and large fraction of spiral galaxies. The evolution of the groups would continue through interaction between the galaxies, some of which may lead to a major merger and, as a final result, an elliptical galaxy. This evolution is favored by the small velocity dispersion in galaxy groups. The evolution ending with a major merger, in the group environment, would also cause mass to be lost from galaxies by tidal processes, which is deposited in the intragroup region and forms the diffuse light. Subsequent major mergers will produce more ellipticals and more diffuse light. At the end of this evolutionary process the group would be dominated by a single large elliptical galaxy and also will contain the largest amount of diffuse light, as in the so-called fossil groups (D’Onghia et al. 2005).
7 Conclusions
We have studied the presence of IGL in the Hickson compact group HCG 44 through the detection of IGPNe, using the on-off band technique similarly as in the detection of ICPNe in the Virgo cluster. We have detected 12 emission line objects. No point-like emission line objects have been detected that are associated with the galaxies.
While the lack of detected emission line objects in the spiral galaxies of the group could be related to extinction in these objects, this is not the case for the elliptical galaxy of the group, NGC 3193. The non-detection of PNe in NGC 3193 sets a lower limit on its distance modulus, m-M=31.9. This is consistent with the SBF measurement of (Tonry et al. 2001) which places the galaxy at Mpc, far behind HCG 44. Thus HCG 44 has effectively only three galaxy members.
Of the 12 emission objects, 6 are fainter than the bright cutoff of the PNLF and are within the 13.6 arcmin radius from the center of the group. These objects are compatible with being IGPNe in HCG 44, but they are also compatible with being Ly background galaxies, based on the number density and luminosity function of these objects. Thus we determine an upper limit to the diffuse light in HCG 44 of , corresponding to a mean surface brightness of mag arcsec-2, or 4.7% of the total light of the group.
The low upper limit of IGL in HCG44 together with the non-detection of extended X-ray emission in this group, and the fact that the group contains only three spiral galaxies, all point towards the interpretation that this group is a dynamically young system. The Hickson catalogue of compact groups includes systems at different stages of their dynamical evolution. X-ray limits and diffuse light fractions from the literature indicate than only of the Hickson compact groups are likely to be dynamically evolved systems.
We have found a correlation between the fraction of elliptical galaxies and the amount of diffuse light in Hickson compact groups. Those with large fraction of diffuse light are those with large fractions in number and luminosity of E/S0 galaxies. No correlation was found between the amount of diffuse light and the difference in magnitude between the two brightest galaxies in the group. We suggest an evolutionary sequence for galaxy groups such that groups with large fraction of spirals and small amount of diffuse light are dynamically young systems, and those with large fraction of ellipticals and large amount of diffuse light are the most evolved. The correlation we found indicates that the diffuse light is mainly created in dynamical processes during the formation of bright elliptical galaxies in major mergers.
Acknowledgements.
We wish to thank to R. Kraan-Korteweg for giving us information about the Virgo infall model for the galaxies of this group. The INT telescope is operated on the island of La Palma by the ING Group in the Spanish Observatorio del Roque de Los Muchachos of the Instituto de Astrof sica de Canarias. We acknowledge the financial support to JALA and NCR by the grant AYA2004-08260. JALA wish also thank the travel support from ESO Director General Discretionary Founds 2006 during the writing process of this manuscript.References
- Adami et al. (2005) Adami, C., et al. 2005, A&A, 429, 39
- (2) Aguerri, J. A. L., Gerhard, O., Arnaboldi, M., Napolitano, N. R., Castro-Rodríguez, N., & Freeman, K. C., 2005, AJ, 129, 2585
- Arnaboldi et al. (2004) Arnaboldi, M., Gerhard, O., Aguerri, J. A. L., Freeman, K. C., Napolitano, N. R., Okamura, S., & Yasuda, N. 2004, ApJ, 614, L33
- Arnaboldi et al. (2003) Arnaboldi, M., et al. 2003, AJ, 125, 514
- Arnaboldi et al. (2002) Arnaboldi, M., et al. 2002, AJ, 123, 760
- Arnaboldi et al. (1996) Arnaboldi, M., et al. 1996, ApJ, 472, 145
- Bekki et al. (2002) Bekki, K., Couch, W. J., & Shioya, Y. 2002, ApJ, 577, 651
- Bertin & Arnouts (1996) Bertin, E., & Arnouts, S. 1996, A&AS, 117, 393
- Castro-Rodríguez et al. (2003) Castro-Rodríguez, N., Aguerri, J. A. L., Arnaboldi, M., Gerhard, O., Freeman, K. C., Napolitano, N. R., & Capaccioli, M. 2003, A&A, 405, 803
- Ciardullo et al. (2002a) Ciardullo, R., Feldmeier, J. J., Krelove, K., Jacoby, G. H., & Gronwall, C. 2002a, ApJ, 566, 784
- Ciardullo et al. (2002b) Ciardullo, R., Feldmeier, J. J., Jacoby, G. H., Kuzio de Naray, R., Laychak, M. B., & Durrell, P. R. 2002b, ApJ, 577, 31
- Ciardullo et al. (1989) Ciardullo, R., Jacoby, G. H., Ford, H. C., & Neill, J. D. 1989, ApJ, 339, 53
- Da Rocha & de Oliveira (2005) Da Rocha, C., & de Oliveira, C. M. 2005, MNRAS, 364, 1069
- de Vaucouleurs et al. (1991) de Vaucouleurs, G., de Vaucouleurs, A., Corwin, H. G., Buta, R. J., Paturel, G., & Fouque, P. 1991, Volume 1-3, XII, 2069 pp. 7 figs.. Springer-Verlag Berlin Heidelberg New York,
- Diaferio et al. (1994) Diaferio, A., Geller, M. J., & Ramella, M. 1994, AJ, 107, 868
- D’Onghia et al. (2005) D’Onghia, E., Sommer-Larsen, J., Romeo, A. D., Burkert, A., Pedersen, K., Portinari, L., & Rasmussen, J. 2005, ApJ, 630, L109
- Durrell et al. (2002) Durrell, P. R., Ciardullo, R., Feldmeier, J. J., Jacoby, G. H., & Sigurdsson, S. 2002, ApJ, 570, 119
- Ebeling et al. (1994) Ebeling, H., Voges, W., & Boehringer, H. 1994, ApJ, 436, 44
- Feldmeier et al. (2004a) Feldmeier, J. J., Ciardullo, R., Jacoby, G. H., & Durrell, P. R. 2004a, ApJ, 615, 196
- Feldmeier et al. (2004b) Feldmeier, J. J., Mihos, J. C., Morrison, H. L., Harding, P., Kaib, N., & Dubinski, J. 2004a, ApJ, 609, 617
- Feldmeier et al. (2003a) Feldmeier, J. J., Ciardullo, R., Jacoby, G. H., & Durrell, P. R. 2003a, ApJS, 145, 65
- Feldmeier et al. (2003b) Feldmeier, J. J., Durrell, P. R., Ciardullo, R., & Jacoby, G. H. 2003b, IAU Symposium, 209, 605
- Feldmeier et al. (2002) Feldmeier, J. J., Mihos, J. C., Morrison, H. L., Rodney, S. A., & Harding, P. 2002, ApJ, 575, 779
- Feldmeier et al. (1998) Feldmeier, J. J., Ciardullo, R., & Jacoby, G. H. 1998, ApJ, 503, 109
- Ferguson et al. (1998) Ferguson, H. C., Tanvir, N. R., & von Hippel, T. 1998, Nature, 391, 461
- Gerhard et al. (2002) Gerhard, O., Arnaboldi, M., Freeman, K. C., & Okamura, S. 2002, ApJ, 580, L121
- Gerhard & Fall (1983) Gerhard, O. E., & Fall, S. M. 1983, MNRAS, 203, 1253
- Gómez-Flechoso & Domínguez-Tenreiro (2001) Gómez-Flechoso, M. A., & Domínguez-Tenreiro, R. 2001, ApJ, 549, L187
- Gunn & Gott (1972) Gunn, J. E., & Gott, J. R. I. 1972, ApJ, 176, 1
- Hernquist et al. (1995) Hernquist, L., Katz, N., & Weinberg, D. H. 1995, ApJ, 442, 57
- Hickson et al. (1992) Hickson, P., Mendes de Oliveira, C., Huchra, J. P., & Palumbo, G. G. 1992, ApJ, 399, 353
- Hickson et al. (1989) Hickson, P., Kindl, E., & Auman, J. R. 1989, ApJS, 70, 687
- Hickson (1982) Hickson, P. 1982, ApJ, 255, 382
- Huchra & Burg (1992) Huchra, J., & Burg, R. 1992, ApJ, 393, 90
- Hui et al. (1993) Hui, X., Ford, H. C., Ciardullo, R., & Jacoby, G. H. 1993, ApJ, 414, 463
- Jacoby et al. (1990) Jacoby, G. H., Ciardullo, R., & Ford, H. C. 1990, ApJ, 356, 332
- Jacoby (1989) Jacoby, G. H. 1989, ApJ, 339, 39
- Kraan-Korteweg (1986) Kraan-Korteweg, R. C. 1986, A&AS, 66, 255
- Kudritzki et al. (2000) Kudritzki, R.-P., et al. 2000, ApJ, 536, 19
- Larson et al. (1980) Larson, R. B., Tinsley, B. M., & Caldwell, C. N. 1980, ApJ, 237, 692
- Mamon (1995) Mamon, G. A. 1995, Astronomical Society of the Pacific Conference Series, 70, 83
- Mamon (1986) Mamon, G. A. 1986, ApJ, 307, 426
- Mihos (2005) Mihos, J. C., Harding, P., Feldmeier, J., & Morrison, H., 2005, 631, L41
- Mihos (2004) Mihos, J. C. 2004, Clusters of Galaxies: Probes of Cosmological Structure and Galaxy Evolution, 278
- Murante et al. (2004) Murante, G., et al. 2004, ApJ, 607, L83
- Pildis et al. (1995) Pildis, R. A., Bregman, J. N., & Evrard, A. E. 1995a, ApJ, 443, 514
- Pildis et al. (1995) Pildis, R. A., Bregman, J. N., & Schombert, J. M. 1995b, AJ, 110, 1498
- Ponman et al. (1996) Ponman, T. J., Bourner, P. D. J., Ebeling, H., & Bohringer, H. 1996, MNRAS, 283, 690
- Quilis et al. (2000) Quilis, V., Moore, B., & Bower, R. 2000, Science, 288, 1617
- Rose (1977) Rose, J. A. 1977, ApJ, 211, 311
- Rubin et al. (1991) Rubin, V. C., Hunter, D. A., & Ford, W. K. J. 1991, ApJS, 76, 153
- (52) Rudick, C. S., Mihos, J. C., & McBrick, C., 2006, astro-ph/0605603
- (53) Sargent, W. L. W. & Turner, E. L. 1972, in Ann. Rept. Director Hale Observatories, 1972-1973, 123.
- Sommer-Larsen (2006) Sommer-Larsen, J. 2006, MNRAS, 509
- Theuns & Warren (1997) Theuns, T., & Warren, S. J. 1997, MNRAS, 284, L11
- Tonry et al. (2001) Tonry, J. L., Dressler, A., Blakeslee, J. P., Ajhar, E. A., Fletcher, A. B., Luppino, G. A., Metzger, M. R., & Moore, C. B. 2001, ApJ, 546, 681
- Verdes-Montenegro et al. (2001) Verdes-Montenegro, L., Yun, M. S., Williams, B. A., Huchtmeier, W. K., Del Olmo, A., & Perea, J. 2001, A&A, 377, 812
- Walke & Mamon (1989) Walke, D. G., & Mamon, G. A. 1989, A&A, 225, 291
- White et al. (2003) White, P. M., Bothun, G., Guerrero, M. A., West, M. J., & Barkhouse, W. A. 2003, ApJ, 585, 739
- Williams et al. (1991) Williams, B. A., McMahon, P. M., & van Gorkom, J. H. 1991, AJ, 101, 1957
- Zibetti et al. (2005) Zibetti, S., White, S. D. M., Schneider, D. P., & Brinkmann, J. 2005, MNRAS, 358, 949
- Zwicky (1951) Zwicky, F. 1951, PASP, 63, 61