Simultaneous radio-interferometric and high-energy TeV observations of the -ray blazar Mkn 421
The TeV-emitting BL Lac object Mkn 421 was observed with very long baseline interferometry (VLBI) at three closely-spaced epochs one-month apart in March–April 1998. The source was also monitored at very-high -ray energies (TeV measurements) during the same period in an attempt to search for correlations between TeV variability and the evolution of the radio morphology on parsec scales. While the VLBI maps show no temporal changes in the Mkn 421 VLBI jet, there is strong evidence of complex variability in both the total and polarized fluxes of the VLBI core of Mkn 421 and in its spectrum over the two-month span of our data. The high-energy measurements indicate that the overall TeV activity of the source was rising during this period, with a -ray flare detected just three days prior to our second VLBI observing run. Although no firm correlation can be established, our data suggest that the two phenomena (TeV activity and VLBI core variability) are connected, with the VLBI core at 22 GHz being the self-absorbed radio counterpart of synchrotron self-Compton (SSC) emission at high energies. Based on the size of the VLBI core, we could derive an upper limit of 0.1 pc ( cm) for the projected size of the SSC zone. This determination is the first model-free estimate of the size of the -ray emitting region in a blazar.
Key Words.:
Galaxies: active – Galaxies: jets – BL Lacertae objects: individual: Mkn 421 – Radio continuum: galaxies – Techniques: high angular resolution – Gamma rays: observations1 Introduction
Among active galactic nuclei (AGN), BL Lac objects form a class of sources characterized by high radio and optical variability, dominance of continuum over line emission, and strong and variable polarization. Such extreme properties have already suggested long ago that substantial relativistic beaming most probably occurs in this type of source (Blandford & Rees 1978; Blandford & Königl 1979). This idea was confirmed by direct detection of apparent superluminal motion in the radio jets of many BL Lac objects based on high-resolution imaging with the very long baseline interferometry (VLBI) technique (Phillips & Mutel 1982; Witzel et al. 1988; Gabuzda et al. 1989; Mutel et al. 1990; Gabuzda et al. 2000). Building on these findings, AGN unification schemes have emerged, all basically describing BL Lac objects as radio-loud AGN with relativistic jets pointing within a small angle towards the observer (Urry & Padovani 1995; Falcke et al. 1995; Gopal-Krishna 1995; Kollgaard et al. 1996; Georganopoulos & Marscher 1998; Ghisellini et al. 1998; Fossati et al. 1998; Sambruna et al. 2000; Bai & Lee 2001).
In the past decade, more evidence of relativistic beaming came from high-energy X-ray and -ray data, which revealed intense fluxes and strong variability up to the TeV level, especially in the two nearby BL Lac objects Mkn 421 and Mkn 501 (Punch et al. 1992; Quinn et al. 1996). In the case of Mkn 421, very high relativistic Doppler factors (between 10 and 15) are demanded in order to reproduce the dramatic rapid flares that have been observed on timescales as short as 30 min (Gaidos et al. 1996; Coppi 1997; Celotti et al. 1998; Cui 2004; Aharonian et al. 2005). Similar or even higher Doppler factors (in the range 20–50) are also obtained when fitting basic synchrotron self-Compton models to the broadband spectrum of Mkn 421 (Maraschi et al. 1999; Takahashi et al. 2000; Krawczynski et al. 2001; Konopelko et al. 2003; Katarzynski et al. 2003).
The VLBI observations have sought evidence of superluminal motion in Mkn 421 ever since the early 1980’s. A first series of VLBI maps at 5 GHz reported apparent motions of about 2c and an angle to the line of sight of for the parsec-scale jet (Bååth et al. 1981; Bååth 1984; Zhang & Bååth 1990). On the other hand, the source was found to be unresolved at high frequency with a core size of 0.15 milliarcsecond (mas) at 22 GHz (Zhang & Bååth 1991). In the 1990’s, the improved performances of the VLBI technique permitted the detection of a weak one-sided jet (Polatidis et al. 1995; Xu et al. 1995; Edwards et al. 1998; Kellermann et al. 1998; Giovannini et al. 1999). This jet shows wiggles starting at about 5 mas from the core, as well as strong distortions at a distance of 20 mas from the core. Based on these data, Giovannini et al. (1999) derived a viewing angle smaller than and an apparent jet speed between 0.8c and 1c. While faster speeds (2c) were reported, invoking possible earlier misidentification of several rapidly-evolving VLBI components (Marscher 1996, 1999), another analysis based on a dense time coverage (15 observing epochs over 3 years) confirmed the existence of only subluminal apparent motion (c), therefore implying a very small viewing angle to the line of sight of for the VLBI jet (Piner et al. 1999). This analysis has recently been refined with an extended data span (28 epochs over 8 years), leading to a revised apparent speed of only c for the fastest VLBI jet component (Piner & Edwards 2005). While this value is smaller than the value found by Kellermann et al. (2004), who reported an average component speed of c from 15 GHz monitoring over 6 years, the two results do rule out the existence of superluminal motion in the Mkn 421 jet. Interestingly, Mkn 421 is not a unique case and such low apparent speeds have been found in the other TeV blazars as well (Piner & Edwards 2004).
The apparent inconsistency between the low degree of relativistic beaming derived from the VLBI observations of TeV blazars and the high value predicted by the theory may be explained if the Doppler factor decreases along the jet as a result of either jet curvature or jet deceleration (Georganopoulos & Kazanas 2003; Ghisellini et al. 2005). It is also possible that the measured VLBI jet speed does not correspond to the speed of the actual underlying jet but instead to the speed of a perturbed pattern along the jet (Zensus 1997). In this case, the radio core may still be efficiently boosted although there would be no evidence for relativistic beaming from apparent motions in the VLBI jet. Nevertheless, one would expect correlations between radio core properties and high-energy events if this hypothesis is correct. One indication of the existence of these correlations comes from the apparent connection between the epoch of emergence of new VLBI components and the occurrence of strong X-ray and -ray flares in several -ray emitting AGN (Wehrle et al. 1993; Pohl et al. 1995; Unwin et al. 1997; Otterbein et al. 1998; Britzen et al. 1998; Bower 1998; Krichbaum et al. 1998; Wehrle 1999; Marchenko et al. 2000). Furthermore, it appears that the -ray flares detected by the EGRET detector onboard the Compton Gamma-Ray Observatory seem to occur during the rising phase of high-frequency radio outbursts, again suggesting a possible connection between radio and high-energy properties (Valtaoja et al. 1996; Valtaoja & Teräsranta 1996; Lähteenmäki et al. 2000). This is especially true for Mkn 421, which occasionally shows multi-spectral flares (from radio to TeV energies), as reported by Katarzynski et al. (2003). Searching for additional clues along these lines with new multi-frequency data is important for investigating whether TeV blazars are indeed strongly-beamed sources, as presumed so far.
This paper reports multi-frequency VLBI maps of Mkn 421 obtained at three closely-spaced epochs (one month apart) in 1998. These observations were arranged during regular monitoring of the source at very-high -ray energy (TeV level) by the CAT Cherenkov imaging telescope. In the following sections, we present results of the VLBI and TeV observations, discuss the variability of the source, and investigate possible connections between VLBI properties and TeV activity. We also derive an upper limit for the projected size of the -ray emission region based on the size of the compact radio core as measured from our high-resolution VLBI data.
2 Observations and data reduction
2.1 VLBI observations
Multi-frequency (5.0 GHz, 8.4 GHz, 15.4 GHz, 22.2 GHz) polarization-sensitive VLBI observations of Mkn 421 were carried out at three epochs on March 4, March 28, and April 26, 1998, using the Very Long Baseline Array (VLBA) telescope (Napier et al. 1994) of the National Radio Astronomy Observatory (NRAO)111NRAO is operated by Associated Universities, Inc., under cooperative agreement with the National Science Foundation.. Dual-polarization (LCP and RCP) and two intermediate frequency channels (IFs), each 8 MHz wide, were recorded simultaneously at each band with scans of 3 min at 5 GHz and 8 GHz, 5 min at 15 GHz, and 6 min at 22 GHz. Mkn 421 was observed alternately with another TeV-emitting source (Mkn 501) at each of the four frequencies, along with interleaved calibrators for amplitude and polarization calibration. The total observing time for Mkn 421 was roughly 0.7 hr at 5 GHz and 8 GHz, 1.2 hr at 15 GHz, and 1.4 hr at 22 GHz.
The raw data were correlated with the VLBA correlator at the Array Operations Center in Socorro, New Mexico, and calibrated with the NRAO Astronomical Image Processing System in the standard way (Ulvestad 2000). The initial amplitude calibration for each of the IFs and polarizations was accomplished using system temperature measurements taken during the observations and NRAO-supplied gain curves. The instrumental polarizations for each antenna were determined from observations of the unpolarized source OQ208 (1404286), while the absolute polarization position angles were calibrated using observations of the compact polarized source 1823568. For each epoch and frequency, the initial polarization position angles have been rotated so that those for 1823568 match the integrated values reported in the University of Michigan Radio Astronomy Observatory data base222see http://www.astro.lsa.umich.edu/obs/radiotel/umrao.html for our observing epochs. The rotation values derived with this scheme (equivalent to the R–L phase differences of the reference antenna) were found to agree within for the data of March 4, 1998, and April 26, 1998, at all four frequencies. This is expected if the R–L phase differences of the receivers are stable over this timescale; in fact, the stability of this phase difference has been demonstrated for the VLBA antennas on timescales as long as two years (Reynolds et al. 2001). It was intriguing, though, that the rotation values derived for the data of the intermediate epoch (March 28, 1998) were inconsistent with these two sets of values. A closer look at our calibrator data for March 28, 1998, revealed afterwards that these data are indeed suspicious, probably because the polarization properties of 1823568 varied over the 12-hour span of our observations. Therefore, we calibrated the absolute orientation of the polarized position angles for the data of March 28, 1998, using the mean of the rotation values determined for the other two epochs.
The calibrated visibility data of Mkn 421 for each frequency band were processed using the Brandeis software to produce hybrid maps of the distribution of the total intensity and linear polarization 333, where is the polarized intensity, is the fractional linear polarization, and is the position angle of the electric vector on the sky.. Maps of the linear polarization were made by referencing the calibrated cross-hand fringes to the parallel-hand fringes using the antenna gains determined in the hybrid-mapping procedure, then Fourier-transforming the cross-hand fringes, and CLEANing. One by-product of this procedure is to register the and maps to within a small fraction of the beamwidth, so that corresponding and images may be directly superimposed. Subsequent to imaging, circular Gaussian models were fitted to the self-calibrated visibility data using a non-linear least-squares algorithm implemented in the Brandeis software. Such models are useful for estimating the spectrum of the individual VLBI components and for tracking temporal changes in the source structure, as discussed below.
2.2 TeV measurements
Very-high -ray energy measurements on Mkn 421 were obtained using the ground-based Cherenkov telescope CAT (“Cherenkov Array at Thémis”) located in the French Pyrénées. This telescope, which has a reflector area of 17.8 and a very high-definition camera with 546 pixels of , detects the Cherenkov light emitted by secondary particles resulting from cascades of primary high-energy rays and cosmic rays in the atmosphere (Barrau et al. 1998). In this technique, air showers induced by rays are efficiently separated from the background of cosmic-ray showers by the shape and direction of their images (Le Bohec et al. 1998). The energy threshold of about GeV at zenith is achieved by using fast photo-tubes and fast coincidence electronics, with an integration time of 12 ns matching the short-lived Cherenkov flashes.
Mkn 421 was the first extragalactic source detected at the TeV level (Punch et al. 1992), soon after its identification as a -ray source by EGRET in 1992 (Lin et al. 1992). Monitoring by CAT was conducted from December 1996 (when this telescope began operating) until June 2003 (when it ceased operations). During this period, Mkn 421 was observed each year from November to June (when the source is visible during night time at the CAT site) for about two weeks per month (centered on the new Moon) within technical and weather constraints. A detailed description of the -ray signal extraction and data analysis is given in Piron et al. (2001). Light curves have been produced for the integral flux above 250 GeV by assuming a differential -ray spectrum index of representative of all available spectral measurements for Mkn 421.
3 Observational results
3.1 VLBI morphology and variability
In order to provide an overview of our results in compact form, we present our images of Mkn 421 at all four frequencies and all three epochs in Figs. 1 and 2. The image parameters are listed in Table 1. The total-intensity morphology in our images is very similar to that observed in previously published maps at these frequencies, such as in the large series of images presented by Piner et al. (1999) and Piner & Edwards (2005). We identify the core and the three long-lived jet components C6, C5, and C4 first detected by Piner et al. (1999). The latest epoch of Piner et al. (1999) was in December 1997, only three months before our observations, and the cross-identification between our components and theirs is straightforward. Accordingly, we have retained this naming convention for ease of comparison. The additional 5 GHz component labeled C0 is a combination of components C3, C2, and C1 from Piner et al. (1999).


| Beam444The restoring beam is an elliptical Gaussian with FWHM major axis and minor axis , with the major axis in position angle (measured from North through East). | Total-intensity maps | Polarized-intensity maps | |||||||||
| Frequency | Epoch | a | b | Peak | Lowest contour555Successive contour levels are each a factor of the square root of two higher. | Peak | Lowest contourb | ||||
| (GHz) | (mas) | (mas) | (∘) | (mJy/beam) | ( of peak) | (mJy/beam) | ( of peak) | ||||
| 5.0 | 1 | 2.93 | 1.92 | 357 | 0.18 | 3.98 | |||||
| 2 | 2.93 | 2.08 | 324 | 0.25 | 5.95 | ||||||
| 3 | 2.89 | 1.77 | 317 | 0.25 | 1.46 | ||||||
| 8.4 | 1 | 1.76 | 1.15 | 358 | 0.18 | 4.54 | |||||
| 2 | 1.79 | 1.17 | 308 | 0.25 | 4.29 | ||||||
| 3 | 1.63 | 1.07 | 315 | 0.25 | 4.21 | ||||||
| 15.4 | 1 | 1.00 | 0.67 | 325 | 0.35 | 6.07 | |||||
| 2 | 0.95 | 0.63 | 296 | 0.50 | 7.92 | ||||||
| 3 | 0.92 | 0.58 | 295 | 0.35 | 4.72 | ||||||
| 22.2 | 1 | 0.72 | 0.46 | 249 | 0.50 | 5.53 | |||||
| 2 | 0.82 | 0.49 | 255 | 0.71 | 4.18 | ||||||
| 3 | 0.69 | 0.40 | 231 | 0.71 | 4.41 | ||||||
As noted above, in order to derive a description of the source structure that could be used to quantitatively compare our results at the different frequencies and epochs, we obtained circular Gaussian model fits to all the calibrated and visibility data. The resulting Gaussian model components are presented in Table 2. The errors reported in this table are our best error estimates, as derived by examining the variations when forcing changes in the individual model components (errors of correspond to an increase in the best-fit by unity). In some cases these errors appear reasonable, but in some other cases they clearly underestimate the true errors. For example, reasonable errors in the separation from the core are probably no less than about 1/20th of the beam size (about 0.08, 0.06, 0.03, and 0.02 mas at 5, 8, 15, and 22 GHz, respectively), which is larger than the errors reported for C6 and C5 in Table 2, especially at the lowest frequencies (5 and 8 GHz).
| Component666The components fitted to the complex visibility data are of circular Gaussian form with FWHM axis , total intensity , and polarized intensity . They are separated from the (arbitrary) origin of the image by an amount in position angle , which is the position angle (measured from North through East) of a line joining the components with the origin. The direction of the electric vector on the sky is given for each component by its position angle (measured from North through East). | Epoch | |||||||||||
| (mas) | () | (mJy) | (mJy) | () | (mas) | |||||||
| 5 GHz | ||||||||||||
| Core | 1 | — | — | — | — | 316.6 | 0.6 | 3.2 | 0.5 | 2.4 | 0.24 | |
| 2 | — | — | — | — | 288.7 | 0.6 | 0.5 | 1.0 | 10.0 | 0.23 | ||
| 3 | — | — | — | — | 260.4 | 0.8 | 1.6 | 0.5 | 10.4 | 0.14 | ||
| C6 | 1 | 0.86 | 0.01 | 0.7 | 57.0 | 0.6 | 4.5777Combinations of polarizations for C6C5. | 0.5 | 2.4 | 0.32 | ||
| 2 | 0.96 | 0.01 | 0.4 | 50.5 | 1.2 | 5.3b | 0.6 | 1.3 | 0.35 | |||
| 3 | 0.80 | 0.01 | 0.9 | 68.0 | 1.6 | — | — | — | — | 0.05 | ||
| C5 | 1 | 1.98 | 0.03 | 0.8 | 20.6 | 0.8 | 0.73 | |||||
| 2 | 2.10 | 0.02 | 0.7 | 15.6 | 0.4 | 0.79 | ||||||
| 3 | 1.94 | 0.02 | 0.7 | 22.0 | 1.8 | — | — | — | — | 0.57 | ||
| C4 | 1 | 5.39 | 0.05 | 0.6 | 24.4 | 0.8 | 4.2 | 0.5 | 5.6 | 2.36 | ||
| 2 | 5.36 | 0.08 | 0.7 | 23.7 | 0.6 | 4.0 | 0.8 | 2.8 | 2.47 | |||
| 3 | 5.28 | 0.08 | 0.8 | 25.5 | 0.8 | — | — | — | — | 2.68 | ||
| C0 | 1 | 14.78 | 0.54 | 2.1 | 22.7 | 1.4 | — | — | — | — | 11.51 | |
| 2 | 15.91 | 0.52 | 1.9 | 26.6 | 2.0 | — | — | — | — | 12.50 | ||
| 3 | 15.57 | 0.49 | 1.8 | 22.6 | 3.2 | — | — | — | — | 10.93 | ||
| 8 GHz | ||||||||||||
| Core | 1 | — | — | — | — | 343.0 | 2.4 | 5.5 | 0.9 | 2.8 | 0.16 | |
| 2 | — | — | — | — | 283.9 | 1.0 | 3.3 | 1.0 | 3.3 | 0.15 | ||
| 3 | — | — | — | — | 275.5 | 1.0 | 3.7 | 0.7 | 4.4 | 0.13 | ||
| C6 | 1 | 0.81 | 0.01 | 0.6 | 34.9 | 1.8 | 2.0 | 0.8 | 3.5 | 0.09 | ||
| 2 | 0.68 | 0.01 | 0.5 | 38.1 | 1.4 | 2.2 | 1.0 | 5.4 | 0.19 | |||
| 3 | 0.50 | 0.01 | 0.8 | 54.3 | 1.2 | 1.7 | 0.5 | 5.6 | 0.19 | |||
| C5 | 1 | 1.57 | 0.02 | 0.6 | 21.8 | 1.2 | 3.9 | 0.8 | 2.4 | 0.38 | ||
| 2 | 1.57 | 0.01 | 0.5 | 21.2 | 1.0 | 3.1 | 1.1 | 2.8 | 0.39 | |||
| 3 | 1.50 | 0.01 | 0.5 | 26.9 | 1.2 | 3.0 | 1.4 | 4.3 | 0.52 | |||
| C4 | 1 | 5.62 | 0.12 | 1.2 | 21.8 | 1.0 | 2.5 | 1.2 | 5.6 | 2.70 | ||
| 2 | 5.37 | 0.08 | 0.8 | 24.0 | 1.2 | 3.3 | 0.8 | 4.4 | 3.47 | |||
| 3 | 5.89 | 0.10 | 1.0 | 23.7 | 1.8 | 3.2 | 1.3 | 6.0 | 3.04 | |||
| 15 GHz | ||||||||||||
| Core | 1 | — | — | — | — | 334.0 | 3.6 | 6.0 | 1.5 | 4.2 | 0.16 | |
| 2 | — | — | — | — | 304.1 | 1.2 | 7.9 | 1.6 | 3.1 | 0.16 | ||
| 3 | — | — | — | — | 306.1 | 1.2 | 5.3 | 0.5 | 4.4 | 0.16 | ||
| C6 | 1 | 0.78 | 0.02 | 2.9 | 31.3 | 3.0 | 1.2 | 2.1 | 13.6 | 0.10 | ||
| 2 | 0.65 | 0.01 | 0.9 | 17.6 | 1.8 | 3.2 | 1.2 | 5.2 | 0.14 | |||
| 3 | 0.55 | 0.01 | 1.1 | 19.2 | 3.0 | — | — | — | — | 0.10 | ||
| C5 | 1 | 1.49 | 0.06 | 2.3 | 13.9 | 2.0 | 2.5 | 1.8 | 10.2 | 0.63 | ||
| 2 | 1.37 | 0.02 | 0.6 | 26.8 | 1.2 | 2.7 | 1.9 | 6.7 | 0.66 | |||
| 3 | 1.36 | 0.03 | 1.4 | 20.7 | 6.2 | — | — | — | — | 0.63 | ||
| 22 GHz | ||||||||||||
| Core | 1 | — | — | — | — | 280.5 | 4.6 | 5.5 | 1.4 | 6.6 | 0.19 | |
| 2 | — | — | — | — | 276.6 | 2.0 | 5.3 | 1.9 | 6.7 | 0.16 | ||
| 3 | — | — | — | — | 242.3 | 2.4 | 4.5 | 1.2 | 6.7 | 0.12 | ||
| C6 | 1 | 0.74 | 0.02 | 1.7 | 30.4 | 1.0 | — | — | — | — | 0.66 | |
| 2 | 0.85 | 0.04 | 3.0 | 27.5 | 1.8 | — | — | — | — | 0.63 | ||
| 3 | 0.72 | 0.05 | 6.7 | 23.0 | 2.2 | — | — | — | — | 0.81 | ||
Piner & Edwards (2005) conclude that the jet components C4, C5, and C6 were present over the entire time range spanned by their observations (from 1994 to 2002) and that they showed at most subluminal speeds of expansion from the VLBI core (linear least-squares-fit speeds of c for C4, c for C5, and c for C6). Our images are consistent with these results, and show no evidence of systematic motions in the locations of any of these jet components over the two-month time interval covered by our observations. Thus, our data exclude the possibility that the source structure actually evolves much more rapidly than deduced so far, but that the time intervals between previous VLBI images were too small to track the jet-component evolution.
Our measurements in Table 2 also do not show any conclusive evidence of variability in the fluxes or polarizations of the jet components over our three epochs, except for possible mild changes at the level of 10–20 mJy in the total flux of the jet component C6. In contrast, we have a strong indication of variability in both the total flux and the polarized flux of the VLBI core at all four frequencies over the roughly two months covered by our three epochs. In particular, the total flux of the core decreased by 30–70 mJy (corresponding to a change of 10–20%) between March 4 and April 26 at all four frequencies, and this decrease was accompanied by a rotation of the core polarization angle by 30–60∘ at all frequencies except 5 GHz (see Table 2). Although the core was relatively constant at 5 GHz, the corresponding core polarized flux was probably variable. These variations are discussed in more detail below.
3.2 TeV variability
An extensive study of the CAT measurements acquired on Mkn 421 between 1996 and 2000 is found in Piron et al. (2001). As reported in this paper, the level of the TeV emission for Mkn 421 changed significantly from year to year. While at a low level in 1996–1997 (mean flux above 250 GeV: ), it was more than twice as high the next year, when our VLBI maps were obtained ( in 1997–1998). Later on, the very-high-energy emission decreased to a level comparable to that of 1996–1997 ( in 1998–1999), whereas intense activity started again in January 2000.
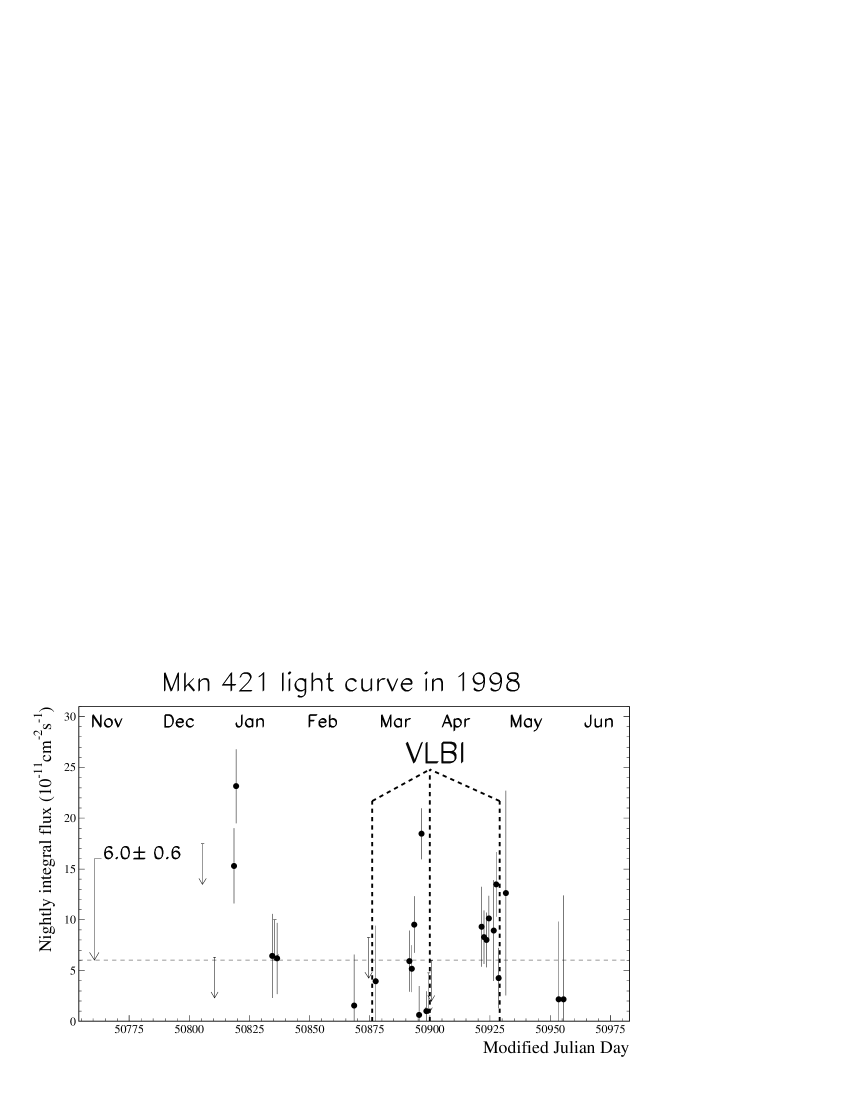
The nightly-averaged integral flux above 250 GeV obtained by CAT between December 1997 and May 1998 is plotted in Fig. 3. Also indicated in this figure are the epochs of our three VLBI observing runs. The most striking features in the light curve are the two -ray flares detected in January and March 1998, the second of which occurred on March 25, just three days prior to our second VLBI run (Fig. 4). Additionally, the overall TeV activity seems to show a regular increase from the first to third VLBI observing epochs, although such a trend is difficult to establish because of the sparseness of the TeV data, especially near the first VLBI run (due to poor weather conditions). Most noticeably, the level of the TeV emission near our third VLBI observing epoch (April 26) is significantly higher than the mean TeV flux value for the campaign (materialized by the horizontal dashed-line in Fig. 3), while that near our second VLBI run (March 28) is roughly at the same level.
4 Discussion
4.1 Variability of the VLBI core
As noted previously, both the total flux and the polarization characteristics of the VLBI core were variable in the time spanned by our observations. In this section, we first discuss the variability in the total flux and its frequency dependence and then examine the variability of the polarization flux and position angle based on the model-fitting results in Table 2.
Figure 5 presents the spectra of the core and the jet components C6, C5, and C4. The core and C6 were detected at all four frequencies, while C5 and C4 were detected only at the lowest frequencies (5, 8, and 15 GHz for C5; 5 and 8 GHz for C4). The fluxes for C5 and for C4 at the three different epochs all agree within about 10 mJy or less and show no indication of variability. Those for C6 show differences up to 20 mJy, especially at 5 and 8 GHz between our last two epochs. However, we cannot say for sure whether these are real or due to systematic deviations in the flux estimates. Overall, there is no convincing evidence of variability in the jet-component fluxes. The spectrum of C6 is consistent with this component being optically thin throughout the range of frequencies we have observed (spectral index of about ), as is expected for jet emission. The spectra of C5 and C4 instead appear to be flatter (spectral index of about 0.0 for C5 and for C4).
In contrast, the core total flux is appreciably variable when compared to the constancy of the flux densities of the jet components C6, C5, and C4. As shown in Fig. 5, the core flux density decreases at all four frequencies from our first to our third epochs. The total changes are 56, 68, 28, and 38 mJy at 5, 8, 15, and 22 GHz, which are clearly significant, even if some of the core flux errors are underestimated. The decrease in the core flux is seen at each frequency, arguing against the possibility that it is due to calibration errors, since the data for each frequency were calibrated independently. In addition, if the flux density decrease were associated with calibration errors, we might expect it to be more prominent at the higher frequencies, while the opposite is true. Figure 5 also shows that the spectrum of the core varies as the flux density decreases. The core spectrum at our first epoch (March 4, 1998) has a maximum near 8 GHz and is presumably self-absorbed at lower frequencies. The spectrum at our second epoch three weeks later (March 28, 1998) is complex, but roughly speaking has become flatter. The core spectrum at our third epoch (April 26, 1998) is instead similar to the peaked spectrum observed at our first epoch, though the flux density at 15 GHz is somewhat higher than we would expect in this case. Thus, it seems that the core spectrum first became flatter, then started to change toward becoming peaked again, with an overall flux density level appreciably below its initial level on March 4, 1998 (our first epoch).
There is also some evidence from our data that the polarized flux of the core may have been variable at 5 and 8 GHz, though it is difficult to be sure of this given the corresponding errors. Figure 6 plots the polarized fluxes of the core and the jet components C6, C5, and C4 for the three successive epochs. As in the previous case, the jet components were detected only at the lowest frequencies (5, 8, and 15 GHz for C6; 8 and 15 GHz for C5; 5 and 8 GHz for C4). The core polarization was clearly detected at 5 GHz at our first epoch (estimated flux of mJy), together with polarized flux associated with the jet components C6 and C4; however, the core polarization was not detected above the noise level at our second epoch (estimated flux of mJy), though the polarizations from the jet components C6 and C4 were detected and were equal to their values at our first epoch to within the errors (see Fig. 6). The core polarization was only weakly detected at 5 GHz at our third epoch (estimated flux of mJy). Overall, the fractional core polarization over the three epochs is 1% at most, which is half of that measured by Pollack et al. (2003) in a 5 GHz image from December 2000. The 8 GHz measurements suggest that the core polarized flux also decreased at this frequency between our first two epochs, but formally the decrease does not exceed the error estimates (difference of ). At 15 and 22 GHz, the uncertainties are too large to draw any firm conclusion about the core variability, even though the core polarized flux appears to be somewhat weaker at the third epoch than at the first epoch. The fractional core polarization at these frequencies is about 2% and is consistent with that measured by Marscher et al. (2002) in a 22 GHz image from August 1997, but it is smaller than the average value of 4.6% reported by Piner & Edwards (2005) from 22 GHz data acquired at four epochs in 2001–2002. Overall, none of the jet components show signs of variability (see Fig. 6).

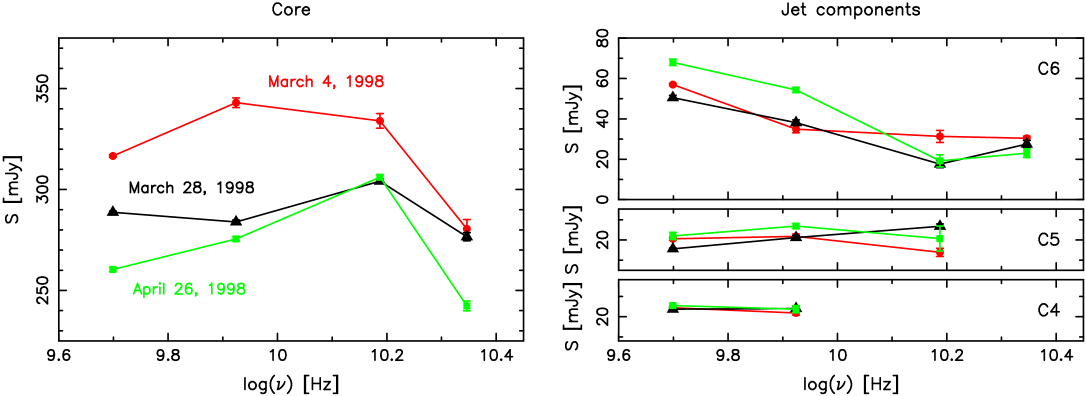
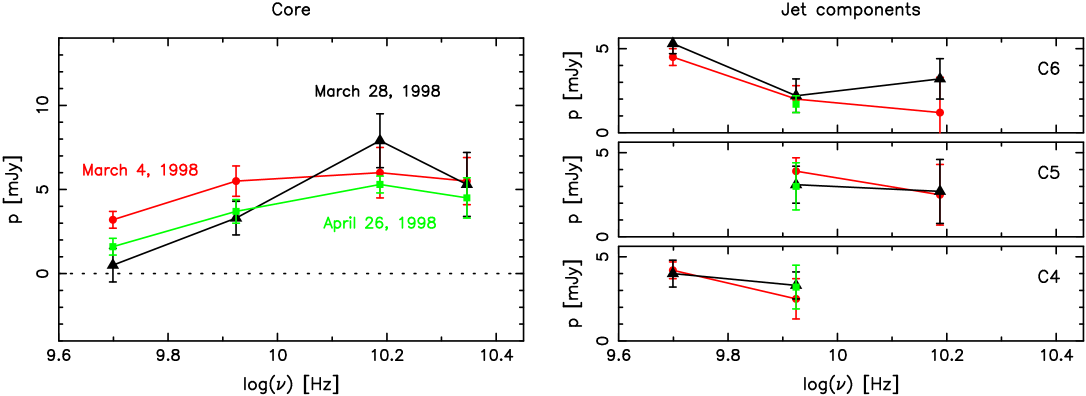
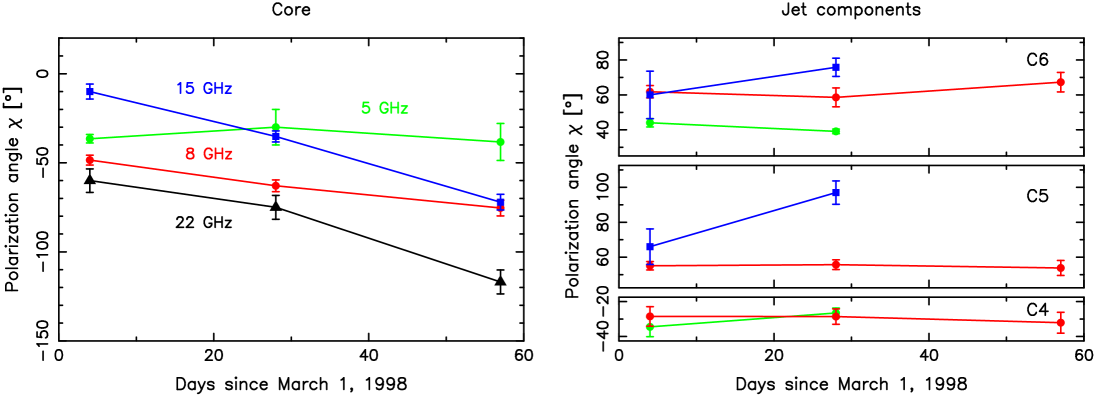
Figure 7 plots the variability of the polarization position angle for the core and the jet components C6, C5, and C4, based on the data in Table 2. As shown in this figure, the core polarization position angle at 5 GHz is stable over our three epochs and the orientation of the electric vectors at this frequency is aligned with the direction of the inner VLBI jet (about ). This value for the polarization angle of the core differs by from that measured by Pollack et al. (2003) in December 2000, an indication of the existence of significant variability on the long term even though none is detected over the two-month span of our data. In contrast, the core polarization position angles at 8, 15, and 22 GHz changed substantially in the time between our first and third epochs, whereas no such changes were found for the polarization angles of the jet components C6, C5, and C4. Again, this differs from the behavior observed in 2001–2002, where significant polarization angle variability was detected for component C6 but not for the core (Piner & Edwards 2005). In all cases, the rotations for the core exceed the errors in the polarization angles; the most dramatic rotation is through more than at 15 GHz, corresponding to about (see Table 2). The direction of the rotation is the same at all three frequencies, with the values becoming more negative and showing a roughly linear dependence on time. Since the rotation is not larger at the lower frequencies, it cannot be associated with variable Faraday rotation in the VLBI core. The orientation at 15 GHz at our first epoch () is nearly aligned with the direction of the inner VLBI jet (about ), and the orientation at 22 GHz at our third epoch () is nearly perpendicular to this direction. However, the other core orientations at 8, 15, and 22 GHz do not bear clear relationships to the direction of the inner jet. The observed core electric vectors at 15 and 22 GHz rotate nearly in synchrony, so that there is a large () and nearly constant offset between the values at these two frequencies, whose origin is unclear; as discussed above, this offset does not appear to be associated with Faraday rotation in the VLBI core.
The complex frequency dependence and variability of the core polarization position angles may be due to the presence of underlying components with different polarization properties within the region encompassed by the VLBI core. If such subcomponents have different polarization position angles and/or vary on different timescales, a complex behavior arises naturally for the polarization angles of the VLBI core when the individual subcomponents are superimposed. Repeated measurements of the total integrated polarization for Mkn 421, which indicate two predominating polarization states over the time span of our observations (Fig. 8), give support to this scenario. As seen in Fig. 8, the two polarization states have electric vectors that are either parallel to the VLBI jet () or perpendicular to the jet (), hence corresponding to orthogonal magnetic fields if assuming optically-thin synchrotron emission. In this scenario, the dominance of either state in the integrated polarization measurements would be the result of relative flux variations occurring on short timescales for subcomponents within the VLBI core. Alternately, the two polarization states may also result from variations in the optical depth (thin or thick emission) of such subcomponents if the underlying magnetic field is solely perpendicular to the jet.
4.2 VLBI properties and TeV activity
Our VLBI data have revealed striking temporal changes over a few weeks for the compact radio core in Mkn 421. To our knowledge, it is the first time that such substantial variations on short timescales have been observed by VLBI in a BL Lac object (with the exception of intraday variability). As noted previously, the complex temporal evolution for the VLBI core of Mkn 421 occurred at a time when the overall TeV -ray activity for Mkn 421 was rising (Fig. 3); furthermore, a TeV flare was detected just three days prior to our second VLBI run (Fig. 4). Both results qualitatively argue in favor of a link between radio VLBI and TeV -ray properties.
Assuming that the -ray radiation is nested in the compact VLBI core at 22 GHz (the highest available frequency), we can directly constrain the size of the high-energy emission region (projected on the plane of the sky) to be smaller than 0.15 mas (our measured VLBI core FWHM at 22 GHz, see Table 2) or, equivalently, 0.1 pc ( cm) if adopting a distance of 125 Mpc for Mkn 421 (, km s-1 Mpc-1). This upper limit for the projected size of the -ray emitting zone is consistent with typical estimates on the order of cm derived from variability data (Kataoka 2000) or from broadband spectrum modeling (Katarzynski et al. 2003). While our determination does not improve over such estimates, it is solely based on high-resolution radio-interferometric observations and hence is independent of any theoretical model.
In order to gain insight into the origin of the radiation for the compact radio core in Mkn 421, we compared its flux with predictions from high-energy emission models. Figure 9 shows the radio-to-TeV spectral energy distribution derived by fitting a one-zone synchrotron self-Compton (SSC) model to the data of a multi-frequency campaign on Mkn 421 that happened to coincide with our third VLBI run (Takahashi et al. 2000). Superimposed on this theoretical curve, our measured VLBI core fluxes at 5, 8, 15, and 22 GHz (as reported in Table 2) are also plotted. It is striking that the flux of the VLBI core at the highest radio frequency (22 GHz) is perfectly consistent with the prediction of the model, whereas those at the lower radio frequencies (15, 8, and 5 GHz) depart from the SSC predictions significantly. This finding is a strong indication that the compact core observed by VLBI at 22 GHz is dominated by the radio counterpart of the X-ray and -ray SSC radiation. Conversely, the VLBI core at 15 GHz and below must encompass external radio-emitting regions located beyond the -ray emitting zone, since the measured VLBI core fluxes at these frequencies are higher than the predictions of the SSC model.
The above scenario, which interprets the 22 GHz radio emission from the VLBI core of Mkn 421 as the low-energy tail of a one-zone SSC radiation, naturally implies a connection between radio variability and TeV activity. The existence of this connection is also supported by single-dish radio monitoring which revealed that some radio flares are correlated with TeV flares, with a simultaneous increase in the radio and high-energy fluxes when such events occur (Katarzynski et al. 2003). In our case, however, we instead detect an overall decrease in the radio flux of the VLBI core (Fig. 5) at a time when the very-high-energy -ray flux of the source tends to increase (Fig. 3). As noted by Katarzynski et al. (2003), self-absorption effects in the radio range can produce anticorrelation between flux variations observed at different energies within a SSC scenario. This may well be the case for our VLBI and TeV data, since the four observed radio frequencies are clearly within the self-absorbed part of the Mkn 421 spectrum (Fig. 9). Under this assumption, the observed anticorrelated radio and very-high-energy variations would fit within the proposed SSC scenario.

5 Conclusion
Coordinated multi-frequency VLBI polarization and very-high-energy TeV observations of the -ray blazar Mkn 421 have provided evidence of variability in the compact VLBI core on a timescale of a few weeks and at a time when the overall TeV activity of the source was rising. Although we cannot be entirely sure about the connection between the two phenomena, our measurements are consistent with a scenario in which the VLBI core at 22 GHz represents the self-absorbed part of the low-energy emission induced by a one-zone synchrotron self-Compton model consistent with simultaneous high-energy data. At the lower radio frequencies (15, 8, and 5 GHz), the VLBI core encompasses additional emission unrelated to the SSC phenomenon and most probably originating from regions outside the -ray emitting zone. Based on these observations, we also derived an upper limit of 0.1 pc ( cm) for the projected size of the -ray emitting region, in agreement with previous estimates but based solely on our radio-interferometric data and hence free of any theoretical model.
Further similar coordinated VLBI and TeV observations on Mkn 421 should be primarily targeted at improving the VLBI time coverage and angular resolution. Observations a few days apart over several weeks would be important to confirm whether the VLBI core variability and TeV activity are indeed connected and whether there is any anticorrelation between such variations. Increasing the VLBI angular resolution, e.g. by observing at 43 GHz with a transatlantic network or at 86 GHz with the global millimeter VLBI array, would also be important to further constrain the location and size of the -ray emission region in the framework of the proposed SSC scenario. By providing an angular resolution improved by a factor of up to 6, such high-frequency VLBI observations may perhaps even permit a direct measurement of the size of the SSC zone, which is on the order of cm according to present models. VLBI monitoring of Mkn 421 should also be pursued on the long-term to refine jet component proper motions and possibly obtain more clues as to why there are no superluminal motions in this presumably strongly-beamed source.

Acknowledgements.
We thank T. Takahashi and J. Kataoka for providing the parameters of their SSC model. This research has made use of data from the University of Michigan Radio Astronomy Observatory, which has been supported by the University of Michigan and the National Science Foundation.References
- Aharonian et al. (2005) Aharonian, F., Akhperjanian, A. G., Aye, K.-M., et al., 2005, A&A, 437, 95
- Bååth (1984) Bååth, L. B., 1984, in IAU Symposium 110: VLBI and Compact Radio Sources, eds. R. Fanti, K. Kellermann, & G. Setti (Dordrecht: Reidel), 127
- Bååth et al. (1981) Bååth, L. B., Elgered, G., Lundqvist, G., et al., 1981, A&A, 96, 316
- Bai & Lee (2001) Bai, J. M., & Lee, M. G., 2001, ApJ, 548, 244
- Barrau et al. (1998) Barrau, A., Bazer-Bachi, R., Beyer, E., et al., 1998, NIM, A416, 278
- Blandford & Königl (1979) Blandford, R. D., & Königl, A., 1979, ApJ, 232, 34
- Blandford & Rees (1978) Blandford, R. D., & Rees, M. J., 1978, in Proceedings of the Pittsburgh Conference on BL Lac Objects, ed. A. M. Wolfe (Pittsburgh: University of Pittsburgh Press), 328
- Bower (1998) Bower, G. C., 1998, in IAU Colloquium 164: Radio Emission from Galactic and Extragalactic Compact Sources, eds. J. A. Zensus, G. B. Taylor, & J. M. Wrobel, ASP Conf. Ser., Vol. 144, 41
- Britzen et al. (1998) Britzen, S., Witzel, A., Krichbaum, T. P., Roland, J., & Wagner, S., 1998, in IAU Colloquium 164: Radio Emission from Galactic and Extragalactic Compact Sources, eds. J. A. Zensus, G. B. Taylor, & J. M. Wrobel, ASP Conf. Ser., Vol. 144, 43
- Celotti et al. (1998) Celotti, A., Fabian, A. C., & Rees, M. J., 1998, MNRAS, 293, 239
- Coppi (1997) Coppi, P., 1997, in Relativistic Jets in AGNs, eds. M. Ostrowski, M. Sikora, G. Madejski, & M. Begelman (Cracow), 333
- Cui (2004) Cui, W., 2004, ApJ, 605, 662
- Edwards et al. (1998) Edwards, P. G., Moellenbrock, G. A., Unwin, S. C., Wehrle, A. E., Weekes, T. C., 1998, in IAU Colloquium 164: Radio Emission from Galactic and Extragalactic Compact Sources, eds. J. A. Zensus, G. B. Taylor, & J. M. Wrobel, ASP Conf. Ser., Vol. 144, 45
- Falcke et al. (1995) Falcke, H., Gopal-Krishna, & Biermann, P. L., 1995, A&A, 298, 395
- Fossati et al. (1998) Fossati, G., Maraschi, L., Celotti, A., Comastri, A., & Ghisellini, G., 1998, MNRAS, 299, 433
- Gabuzda et al. (1989) Gabuzda, D. C., Wardle, J. F. C., & Roberts, D. H., 1989, ApJ, 336, L59
- Gabuzda et al. (2000) Gabuzda, D. C., Pushkarev, A. B., & Cawthorne, T. V., 2000, MNRAS, 319, 1109
- Gaidos et al. (1996) Gaidos, J. A., Akerlof, C. W., Biller, S. D., et al., 1996, Nature, 383, 319
- Georganopoulos & Kazanas (2003) Georganopoulos, M., & Kasanas, D., 2003, ApJ, 594, L27
- Georganopoulos & Marscher (1998) Georganopoulos, M., & Marscher, A. P., 1998, ApJ, 506, 621
- Ghisellini et al. (1998) Ghisellini, G., Celotti, A., Fossati, G., Maraschi, L., & Comastri, A., 1998, MNRAS, 301, 451
- Ghisellini et al. (2005) Ghisellini, G., Tavecchio, F., & Chiaberge, M., 2005, A&A, 432, 401
- Giovannini et al. (1999) Giovannini, G., Feretti, L., Venturi, T., Cotton, W. D., & Lara, L., 1999, in BL Lac Phenomenon, eds. L. O. Takalo, & A. Sillanpää, ASP Conf. Ser., Vol. 159, 439
- Gopal-Krishna (1995) Gopal-Krishna, 1995, JApAS, 16, 153
- Kataoka (2000) Kataoka, J., 2000, Ph. D. Thesis, University of Tokyo
- Katarzynski et al. (2003) Katarzynski, K., Sol, H., & Kus, A., 2003, A&A, 410, 101
- Kellermann et al. (1998) Kellermann, K. I., Vermeulen, R. C., Zensus, J. A., & Cohen, M. H., 1998, AJ, 115, 1295
- Kellermann et al. (2004) Kellermann, K. I., Lister, M. L., Homan, D. C., et al., 2004, ApJ, 609, 539
- Kollgaard et al. (1996) Kollgaard, R. I., Palma, C., Laurent-Muehleisen, S. A., & Feigelson, E. D., 1996, ApJ, 465, 115
- Konopelko et al. (2003) Konopelko, A., Mastichiadis, A., Kirk, J., de Jager, O. C., & Stecker, F. W., 2003, ApJ, 597, 851
- Krawczynski et al. (2001) Krawczynski, H., Sambruna, R., Kohnle, A., et al., 2001, ApJ, 559, 187
- Krichbaum et al. (1998) Krichbaum, T. P., Kraus, A., Otterbein, K., et al., 1998, in IAU Colloquium 164: Radio Emission from Galactic and Extragalactic Compact Sources, eds. J. A. Zensus, G. B. Taylor, & J. M. Wrobel, ASP Conf. Ser., Vol. 144, 37
- Lähteenmäki et al. (2000) Lähteenmäki, A., Valtaoja, E., & Tornikoski, M., 2000, in Proceedings of The Fifth Compton Symposium, eds. M. L. McConnell, &. J. M. Ryan, AIP Conf. Proc., Vol. 510, 372
- Le Bohec et al. (1998) Le Bohec, S., Degrange, B., Punch, M., et al., 1998, NIM, A416, 425
- Lin et al. (1992) Lin, Y. C., Bertsch, D. L., Chiang, J., et al., 1992, ApJ, 401, L61
- Maraschi et al. (1999) Maraschi, L., Fossati, G., Tavecchio, F., et al., 1999, ApJ, 526, L81
- Marscher (1996) Marscher, A. P., 1996, in Gamma-ray Emitting AGN, eds. J. G. Kirk, M. Camenzind, C. von Montigny, & S. Wagner (Heidelberg), 97
- Marscher (1999) Marscher, A. P., 1999, Astroparticle Physics, 11, 19
- Marscher et al. (2002) Marscher, A. P., Jorstad, S. G., Mattox, J. R., & Wehrle, A. E., 2002, ApJ, 577, 85
- Marchenko et al. (2000) Marchenko, S. G., Marscher, A. P., Mattox, J. R., et al., 2000, in Proceedings of The Fifth Compton Symposium, eds. M. L. McConnell, &. J. M. Ryan, AIP Conf. Proc., Vol. 510, 357
- Mutel et al. (1990) Mutel, R. L., Su, Bumei, Bucciferro, R. R., & Phillips, R. B., 1990, ApJ, 352, 81
- Napier et al. (1994) Napier, P. J., Bagri, D. S., Clark, B. G., et al., 1994, Proc. IEEE, 82, 658
- Otterbein et al. (1998) Otterbein, K., Krichbaum, T. P., Kraus, A., et al., 1998, A&A, 334, 489
- Phillips & Mutel (1982) Phillips, R. B., & Mutel, R. L., 1982, ApJ 257, L19
- Piner & Edwards (2004) Piner, B. G., & Edwards, P. G., 2004, ApJ, 600, 115
- Piner & Edwards (2005) Piner, B. G., & Edwards, P. G., 2005, ApJ, 622, 168
- Piner et al. (1999) Piner, B. G., Unwin, S. C., Wehrle, A. E., et al., 1999, ApJ, 525, 176
- Piron et al. (2001) Piron, F., Djannati-Ataï, A., Punch, M., et al., 2001, A&A, 374, 895
- Pohl et al. (1995) Pohl, M., Reich, W., Krichbaum, T. P., et al., 1995, A&A, 303, 383
- Polatidis et al. (1995) Polatidis, A. G., Wilkinson, P. N., Xu, W., et al., 1995, ApJS, 98, 1
- Pollack et al. (2003) Pollack, L. K., Taylor, G. B., & Zavala, R. T., 2003, ApJ, 589, 733
- Punch et al. (1992) Punch, M., Akerlof, C. W., Cawley, M. F., et al., 1992, Nature, 358, 477
- Quinn et al. (1996) Quinn, J., Akerlof, C. W., Biller, S., et al., 1996, ApJ, 456, L83
- Reynolds et al. (2001) Reynolds, C, Cawthorne, T. V., & Gabuzda, D. C., 2001, MNRAS, 327, 1071
- Sambruna et al. (2000) Sambruna, R. M., Chou, L. L., & Urry, C. M., 2000, ApJ, 533, 650
- Takahashi et al. (2000) Takahashi, T., Kataoka, J., & Madejski, G., et al., 2000, ApJ, 542, L105
- Ulvestad (2000) Ulvestad, J., 2000, VLBA Scientific Memo No. 25, NRAO, Socorro
- Unwin et al. (1997) Unwin, S., Wehrle, A. E., Lobanov, A. P., et al., 1997, ApJ, 480, 596
- Urry & Padovani (1995) Urry, C. M., & Padovani, P., 1995, PASP, 107, 803
- Valtaoja & Teräsranta (1996) Valtaoja, E., & Teräsranta, H., 1996, A&AS, 120, 491
- Valtaoja et al. (1996) Valtaoja, E., Teräsranta, H, & Lähteenmäki, A., 1996, in Gamma-ray Emitting AGN, eds. J. G. Kirk, M. Camenzind, C. von Montigny, & S. Wagner (Heidelberg), 117
- Wehrle (1999) Wehrle, A. E., 1999, Astroparticle Physics, 11, 169
- Wehrle et al. (1993) Wehrle, A. E., Unwin, S. C., Zook, A. C., et al., 1993, BAAS, 25, 1450
- Witzel et al. (1988) Witzel, A., Schalinski, C. J., Johnston, K. J., et al., 1988, A&A, 206, 245
- Xu et al. (1995) Xu, W., Readhead, A. C. S., Pearson, T. J., Polatidis, A. G., & Wilkinson, P. N., 1995, ApJS, 99, 297
- Zensus (1997) Zensus, J. A., 1997, ARA&A, 35, 607
- Zhang & Bååth (1990) Zhang, F. J., & Bååth, L. B., 1990, A&A, 236, 47
- Zhang & Bååth (1991) Zhang, F. J., & Bååth, L. B., 1991, MNRAS, 248, 566