SDSS J160043.6+074802.9: a very rapid sdO pulsator
Abstract
We report the serendipitous discovery of the Sloan Digital Sky Survey star, SDSS J160043.6+074802.9 to be a very rapid pulsator. The variation is dominated by a frequency near 8380 Hz (period = 119.33 s) with a large amplitude (0.04 mag) and its first harmonic at 16760 Hz (59.66 s; 0.005 mag). In between these frequencies, we find at least another 8 variations with periods between 62 and 118 seconds and amplitudes between about 0.007 and 0.003 mag; weaker oscillations might also be present. Preliminary spectrograms from the performance verification phase of the Southern African Large Telescope indicate that SDSS J160043.6+074802.9 is a spectroscopic binary consisting of an sdO star and a late-type main-sequence companion. This makes it the first unambiguous detection of such an sdO star to pulsate, and certainly the first found to exhibit multi-frequency variations.
keywords:
Stars: oscillations – stars: variables – stars: individual (SDSS J160043.6+074802.9)1 Introduction
A decade ago, work on the EC survey (Stobie et al. 1997; Kilkenny et al. 1997a) led to the discovery of a new class of pulsating star (Kilkenny et al. 1997b). These were initially called EC14026 stars after the prototype, EC14026–2647 – which is now officially V361 Hya (Kazarovets, Samus & Durlevich 2000). EC14026/V361 Hya variables are sdB stars which pulsate with very short periods (typically 2 to 3 minutes) and which usually have several (sometimes many) oscillation frequencies. They have surface temperatures around 28000 40000 K and surface gravities 5.2 6.1. Independently of the discovery of sdB pulsations, their existence was predicted on the basis of the presence in models of low-order and low-degree radial and non-radial -modes driven by a classical mechanism associated with an iron opacity peak (Charpinet et al. 1996, 1997).
More recently, Green et al. (2003) reported the discovery of a separate, somewhat cooler group of slowly pulsating sdB stars. These have periods of around 1 – 2 hours, which indicates they are probably –mode pulsators. These slowly pulsating sdB stars are generally cooler than the fast pulsators, having less than about 27000 K, and are of somewhat lower surface gravity (log 5.4) and the two groups are reasonably (though not totally) separated in a / diagram (see figure 2 of Green et al. 2003). The slow pulsators are usually referred to as PG1716 stars, after the prototype, PG1716+426.
The way in which sdB stars are formed is not understood, nor is their relationship to the hotter sdO stars. A number of suggestions have been made – delayed helium core flashes or the merger of two helium-rich white dwarf stars – and it could be that a number of ways of forming these stars is possible; they might well be inhomogeneous groups. This certainly seems to be the case for the sdO stars, which exhibit a wide range of helium abundances (a recent review has been given by Heber et al. 2006). Unlike the sdB stars, there are no sdO stars which have been clearly shown to pulsate, though Rodríguez-López et al. (2006) have computed stability analyses of models for a range of temperatures, gravities and helium abundances which indicate that sdO stars could pulsate in both - and -modes. These authors also presented candidate stars as sdO pulsators, but none were unequivocally demonstrated to vary.
As part of a search by two of us (PW and BW) for new AM CVn stars, a sample of candidate stars from the Sloan Digital Sky Survey (SDSS; Adelman-McCarthy et al. 2006) was selected to be similar to known stars of this type on the basis of colours. The star discussed in this paper, SDSS J160043.6+074802.9, has colours derived from SDSS photometry ( mag, mag) which are identical to that of a newly discovered AM CVn system, 2QZ J142701.6-012310 (Woudt, Warner & Rykoff 2005). Of course, selection on the basis of blue colours does not unequivocally pick out new AM CVn stars and might include a number of different types of hot object, so a follow-up programme of “high-speed” photometry of likely candidates was carried out. During the course of this programme, in 2005 May, SDSS J160043.6+074802.9 (which we abbreviate to J16007+0748) was discovered to exhibit pulsations with a very short period near 120 seconds and indications of a possible harmonic at half that, making it one of the fastest known pulsators.
The 2000 equatorial co-ordinates are implicit in the full name of the star; the equivalent galactic co-ordinates are . The Sloan Digital Sky Survey gives photometry mag.
The unusually rapid variations of the star prompted us to try for further observations near the end of the 2005 season; photometric observations to confirm the variations and to resolve as far as possible all frequencies present, and spectroscopic data to clarify the nature of the object. In this paper we present our results to date.
2 Photometry
All photometric observations were made with the University of Cape Town CCD photometer (UCTCCD; O’Donoghue 1995) on the 1.9-m telescope at the Sutherland site of the South African Astronomical Observatory (SAAO) in July 2005. The UCTCCD is constructed around a Wright Instruments Peltier-cooled CCD system utilising a thinned, back-illuminated EEV P86321/T chip. It is usually used in frame-transfer mode (one half of the chip is “masked” and used as a storage/slow readout area) so that for exposures longer than about 8 seconds, there is essentially a continuous sequence of observations with no “dead” time. (Even faster exposures can be continuous if the CCD is pre-binned).
On the 1.9-m telescope, the 22 pixels of the CCD are equivalent to 0.13 arcseconds at the detector, so that it is normal to use at least 3 x 3 prebinning for optimal data extraction, unless the seeing is better than about 1 arcsecond. This mode (3 x 3) was used for all the 1.9-m observations listed in Table 1. All integration times were 10 seconds, which was considered a reasonable compromise between obtaining as good a signal-to-noise as possible and having adequate temporal sampling to resolve the fast variations.
| Run | Date | JD | Run | Comments |
|---|---|---|---|---|
| 2005 | (hr) | |||
| May | ||||
| S7648 | 16/17 | 2453507 | 0.6 | discovery |
| July | ||||
| 439 | 5/6 | 2453557 | 1.7 | |
| 443 | 6/7 | 3558 | 4.9 | |
| 447 | 7/8 | 3559 | 5.3 | some cloud |
| 451 | 8/9 | 3560 | 5.0 | |
| 482 | 15/16 | 3567 | 4.9 | thin cirrus |
| 484 | 16/17 | 3568 | 4.4 | quality poor |
Reduction of the CCD frames can be performed on-line, which enables the observer to judge the quality of the observations and to select suitable stars as local comparisons (to correct for small transparency variations). Conventional procedures (bias subtraction, flat field correction and so on) were followed with magnitude extraction being based on the point-spread function of the DoPHOT program described by Schechter, Mateo & Saha (1993).
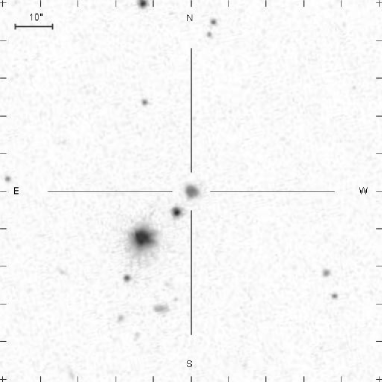
The rather small UCTCCD chip (50 x 34 arcsec on the 1.9-m telescope) often means that it is impossible to get useful comparison stars on the chip. Fortunately, J16007+0748 has two other stars within about 20 arcsec, one rather brighter and one significantly fainter (see Fig. 1) We have used the brighter star to correct differentially all observations of the target star – to remove rapid transparency variations as well as providing confidence that the variation is stellar, not atmospheric. Since, in general, field stars will be quite red, we might expect differential extinction effects to be significant, and we have further corrected for atmospheric extinction by removing a second order polynomial from each night’s observations. This means that we might be removing real changes in stellar brightness on time scales of a few hours but, since we often cannot distinguish between such effects, this has to be accepted. A sample of the differentially corrected light curve is displayed in Fig. 2.

| 439 + 443 | 447 + 451 | 482 + 484 | All July observations | |||||
| Freq | Amp | Freq | Amp | Freq | Amp | Freq | Amp | P |
| Hz | mmag | Hz | mmag | Hz | mmag | Hz | mmag | (s) |
| 8379.9 | 38.4 | 8379.8 | 39.3 | 8379.6 | 38.1 | 8379.8 | 38.6 | 119.33 |
| 9089.9 | 7.6 | 9089.4 | 6.0 | 9089.4 | 7.1 | 9089.4 | 6.8 | 110.02 |
| 16760.3 | 4.6 | 16760.0 | 5.5 | 16749.3 | 5.0 | 16759.7 | 5.1 | 59.66 |
| 14188.1 | 5.2 | 14188.1 | 5.0 | 14177.6 | 4.3 | 14188.0 | 4.7 | 70.48 |
| 8462.7 | 5.5 | 8472.3 | 5.4 | 8475.0 | 4.4 | 118.00 | ||
| 9664.5 | 2.6 | 9663.8 | 6.1 | 9650.4 | 3.2 | 9651.9 | 4.0 | 103.61 |
| 13052.5 | 3.2 | 13052.4 | 3.3 | 13052.2 | 3.5 | 76.62 | ||
| 15928.3 | 3.2 | 15927.7 | 3.8 | 15865.3 | 3.4 | 15928.4 | 3.1 | 62.78 |
| 9803.1 | 3.7 | 9780.1 | 4.1 | 9792.8 | 2.9 | 102.12 | ||
| 13684.6 | 2.8 | 13660.2 | 3.9 | 13673.1 | 2.7 | 73.14 | ||
3 Frequency analysis
The frequency analysis described in this section was carried out using software which produces Fourier amplitude spectra following the Fourier transform method of Deeming (1975) as modified by Kurtz (1985).
3.1 Individual nights
Initially, we determined the amplitude spectrum for each night separately. Even these short data sets, typically 4 to 5 hours, showed up several clear frequencies (though it is obvious that with periods of 2 minutes or less, even a run of 4 hours covers much more than 100 cycles). Every one of the six nights showed the very strong frequency near 8380 Hz (119 s) with a substantial amplitude around 0.039 mag. Frequencies around 9090 Hz (110 s; 0.007 mag), 14190 Hz (70 s; 0.005 mag) and 16760 Hz (59 s; 0.005 mag) were also found on every night. The last frequency seems highly likely to be the first harmonic of the dominant frequency near 8380 Hz; Note that the sidereal drive period of the 74-in telescope is 90 s. The dominant frequency and its first harmonic (at 8380 and 16760 Hz, respectively) are therefore intrinsic to the star and not due to the telescope drive error.
In addition, more than half the runs showed apparently significant frequencies near 13060 Hz (73 s), 9660 Hz (103 s), 8460 Hz (118 s), 15900 Hz (63 s) and 8530 Hz (117 s). (We have accepted amplitudes greater than about 3 times the background noise level – relaxed somewhat from the canonical 4 times the background because we do see these frequencies on so many of the independently analysed nights). These frequencies are all less than about 0.006 mag in amplitude, though there are indications that some of them might be variable in amplitude – they appear very clearly on some nights and are essentially invisible on others. We demonstrate this in the next sub-section.
3.2 Paired nights
Because of the very rapid nature of the variations and the distribution of the observations in time (see Table 1), we next determined amplitude spectra for data from pairs of consecutive nights. The results (frequencies and amplitudes) are summarised in the first six columns of Table 2, where it can be seen that we recover virtually all of the frequencies mentioned in section 3.1 (we lose the one near 8530 Hz) and find indications that others are split into two components.
It is instructive to examine the Fourier amplitude spectra for the paired nights, and these are shown in Fig. 3. It is clear from this figure that the frequencies listed in Table 2 are well above the background noise level and that some of these frequencies are variable in amplitude – see, for example, the frequencies between about 8000 and 10000 Hz in Fig. 3, especially the close pair of frequencies near 9650 and 9800 Hz.

3.3 The full data set
Because the final set of observations (run 484 – the night of July 16/17) appeared rather poor, we determined amplitude spectra for runs 439 to 451 and then runs 439 to 484 inclusively. The results were so similar that in what follows we have used all of the July data combined.
As in the previously described determinations, we extracted frequencies one at a time. These essentially repeated the paired results listed in Table 2 and so we also include the frequencies determined from the full data set in columns 7 and 8 of that Table.
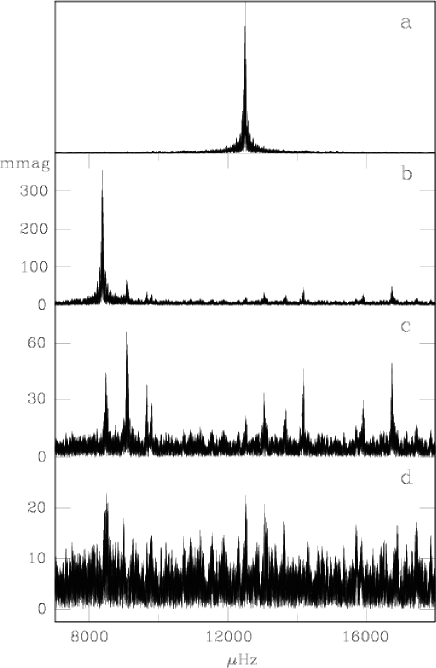
Given the good inter-agreement between various samplings of the observations, we have carried out a simultaneous least-squares fit (Deeming 1968) to the ten frequencies which appear to persist in all (or most) of the solutions, and which are more than four times the general background noise. The simultaneous solutions are given in Table 3. Fig. 4 shows the amplitude spectrum for all the July data; for the spectrum with the dominant frequency near 8380 Hz removed; and with the strongest 10 frequencies removed.
| Freq | Amp | Period | ||
| Hz | mmag | (s) | ||
| 8379.82 | 0.01 | 39.8 | 119.33 | |
| 9089.40 | 0.03 | 6.8 | 110.01 | |
| 16759.68 | 0.03 | 5.1 | 59.67 | |
| 14187.95 | 0.04 | 4.8 | 70.48 | |
| 8462.14 | 0.04 | 4.8 | 118.17 | |
| 9651.90 | 0.04 | 4.0 | 103.61 | |
| 13052.22 | 0.05 | 3.4 | 76.61 | |
| 15940.01 | 0.06 | 3.0 | 62.74 | |
| 9804.37 | 0.06 | 2.8 | 102.00 | |
| 13673.08 | 0.07 | 2.6 | 73.14 | |
| 8477.90 | 0.07 | 2.5 | 117.95 | |
| 12526.81 | 0.07 | 2.4 | 79.83 | |
| 13071.88 | 0.07 | 2.2 | 76.50 | |
| 8516.42 | 0.08 | 2.2 | 117.42 |
In Fig. 4d it does appear that there are still peaks well above the background noise. The rms scatter in the background over the whole range of frequency shown in the figure is about 0.5 to 0.6 mmag and our criterion for “reality” of frequency peaks is that they should be more than four times the noise level We have therefore extracted a further four frequencies from the residual amplitude spectrum in Fig. 4d which are close to 2.2 mmag in amplitude and these are listed below the line in Table 3. They are less secure than to and it should be mentioned that two of them, and are close to the very strong frequency, , and might be an artefact of imperfect extraction of that frequency. With 14 frequencies removed, even the most enthusiastic frequency-extractor would be hard put to find anything in our observations significantly different from noise.

4 Spectroscopy
The fact that J16007+0748 was selected as a very hot object and the nature of the observed photometric variations indicated that the object was likely to be a rapidly pulsating sdB star. We were therefore keen to get spectroscopic observations to determine the nature of the star.
4.1 1.9-m spectroscopy
Although J16007+0748 is fainter than 17 mag (see Section 1) and therefore right at the faintness limit of the spectrograph on the SAAO 1.9-m telescope, we used the earliest time available to us on the SAAO 1.9-m telescope with the Cassegrain spectrograph. Unfortunately, this was near the end of the season for J16007+0748, but we obtained two 15 – 20 minute exposures at the start of each night between 1/2 and 3/4 September 2005, giving us a total of six (very noisy) spectrograms and a total integration time of 8400 seconds.
All spectrograms were obtained with grating 6, which has a spectral range of about 3500 – 5300 Å at a resolution of around 4 Å. A rather wide slit was used (300 , equivalent to 1.8 arcsec on the sky) to maximise light throughput. The final co-added spectrogram is shown in Fig. 5; this has been smoothed and the blue end truncated because the noise was so high. There is little that can be confidently deduced from Fig.5; it is probable that He II 4686 and H(/He II?) at 4861 Å are present, but the evidence is not overwhelming. However, if He II is present at comparable strength to the 4861 line, then the star can not be of sdB type.

| 4 April 2006 | 5 June 2006 | ||||
| (Å) | (Å) | (km s-1) | (Å) | (km s-1) | |
| H | 3970.07 | 3969.67 0.29 | –13 22 | not in spectral range | |
| H | 4101.73 | 4101.10 0.25 | –29 18 | not in spectral range | |
| He II | 4199.83 | low signal-to-noise, no clear line | 4199.38 0.18 | –40 13 | |
| H | 4340.46 | 4339.47 0.25 | –51 17 | 4339.13 0.13 | –100 8 |
| He II | 4541.59 | in gap between two CCDs in mosaic | 4539.51 0.16 | –146 11 | |
| He II | 4685.71 | 4685.36 0.24 | –5 15 | 4684.42 0.14 | –91 9 |
| H | 4861.33 | 4860.57 0.24 | –29 15 | 4859.53 0.13 | –119 8 |
| He II | 5411.53 | 5410.87 0.31 | –19 17 | 5409.37 0.16 | –128 9 |
| Na D | 5889.95 | (5889.33 0.26) | (–14 13) | blended | |
4.2 SALT spectroscopy
The Southern African Large Telescope (SALT) is currently in the “performance verification” phase where engineering needs are predominant, but we were fortunate to be able to get three 600-second spectrograms of good signal-to-noise in April and June 2006. Three additional 600-seconds spectrograms were obtained in the same period in rather too poor conditions (bright Moon plus cloud) to be of much further use.
The spectrograms were taken with the Robert Stobie Spectrograph (previously called the Prime Focus Imaging Spectrograph) in single-slit spectroscopy mode using the PG1300 grating at a grating angle of 18.5∘ in April 2006 (corresponding to a camera articulation angle of 37∘ in a standard Littrow configuration) and at a grating angle of 19.62∘ in June 2006. A 1.5-arcsec slit was used, providing a central wavelength of 4880 Å (April 2006) and 5170 Å (June 2006), respectively, and a resolution of 3.9 Å.
The flat-fielded, wavelength-calibrated SALT spectrogram is shown in Fig. 6. This spectrum is an average of the three spectra obtained in April and June 2006. The He II 4686 line and the Pickering series of He II at 5411, 4542 and 4200 are clearly present in absorption. The Balmer series lines H to H are present, but these are probably blended with Pickering lines of He II.
Table 4 shows a comparison of the measured wavelengths () with the rest wavelengths (). The He II 4686 and 5411 lines measured in the spectrogram obtained in April 2006, which should be relatively unblended, show displacements equivalent to –12 km s-1 (corrected to heliocentric velocities) whereas the hydrogen Balmer series lines show substantially higher blue shifts – consistent with the Balmer lines being blended with He II Pickering lines. Note, however, that this difference in heliocentric velocity is of the same order of magnitude as the errors in the heliocentric velocities. These errors are derived from the standard deviation in the wavelength-calibration solution using a Cu-Ar calibration spectrogram ( Å in April 2006 and 0.12 Å in June 2006, respectively) and from repeated measurements of individual lines; typically each line was measured 5 times.
No He I lines (such as the typically strong features near 4471 and 4026 Å) are detected, ruling out types sdB and sdOB. (He II is sometimes detected in these relatively cooler stars, but it is much weaker than the Balmer lines or He I). The spectrum is clearly that of a classical sdO star (see, for example, Moehler et al. 1990).
Based on the April 2006 SALT spectrogram of J16007+0748, the referee suggested the possibility of the star being a spectroscopic binary consisting of an sdO and sdB star (where the pulsations could be due to the sdB star instead). To explore this possibility further, the spectrograms in June 2006 were obtained. Apart from the considerable shift in heliocentric velocities of the measured lines over a 2-month period (see Table 4), the Na D lines 5889, 5896 (marginally resolved) appeared clearly in the spectrum. The large equivalent width of the Na D lines and the high Galactic latitude of J16007+0748 () rules out the possibility of interstellar Na D absorption lines. This suggests that J16007+0748 is indeed a spectroscopic binary, but one consisting of an sdO star and a late-type main sequence star and appears to rule out an sdB component.
We therefore suggest that J16007+0748 is the first clearly established sdO pulsator. We note that Rodríguez-López et al. (2006) have presented candidate stars as sdO pulsators, but these are of very low amplitude and remain to be confirmed. At the least, we have demonstrated unequivocal multi-frequency variations in an sdO star for the first time.
5 Discussion
We have shown SDSS J160043.6+074802.9 to be a spectroscopic binary consisting of an sdO and late-type main sequence companion. In addition we have shown it to have at least 10 modes of variation in the range 60 to 120 s (16760 to 8389 Hz). Given this array of frequencies, it seems highly likely that the source of the variation is pulsation in the sdO star.
Until we obtained the SALT spectrogram in 2006 April, we had assumed the object would turn out to be a rapidly pulsating sdB star (= EC14026 star = V361 Hya star; all unlovely names). These generally show:
-
•
Very rapid variations, with typical periods 2 – 8 minutes.
-
•
Complex variations, in that most show several frequencies – and some show a large number ( 40).
-
•
Additional complexity, in that many stars have frequencies with changing amplitudes – indicating amplitude variations or that we might be observing the beating of as yet unresolved frequencies.
J16007+0748 exhibits all these properties. This is presumably because the sdO stars – like the sdB stars – are evolved, low-mass ( 0.5 M⊙) stars although, of course, the sdO stars are hotter. Rodríguez-López et al. (2006) have presented a synopsis of stability analyses of model sdO stars. They find three frequency regions where pulsations are stable; two regions where modes have a tendency to instability – 500 to 2000 Hz corresponding to high radial order -modes and 9000 to 12000 Hz corresponding to low radial order -modes – and a region of high stability from about 2000 – 9000 Hz. The observed variations in J16007+0748 lie between 8000 and 16000 Hz and so are of the right order and would suggest -modes – as is the case with the rapidly pulsating sdB stars. Of course, the models were calculated for specific temperatures and gravities and we do not yet have determinations of these for this star, but the broad agreement is promising. Substantially higher S/N spectrograms (at higher spectral resolution to resolve the H/He II blended lines) are needed to do a full spectral analysis on this star and compare its properties (, and chemical composition) with other sdOs and with the already known classes of hot pulsators (the PG 1159 stars, Werner 2001).
The substantial shift in heliocentric velocities observed over a 2-month period of order 80 km s-1 (see Table 4), suggests that J16007+0748 is a short-period binary and further spectroscopic observations are needed to resolve the spectroscopic period of this binary. We tentatively constrain the spectral type of the companion to late F or early G based on the presence of the Na D line, and the absence of Ca I 6162 and the blend of lines near 6497 Å (see the spectral atlas of Allen & Strom 1995). The latter is based on a 20-min spectrogram obtained with SALT in marginal conditions (bright moon) in the red part using the G0900 grating covering 5000–8000 Å.
Further evidence for the binary nature of J16007+0748 comes from the observed SDSS colours (see Section 1). The and colours of J16007+0748 deviate significantly from the well-defined concentration of subdwarfs in the colour-colour diagram of white dwarfs and subdwarfs identified in the SDSS (see figure 2 of Kleinman et al. 2004).
Acknowledgements
PAW kindly acknowledges financial support from the University of Cape Town and the National Research Foundation. We thank the referee, Stefan Dreizler, for very useful comments regarding the possible binary nature of J16007+0748. Funding for the creation and distribution of the SDSS Archive has been provided by the Alfred P. Sloan Foundation, the Participating Institutions, the National Aeronautics and Space Administration, the National Science Foundation, the U.S. Department of Energy, the Japanese Monbukagakusho, and the Max Planck Society. The SDSS Web site is http://www.sdss.org/
The SDSS is managed by the Astrophysical Research Consortium (ARC) for the Participating Institutions. The Participating Institutions are The University of Chicago, Fermilab, the Institute for Advanced Study, the Japan Participation Group, The Johns Hopkins University, the Korean Scientist Group, Los Alamos National Laboratory, the Max-Planck-Institute for Astronomy (MPIA), the Max-Planck-Institute for Astrophysics (MPA), New Mexico State University, University of Pittsburgh, Princeton University, the United States Naval Observatory, and the University of Washington.
References
- [] Adelman-McCarthy J., Agueros M.A., Allam S.S., et al., 2006, ApJS, 162, 38
- [] Allen L.E., Strom K.M., 1995, AJ, 109, 1379
- [] Charpinet S., Fontaine G., Brassard P., Dorman B., 1996, ApJ, 471, L103
- [] Charpinet S., Fontaine G., Brassard P., Chayer P., Rogers F.J., Iglesias C.A., Dorman B., 1997, ApJ, 483, L123
- [] Deeming T.J., 1968, Vistas in Astr. 10, 125
- [] Deeming T.J., 1975, Ap&SS 36, 137
- [] Green E.M., Fontaine G., Reed M.D., et al., 2003, ApJ, 583, L31
- [] Heber U., Hirsch H., Ströer A., O’Toole S., Haas S., Dreizler S., 2006, in stensen R.H., ed., The Second Meeting on Hot Subdwarfs and Related Objects, Baltic Astr., 15, p.91
- [] Kazarovets E.V., Samus N.N., Durlevich O.V., 2000, IBVS, 4870
- [] Kilkenny D., Koen C., O’Donoghue D., Stobie R.S., 1997b, MNRAS, 285, 640
- [] Kilkenny D., O’Donoghue D., Koen C., Stobie R.S., Chen A., 1997a, MNRAS, 287, 867
- [] Kleinman S.J., Harris H.C., Eisenstein D.J., et al., 2004, ApJ, 607, 426
- [] Kurtz D.W., 1985, MNRAS 213, 773
- [] Moehler S., Richtler T., de Boer K., Dettmar R.J., Heber U., 1990, A&AS 86, 53
- [] O’Donoghue D., 1995, Baltic Astr. 4, 519
- [] Rodríguez-López C., Moya A., Garrido R., MacDonald J., Ulla A., Dreizler S., Hügelmeyer S.D, Manteiga M., 2006, in stensen R.H., ed., The Second Meeting on Hot Subdwarfs and Related Objects, Baltic Astr., 15, p.313
- [] Schechter P.L., Mateo M., Saha A., 1993, PASP, 105, 1342
- [] Stobie R.S., Kilkenny D., O’Donoghue D., et al., 1997, MNRAS, 287, 848
- [] Werner K., 2001 Ap&SS, 275, 27
- [] Woudt P.A., Warner B., Rykoff E., 2005, IAUC 8531