Evidence for strong evolution of the cosmic star formation density at high redshifts.
††thanks: Based on observations collected at the European
Southern Observatory, Chile, proposals 074.A-0233 and 076.A-0384
Deep HST/ACS and VLT/ISAAC data of the GOODS-South field were used to look for high-redshift galaxies in the rest-frame UV wavelength range and to study the evolution of the cosmic star-formation density at z7. The GOODS-South area was surveyed down to a limiting magnitude of about (J+Ks)AB=25.5, looking for drop-out objects in the ACS filter. The large sampled area would allow for the detection of galaxies that are 20 times less numerous and 1-2 magnitudes brighter than similar studies using HST/NICMOS near-IR data. Two objects had initially been selected as promising candidates for galaxies at z7, but were subsequently dismissed and identified as Galactic brown dwarfs through detailed analysis of their morphology and Spitzer colors, as well as through spectroscopic information. As a consequence, we conclude that there are no galaxies at z7 down to our limiting magnitude in the field we investigated. Our non detection of galaxies at z7 provides clear evidence for a strong evolution of the luminosity function between z=6 and z=7, i.e. over a time interval of only 170 Myr. Our constraints also provide evidence of a significant decline in the total star formation rate at z=7, which must be less than 40% of that at z=3 and 40-80% of that at z=6. We also derive an upper limit to the ionizing flux at z=7, which is only marginally consistent with what is required to completely ionize the Universe.
Key Words.:
Galaxies: formation - Galaxies: evolution - Galaxies: high-redshift - Galaxies: starburst - Cosmology: observations - Early Universe1 Introduction
The sensitivity of new generation instruments, coupled with 8–10-m class ground-based telescopes and with the HST, allowed impressive progress in observational cosmology during the past few years.
Several surveys aimed at searching for high redshift galaxies have obtained large samples of objects at increasing redshifts: z1 (e.g., Cowie et al. 1996), z3 (Steidel et al. 1996, 2003), z4 (Steidel et al. 1999, Hu et al. 1996), z5 (Hu et al. 1999, Spinrad et al. 1998), z6 (Dawson et al. 2001; Fan et al. 2001; Stanway et al. 2003; Bouwens et al. 2004a, 2006; Dickinson et al. 2004; Mobasher et al. 2005), up to the currently accepted record of z6.6 (Hu et al. 2002;, Kodaira et al. 2003; Taniguchi et al. 2005). Observations are approaching the interesting redshift range between z=6 and z=10 where current cosmological models expect to find the end of the reionization period and the “starting point” of galaxy evolution (e.g., Stiavelli, Fall & Panagia 2004)
The results from all these surveys have had a tremendous impact on our understanding of the cosmic history of star formation and on the reionization epoch (Gunn & Peterson 1965). As an example, the detection of high-redshift quasars by Fan et al. (2001) allowed the measurement of the fraction of neutral gas at z6 (Becker et al. 2001; Fan et al. 2002; Pentericci et al. 2002). The discovery that this fraction is low but significantly non-zero (nearly the same as or larger than 1%) puts severe constraints on reionization models. On the contrary, the detection of a high opacity due to ionized hydrogen in the WMAP data (Alvarez et al. 2006) points toward a high reionization redshift (z11). Thus, detecting objects at even higher redshifts could put strong constraints on the properties of the intergalactic medium at those redshifts (Loeb et al. 2005; Gnedin & Prada 2004; Ricotti et al. 2004; Cen et al. 2005).
Most high-redshift galaxies from the previous surveys were selected by the dropout technique, i.e., by detecting the spectral break in the UV continuum blueward of the Ly due to intervening Ly-forest (see, for example, Steidel et al. 2003). This technique is mainly sensitive to high-redshift UV-bright galaxies, commonly named Lyman-Break Galaxies (LBGs). The use of different filters allows the selection of different redshift ranges, from z3 (U-dropout, Steidel et al. 1996, 2003), to z6 (-dropout, Stanway et al. 2003; Bouwens et al. 2004a, 2006; Shimasaku et al. 2005), z7 (-dropout, Bouwens et al. 2004b; Bouwens & Illingworth 2006), and even z10 (J-dropout, Bouwens et al. 2005; Mobasher et al. 2005); see Hopkins (2004) and Hopkins & Beacom (2006) for two recent reviews.
Up to a redshift of about 6, galaxies can be detected by using optical data alone, as the Lyman break occurs at m and the continuum above Ly can be sampled, at least, by the HST/ACS filter. This allowed for the detection of a large number of objects at z=6, which provides evidence of strong evolution of the Luminosity Function (LF) of the LBGs between z=6 and z=3. This is described as the brightening, with increasing cosmic age, of the typical luminosity () of about 0.7 mag (Bouwens et al. 2006) or the increase in the comoving density () by a factor of 6 (Bunker et al. 2004).
At redshifts higher than 6 the use of near-IR images is mandatory, which makes detection much more difficult. Deep J-band images from HST/NICMOS exist, but their field-of-view is limited to a few sq.arcmin. Larger fields can be observed by ground-based telescopes, but at the expense of worse PSFs (about 0.5-1.0″ FWHM instead of 0.4″ for NICMOS/NIC3 and 0.1″ for HST/ACS) and brighter detection limits.
Bouwens at al. (2004b) used one of these deep NICMOS fields in the Hubble UltraDeep Field (HUDF) to detect -dropout objects. They detected 5 objects in a 5.7 sq.arcmin field down to a limiting mag of H27.5, showing the possible existence of a reduction in the Star Formation Density (SFD) at z6. Recently, Bouwens & Illingworth (2006) enlarged this search to 19 sq.arcmin using new NICMOS data and improved data reduction. They detected four possible z7 objects, while 17 were expected based on the z=6 LF. Also, they found that at least 2 of the 5 sources in their previous study were spurious. These new results point toward the existence of a strong reduction in the LF with increasing redshift at z6. In contrast, Mobasher et al. (2005), looking for J-dropout galaxies in the HUDF, detected one object that could be a massive post-starburst galaxy at z6.5, formed at high redshift, z9, (but see also Eyles et al. 2006, and Dunlop et al. 2006, who suggest lower redshifts for this object). Deep near-infrared data were also used by Richard et al. (2006) to examine two lensing clusters, and detect eight optical dropouts showing Spectral Energy distributions (SEDs) compatible with high-redshift galaxies. After correcting for lensing amplification, they derived an SFD well in excess of the one at z=3, hinting at large amounts of star formation activity during the first Gyr of the universe.
By extrapolating the LF observed at z6 (Bouwens et al. 2006) toward higher redshifts, it is possible to see that those studies based on small-field, deep near-IR data are able to detect only galaxies that are much more numerous, and therefore fainter, than L∗ galaxies. Their faint magnitudes imply that their redshifts cannot be spectroscopically confirmed with the current generation of telescopes, and it is difficult to distinguish these candidates from the Galactic brown dwarfs with the same colors. As a consequence, these data cannot be used to confidently put strong constraints on the amount of evolution of the LF at z: if all the candidates are real star-forming galaxies at the proposed redshift, the SFD at z=7 and z=10 could be similar to that at z=6. If, on the contrary, none of them are real, the upper limits of the SFD would imply a decrease of the SFD toward high redshifts. As a consequence, the evolution of the SFD at z is not yet well constrained. The knowledge of this evolution is fundamental for a good understanding of the primeval universe, for example, of the sources of reionization.
Here we present a study aimed at detecting bright z=7 objects in a large (unlensed) field, in order to measure the cosmic star-formation density at this redshift. This is important for two main reasons: first, comparing these results for bright objects with those by Bouwens et al. (2004b) and Bouwens and Illingworth (2006) for fainter -dropouts will allow us to study different part of the LF. This is needed, for example, to distinguish between luminosity and density evolution and to compare it with the dark matter distribution predicted by the cosmological models. Second, the detections of relatively bright objects would allow a more complete study of the properties of these galaxies in terms of morphology, spectroscopy, and SEDs. We will show that the absence of z7 objects with in the survey field means that the galaxy luminosity function evolved significantly in the short time (about 170 Myr) between z=7 and z=6. The epoch at z=7, about 750 Myr after the Big Bang, can therefore be considered the beginning of the bulk of star formation.
Throughout this paper we use the concordance cosmology and AB magnitudes.
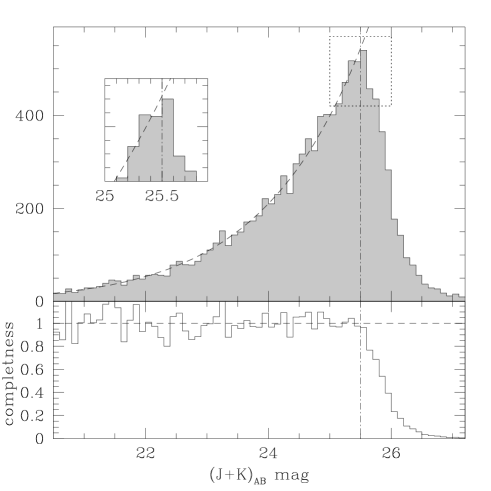
. Lower: completeness of the detections computed as the ratio between the fit and the histogram of the upper panel. The 6 limiting magnitude of (J+Ks)=25.5 corresponds to a completeness of about 95%.

Small dots show the galaxies detected in the GOODS-South in all three bands, while the arrows show the positions of the objects undetected in K. The dashed line shows the color threshold. Above this threshold only objects with no counterparts either in , , and or in the sum ++ image are shown. Large solid dots show the two objects discussed in Sect. 4.
The labels show their entry number in our catalog.
2 Observations and object catalog
The GOODS-South field, centered on the Chandra Deep Field South (CDFS), is a region of about 1015 arcmin that is the subject of deep observations by many telescopes. HST observed it with ACS using the broad-band filters , , , and (Giavalisco et al. 2004a). Most of the GOODS-South was observed in J, H, and Ks with the VLT/ISAAC (Labbé et al. 2003; Vandame et al. in preparation; see also Grazian et al. 2006). Many other deep observations are available for the GOODS-South field. The Spitzer satellite obtained images of this field in all its bands, in particular in the IRAC bands 1 and 2, corresponding to 3.6 and 4.5m.
The main catalog is based on ESO/VLT J and Ks data covering 141 sq.arcmin111To build the catalog we used the images of the public release version 1.0, while the photometry was computed on the images of the 1.5 version, available from October 2005. The typical exposure time is 3.5h in J and 6h in K, with a seeing of about 0.45″ FWHM (see also Fig. 4). We used the J+Ks sum image to build the main object catalog: actively star forming galaxies are expected to have a flat (in units) spectrum between J and K, and therefore the use of the combined image is expected to improve the object detectability. The program Sextractor (Bertin & Arnouts 1996) was used to extract the object catalog. We selected objects having flux above 1.2 times the RMS of the sky over a 0.22 sq.arcsec area (10 contiguous pixels). The part of the images near the edges were excluded as the noise increases because of telescope nodding. The final covered area is 133 sq.arcmin. The average 6 magnitude limit inside a 1″ aperture is 25.5, estimated from the statistics of the sky noise. This agrees well with the histogram of the detected sources as a function of the (J+Ks) magnitude shown in Fig. 1, showing that this magnitude corresponds to 95% of completness. The main catalog comprises about 11.000 objects.
The colors of the objects were computed from the photometry inside an aperture of 1″ of diameter for the HST/ACS and VLT/ISAAC images.
3 Candidate selection
As discussed above, galaxies at z7 can be selected as z’-dropouts, i.e. objects with very red z’–J colors, indicating the presence of a break, and with blue J–K colors, which disentangles high-redshift star-forming galaxies from reddened foreground galaxies. This is illustrated by the z’–J versus J–K color diagram in Fig.2, where we plot the colors expected for different classes of galaxies affected by various amounts of dust reddening (from Bruzual & Charlot 2003, and Mannucci et al. 2001) along with the data from our sample. The figure shows that objects with both red z’–J and red J–K color are likely to be reddened galaxies at intermediate redshift. In Fig.2 the thick tracks indicate the colors expected for star forming galaxies at z7, which are indeed separated from reddened galaxies on this diagram.
Another class of possible interlopers are Galactic brown dwarfs. Indeed, these stars can have blue J–K colors and strong methane absorption shortward of m, strongly suppressing the emission in the z’ band and thus mimicking z’-dropouts of high redshift galaxies. The coldest brown dwarfs are also undetected in all other optical bands. This is illustrated in Fig.2, where stars show the colors of brown dwarfs obtained by convolving the spectra in Testi et al. (2001) with the ACS and ISAAC filter transmission curves. These colors extend in the region of the diagram used for selecting of z’-dropouts. Summarizing, the use of near-IR colors alone is enough to exclude low/intermediate galaxies, but not to distinguish true z7 star-forming galaxies from high-z QSOs or Galactic brown dwarfs.
We selected objects that are undetected () in and in all bluer bands and that have –J0.9 and , as shown in Figure 2. This region is larger than expected for galaxies at z7, so it is possible that a number of lower-redshift interlopers are present in the catalog. This choice is motivated by not having detected any reliable candidate (see below) and is therefore needed to exclude high-redshift galaxies not being selected because of colors just outside an exceedingly narrow selection area.
Despite the common name of “dropouts”, we do not require that our candidates are undetected in . In fact, z=7 sources can be quite luminous in this band for two possible reasons: 1) although the cut-on filter convolved with the ACS detector efficiency has a response peaking at 8800Å, its red wing gathers some flux up to 1.05m, and as a consequence, some flux at or above the Ly line could be transmitted by the filter (indeed this is predicted by tracks of galaxies at z7 in Figure 2); 2) if the reionization epoch is at z7 (as the recent WMAP results and the spectrum of the galaxy at z=6.56 suggest, Bennett et al. 2003; Hu et al. 2002), then the Ly-forest may still have some transmission, similar to what is observed in QSOs at z6 (Pentericci et al. 2002).
An initial catalog was constructed by using the optical photometry from the public GOODS catalog (Giavalisco et al. 2004a) with the aperture photometry computed by Sextractor. This produced the selection of a few tens of -dropouts. These objects were checked by eye to remove spurious detections or objects whose photometry is seriously affected by bright nearby objects. The photometry of the 6 objects that passed this check was measured again by using the IRAF/PHOT program in the same 1″ aperture. Using a local sky computed in an annular region around the object, this program is expected to provide better photometry of faint sources. For 4 of these objects, the new –J color is much bluer, below the detection threshold. This is an indication that Sextractor overestimated the local sky near these sources.
4 The two candidates
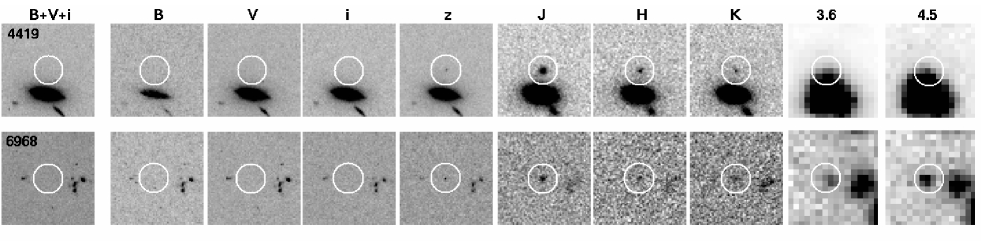
The SED of the two candidates are compatible overall with being high-redshift star-forming galaxies. The 9 available photometric bands, from to Spitzer/IRAC 4.5m, can be used to derive photometric redshifts. These two objects are contained in the GOODS-MUSIC catalog (Grazian et al. 2006), object 4409 with ID 7004 and object 6968 with ID 11002 with photometric redshifts of 6.91 and 6.93, respectively. Both objects have already been selected as -dropout objects by other groups. Object 4419 was selected by Stanway et al. (2003) (object SBM03#5) and further studied by Bunker et al. (2004) (ID number 2140), while object 6968 was selected by Eyles et al. (2006) (ID 33_12465) and by Bouwens & Illingworth (2006). Both objects were identified as Galactic stars on the basis of the compact ACS morphology and of the JK colors. In the following we use the morphologies, Spitzer data, and spectra to further investigate the nature of these sources.
Both candidates show very blue J–K colors and have –J1.9. This blue J–K color could be due to starburst galaxies or faint AGNs at z7 with a UV spectral slope (with at Å) that is more negative than . These colors are also typical of Galactic brown dwarf stars of type T6-8, as can be seen in Fig. 2.
In this section we present their properties in terms of the morphology in the optical and near-infrared images (Sect. 4.1), mid-infrared colors (Sect. 4.2), and optical spectra (Sect. 4.3).
| ID | R.A. (J2000) DEC. | J | Ks | ||
|---|---|---|---|---|---|
| 4419 | 03:32:38.8 | –27:49:53.7 | 25.10 | 23.27 | 24.17 |
| 6968 | 03:32:25.1 | –27:46:35.7 | 26.39 | 24.48 | 25.05 |


4.1 Morphologies
Both objects are detected in and J. We studied the morphology of these objects in both bands: the HST/ACS images have a much higher resolution (about 0.1″ FWHM), but both objects are much fainter in this band. In contrast, the VLT/ISAAC J band images have a lower resolution (about 0.45″), but the higher signal-to-noise ratio per pixel allows a more accurate study. In both cases we compared the object luminosity profile with the PSF derived from a few nearby point sources. As shown in Fig. 4, both objects are consistent with being point sources, as no significant differences are seen with the local PSF.
4.2 Spitzer colors
The near- to mid-IR colors can be used to investigate the nature of these objects. Young starburst galaxies at are expected to be intrinsically quite blue and show a flat spectrum above the Lyman limit. We computed the photometry of our candidates in the Spitzer/IRAC and images using 3″ apertures, in order to have aperture corrections similar to the those in the K band, i.e., about 0.42 mag (see, for example, Eyles et al. 2005) and to compare the results with the near-IR data. To compute the photometry of object 4419, the contribution by the nearby bright galaxy was estimated by convolving the band image with the Spitzer PSF. This introduces a large additional uncertainty. Figure 5 shows the J–K vs. K–4.5m and 3.6–4.5m color-color diagrams, comparing the colors of both candidates with those of the Galactic stars (derived from the brown dwarf models by Allard et al. 2001) and of high-redshift galaxies and type 1 AGNs (Seyfert 1 and QSOs, Francis & Koratkar, 1995). It is evident that these diagrams can be used to distinguish compact galaxies from stars. Even if the Spitzer flux of 4419 is uncertain, because it is affected by the nearby bright galaxy, it appears that both objects show colors compatible with being Galactic stars. The flux in the Spitzer bands of object 6968 was already discussed by Eyles et al. (2006), and they also concluded that they are compatible with being a Galactic brown dwarf.

). The two candidates fall in the region occupied by the brown dwarfs.
4.3 Optical spectra
The two candidates were observed for 5.0 hr with the FORS2 spectrograph on the ESO VLT in October 2005. The multi-slit facility allowed us to observe the two candidates together with other objects having either very faint counterparts in the band or colors above the selection threshold when measured by Sextractor (see Sect. 3). We used 1″ wide slits and the G600z grism, providing a dispersion of 1.6Å/pix and a resolution of about . The covered wavelength range was between 0.75 and 1.05m.
In all cases, no significant emission line and spectral break were detected in this wavelength range. It should be noted that an optical spectrum of object 4419 have already been obtained by Stanway et al. (2004b) with DEIMOS on the Keck-II telescope, but no spectral features were detected.
The emission-line detection limit was computed from the background noise. We obtain a 5 limiting magnitude for unresolved sources of about erg sec-1 cm-2 in the wavelength range 0.900-0.995m, corresponding to a redshift range for the Ly line of 6.4z7.2. This limit holds for the part of the wavelength range that is not covered by bright sky lines, which corresponds to about 88% of the total range. Such a sensitivity would be more than adequate to detect the Ly emission from star forming galaxies at these redshift. This flux can be estimated by assuming that the properties of the -dropout galaxies at z6 also holds at these higher redshifts. The spectroscopic observations of dropouts (Bunker et al. 2003; Stanway et al. 2004a; Dickinson et al. 2004) have shown that color-selected galaxy have Ly lines with rest-frame equivalent widths (EWs) of 20–30Å, corresponding to erg sec-1 cm-2 for the faintest of the two candidates, well above the detection limit. It should be noted that line-selected high-redshift galaxies show much larger EWs, on the order of 200Å (e.g., Malhotra & Rhoads 2002). Similar values are derived for high redshift AGNs: scaling the Ly fluxes in z6 quasars observed by Fan et al. (2003) and Maiolino et al. (2004) to the continuum luminosity of the current sample, we would obtain fluxes on the order of erg cm-2 sec-1.
As a conclusion, all of the four investigations presented above confirm the identification of both sources as Galactic stars. Also their luminosity is consistent with this identification: if they are brown dwarfs of type from T6 to T8, their absolute mag would be between M(J)=15.5 and M(J)=16.5 (Leggett et al. 2002), placing them between 200 and 700 pc from us. As a consequence, no z=7 object is present in the survey field above our detection limit.
5 Evolution of the luminosity function and of the cosmic star-formation density
The detection of no z7 objects in the field can be used to place an upper limit to the LF of these objects. To do this we need to accurately estimate the volume sampled by our survey. Two effects produce the dependence of this volume on the magnitude of the objects. First, fainter objects are detected in the (J+Ks) image only at lower redshifts; second, only lower limits of the –J color can be measured for objects selected in the (J+Ks) image and undetected in . This lower limit is above the selection threshold only for objects that are bright enough in the J band, while fainter objects can have a color limit below threshold.
The effective sampled volume can be computed as a function of the absolute magnitude of the objects using
| (1) |
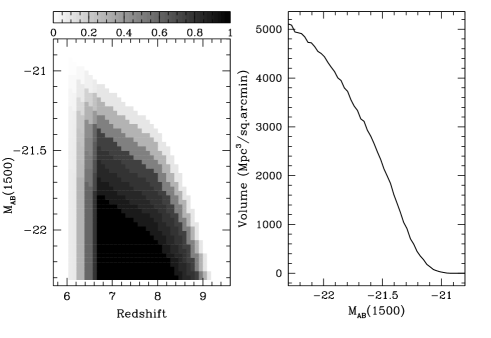
(Steidel et al. 1999; Stanway et al. 2003), where is the probability of detecting an object of magnitude at redshift z using the selection in Fig. 2, and is the comoving volume per unit solid angle at redshift z. The results of this computation are shown in Fig. 6.
The detection probability was obtained by computing the expected apparent magnitudes and colors of starburst galaxies (modeled as ) of varying intrinsic luminosity and spectral slope , placed at different redshifts. Figure 6 (left panel) shows the results of this computation. The redshift sensitivity of our selection method starts at about z=6.7, followed by a peak at z=7 and a shallow decrease towards high redshifts. By integrating this function over the redshift, we obtain the results in the right panel of Fig. 6.
The limiting apparent magnitude (25.5, see Sect. 2) corresponds, at z=7, to an absolute magnitude M(1500)=–21.4. Using the standard relation between UV luminosity and SFR (Madau et al. 1998), this value corresponds to an SFR of 20M⊙/yr. This value is adequate for sampling the brighter part of the LF of LBG at any redshift. As an example, Stanway et al. (2003) found 9 -dropout galaxies at z6 with typical SFRs of 20–30 M☉/yr, while the SFR of galaxies in Bouwens et al. (2006) is 9 M⊙/yr. As a reference, the SFR corresponding to an L∗ galaxy in the sample by Steidel et al. (1996) is about 15–20 M☉/yr (Giavalisco, 2002; Stanway et al. 2003).
This volume can be used to estimate an upper limit to the density of objects at this redshift range. The limiting density for a given Confidence Level (CL) is given by
where is given by Eq. 1 and is the maximum number of objects in the field corresponding to the limiting density at the chosen CL (2.3 objects for CL=90%). Figure 7 shows the 1 upper limits to the density of objects, compared with the LF of the LBGs at z=6 from Bouwens et al. (2006) (a Schechter function with parameters =-20.25, =–1.73, and =0.00202 Mpc) and at z=3 obtained by Steidel et al. (2003). The LF at z=6 is still subject to large uncertainties because it is based on a compilation of 500 -dropouts coming from various fields with different limiting magnitudes. As a consequence, cosmic variance could have different effects in different parts of the LF. The faint-end slope is particularly uncertain, as it is based on faint objects observed at low signal-to-noise. At this signal level, many interlopers at lower redshift could be present in the sample, with the uncertainty on the color causing galaxies to scatter into the selection region, hence overestimating the number of faint sources. It should also be noted that the VVDS collaboration (Le Fevre et al. 2005; Paltani et al. 2006) studied the LF of the high-z galaxy population with 3z4 using a purely magnitude-selected spectroscopic sample, and found an unexpectedly large number of very bright galaxies, pointing toward the possibility that the color selection could be effected by large incompleteness.
Besides these uncertainties, it is evident that our upper limits indicate an evolution of the LF from z=6, even if only 170 Myr have passed since then. In the no-evolution case, in fact, we would expect to detect 5.5 objects, with a Poisson probability of no detection smaller than 0.5%. This is confirmed by the results in Bouwens et al. (2006) who detected 7 objects at z=6 in the same luminosity range in the same field, in good agreement with our expectations.
Using a CL=90% and assuming density evolution of the LF, we found that the normalization of the LF at z=7 must be at most 40% of that at z=6. The evolution of the LF from z=7 to z=6 could also be in luminosity rather than density, corresponding to a brightening of the objects with cosmic time rather than to an increase in their number. This could be a better approximation of the real evolution if the systems at higher redshifts tend to be smaller or less active than the corresponding systems at lower redshift. In this case the minimum evolution of the average luminosity compatible with our upper limits at CL=90% is about 0.22 mag. This evolution corresponds to a reduction of 20% in the total SFD, obtained by integrating the LF assuming a constant faint-end slope .
Very similar results are obtained if the LF at z=6 by Bunker et al. (2004) is used as a reference point. By analyzing a much smaller sample of LBGs, these authors found that the shift in the LF between z=3 and z=6 is consistent with density rather than luminosity evolution. Using this determination, the ratio SFD(z=7)/SFD(z=6) is about 0.3 for the luminosity evolution and 0.8 for the density evolution.
Our limits can be compared with the LF at z=3 (Steidel et al. 1999). Assuming luminosity evolution we obtain a shift of about 0.9 mag, corresponding to SFD(z=7)/SFD(z=3)=0.42, a reduction of more than a factor of 2. A pure density evolution would require SFD(z=7)/SFD(z=3)=0.05.
A strong reduction in the LF from z=6 to z=7 is consistent with the tentative detection of one -dropout LBG at z=7 in the HUDF by Bouwens et al. (2004b) as revised by Bouwens & Illingworth (2006).
| lg | lg SFDb | lg | lg SFDb | |
|---|---|---|---|---|
| z=3 c | 26.17 | –1.72 | 26.17 | –1.72 |
| z=6 d | 25.92 | –1.98 | 26.10 | –1.80 |
| z=7, lumin. evol. | 25.76 | –2.14 | 26.01 | –1.89 |
| z=7, dens. evol. | 25.52 | –2.37 | 25.70 | –2.20 |
: erg/sec/Hz/Mpc3 at 1500Å
: M⊙/yr/Mpc3
: Steidel et al. (1999)
: Bouwens et al. (2006)
6 The evolution of the star formation activity
These findings on the relative evolution of the SFD can be compared with the results from other studies at lower and higher redshifts. The UV luminosity density can be converted to SFD by using the Madau et al. (1998) ratio. Our upper limits to the density of galaxies at z=7 with (J+Ks)25.5 can be directly converted into an upper limit to the SFD contained in galaxies with M–21.44, which turns out to be about 30% of that at z=6 and 5% of that at z=3. As a consequence, our data show a strong reduction in SF activity in bright galaxies.
In Fig. 8 we show the values of the SFD obtained by integrating the observed LFs above a given luminosity threshold. The most interesting quantity, the total SFD at each redshift, would be obtained by using a very low luminosity threshold. Unfortunately, this would introduce large uncertainties due to the unobserved part of the LF at low luminosities. For example, Steidel et al. (1999) observe their LBGs at z=3 down to 0.1, while for their value of the faint-end slope of the LF (), about half of the total SFD takes place in galaxies below this limit. This implies that a correction of about a factor of two is needed to obtain the total SFD from the observed part of the LF. As for , the integral of the LF no longer converges, and this correction becomes even larger for more negative values of : it is 2.4 for (as in Bouwens et al. 2006) and even 6 for , the most negative value of compatible with the i-dropouts in Bouwens et al. (2006). To avoid this additional uncertainty, it is common to refer to the SFD derived from galaxies that where observed directly or by using a small extrapolation of the LF. For the value at z=7, we plot the average between the two extremes of pure luminosity and pure density evolution, while the upper value corresponds to pure luminosity evolution.
The two panels of Fig. 8 show the SFD as obtained by integrating the observed LFs with two different lower limits. In the upper panel we show the results when considering, at any redshift, the same range of absolute magnitudes (-19.32), i.e., limiting the luminosity to above 20% of the magnitude derived by Steidel et al. (1999) for their LBGs at z=3 (). The derived SFD is directly related to the total SFD in the case of pure density evolution, as the fraction of SFD from galaxies below the threshold would be constant. The use of the absolute limits of integration is very common (see, for example, Bouwens et al. 2006; Shiminovich et al. 2005). The resulting SFD appears to vary rapidly, increasing by more than a factor of 30 from z=0.3 to z=3 and then decreasing by a factor of 2.2 to z=6 and 4 to z=7.
In the case of luminosity evolution, the use of a constant limit of integration results in considering a variable fraction of LF. For example, Arnouts et al. (2005) measured the UV LF at low redshift and found a strong luminosity evolution, with =–18.05 at z=0.055 and =–20.11 at z=1.0. In this case, at low redshift the limit of integration used above (–19.32) is even brighter than and only a small fraction of the LF is integrated to obtain a value of the SFD. This is the reason that the upper panel of Fig. 8 shows such a strong evolution at low redshift. In the lower panel of Fig. 8, we use a variable limit of integration, set to be at each redshift. This is more suitable to reproducing the total cosmic SFD, as the luminosity evolution appears to dominate both at low (Arnouts et al. 2005) and at high redshifts (Bouwens et al. 2006). In this case, the obtained evolution is much milder with an increase of a factor of 5 from z=0.3 to z=3 and a decrease of 1.4 to z=6 and 2.5 to z=7. The resulting values of the UV luminosity density and of the SFD are listed in Table 2 for both limits of integration.


7 Discussion
The search for galaxies at even higher redshift, z8, by looking for J-dropout galaxies, faces another problem. The absence of deep enough data at wavelengths longer than Ks make it impossible to select galaxies with the standard color-color technique, and the selection relies on the J–Ks color alone. As a consequence, this technique is prone to the presence of many interlopers, and the constraints on the SFD at these redshifts are correspondingly weaker. Bouwens et al. (2005) looked for z10 galaxies by selecting J-dropouts in a deep HST/NICMOS field down to H28. They detected 3 candidates, one of which is considered reliable. It is currently not possible to investigate the nature of these 3 objects in greater detail. This fact spoils the possibility of using this result to put constraints on the SFD at z=10, which is only constrained not to be larger than at z=6. For this reason our results are broadly consistent with these limits.
On the contrary, our results are not consistent with the high value of the SFD derived at z=6–10 by Richard et al. (2006). They measure a value of the SFD higher than at z=3, but they also warn against measuring SFD by using strongly clustered fields.
Even if the survey area is quite large for the obtained magnitude limits (25 times larger than the Hubble Deep Field, for example), the cosmic variance is still a potentially important concern. From the cross-correlation of the galaxies at this magnitude range it is possible to estimate (see, for example, Cresci et al. 2006) that the observed density can vary by about 20% of the cosmic average because of this effect. Similar results were obtained by Somerville et al. (2004) on the basis of cosmological simulations. As a consequence, cosmic variance is not expected to be a dominant effect.
All the data in Fig. 8 are derived from UV observations and, as a consequence, they are very sensitive to dust extinction, as discussed by a large number of authors (see, for example, Meurer et al. 1999). Variation in the dust content along the cosmic age is one of the effects that could contribute to shaping the observed evolution of the SFD. The typical color of z=6 LBGs, represented by the UV spectral slope , is bluer at z=6 ( according to Bouwens et al. 2006, revised to by Bouwens & Illingworth 2006 when using the new NICMOS zero points, and for Stanway et al. 2005) than at z=3 (, Meurer et al. 1997, or , Adelberger & Steidel 2000), pointing towards a reduction in average extinction at high redshift of about a factor of two. As a consequence, the observed reduction in the SFD cannot be due to an increase of the dust content. Actually, considering this effect would make the increase of SFD with cosmic time even more pronounced.
As we observe the bright part of the LF, we cannot exclude that the reduction in the number density of bright galaxies is not associated with an increase in that of the faint galaxies. If, for example, both and vary together so that remains constant, the resulting total SFD also remains constant. We cannot exclude this effect, even if the upper limits to the galaxies with from Bouwens et al. (2004b) tend to exclude this possibility.
8 Consequences on reionization of the primordial universe
It is widely accepted that high redshift starburst galaxies can contribute substantially to the reionization of the universe. Madau et al. (1999) (see also Bunker et al. 2004) estimated the amount of star formation needed to provide enough ionizing photons to the intergalactic medium. By assuming an escape fraction of the photons of 0.5 and a clumping factor of 30 (Madau et al. 1999), we find that at z=7 the necessary SFD is
The observed total amount of SFD derived from UV observations can be derived by integrating the observed LF down to zero luminosity. Assuming luminosity evolution and integrating the LF down to , we obtain
where about half of this comes in very faint systems, below 0.1. This value can be be increased up to assuming the steeper faint-end slope on the LF () compatible with the data in Bouwens et al. (2006).
The uncertainties involved in this computation (as the actual values of and , the amount of evolution of the LF between z=6 and z=7, the faint-end slope of the LF) are numerous and large for both SFD(needed) and SFD(observed). Also, Stiavelli, Fall & Panagia (2004) discuss how very metal-poor stars can overproduce ionizing photons and how a warmer IGM could lower the required flux. Nevertheless, the amount of ionizing photons that can be inferred at z=7 from observations is less or, at most, similar to the needed value. A measure of the SFD at even higher redshifts or tighter constraints to the faint-end slope of the LF at z=6 can significantly reduce these uncertainties and can easily reveal that it falls short of the required value.
9 Conclusions
The existing multi-wavelength deep data on the large GOODS-South field allowed us to search for z=7 star-forming galaxies by selecting -dropouts. The accurate study of the dropouts in terms of colors, morphology, and spectra allows us to exclude the presence of any z=7 galaxy in the field above our detection threshold. We used this to derive evidence for the evolution of the LF from z=7 to z=6 to z=3, and to determine an upper limit to the global star formation density at z=7. These limits, together with the numerous works at lower redshifts, point toward the existence of a sharp increase of the star formation density with cosmic time from z=7 to z=4, a flattening between z=4 and z=1, and a decrease afterward. The ionizing flux from starburst galaxies at z=7 could be too low to produce all the reionization.
The first star forming systems at z=7 appear to be too faint to be studied in detail with the current generation of telescopes, and the detailed comprehension of their properties will be possible when the telescopes of the next generation come into use.
Acknowledgements.
We are grateful to R. Bouwens for useful discussion and for having provided the catalog of his -dropouts before publication, and to the referee, A. Bunker, for very useful comments on the first version of the paper. We also thank the Paranal staff for service observing and assistance during visitor observations, and L. Testi for useful discussions about brown dwarfs.References
- (1) Adelberger, K. L., & Steidel, C. C., 2000, ApJ, 544, 218
- (2) Allard, F., Hauschildt, P. H., Alexander, D. R., Tamanai, A., & Schweitzer, A., 2001, ApJ 556, 357
- (3) Alvarez, M. A., Shapiro, P. R., Ahn, K. & Iliev, I. T., 2006, ApJL, 644, L101
- (4) Arnouts, S., Shiminovich, D., Ilbert, O., et al., 2005, ApJ, 619, L43
- (5) Becker, R. H., Fan, X., White, R. L., et al., 2001, AJ, 122, 2850
- (6) Bertin, E. & Arnouts, S., 1996, A&AS, 117, 393
- (7) Bolzonella, M., Miralles, J.-M., & Pelló, R., 2000, A&A 363, 476
- (8) Bouwens, R. J., Illingworth, G. D., Thompson, R. I., et al., 2004a, ApJ 606, 25
- (9) Bouwens, R. J., Thompson, R. I., Illingworth, G. D, et al., 2004b, ApJ 616, 79
- (10) Bouwens R. J., Illingworth, G. D., Thompson, R. I., & Franx, M., 2005, ApJ 642, 5
- (11) Bouwens, R. J., & Illingworth, G. D., 2006, Nature, in press (astro-ph/0607087)
- (12) Bouwens, R. J., Illingworth, G. D., Blakeslee, J. P., & Franx, M. 2006, in press (astroph/0509641)
- (13) Bruzual, G. & Charlot, S., 2003, MNRAS, 344, 1000
- (14) Bunker, A., Stanway, E., Ellis, R., McMahon, G., & McCarthy, P. J., 2003, MNRAS, 342, L47
- (15) Bunker, A., Stanway, E., Ellis, R., & McMahon, G., 2004, MNRAS, 355, 374
- (16) Cardelli, J. A., Clayton, G. C., & Mathis, J., S., 1989, ApJ, 345, 245
- (17) Cen, R., Haiman, Z., & Mesinger, A., 2005, ApJ, 621, 89
- (18) Cowie, L. L., Songaila, A., Hu, E. M., & Cohen, J. G., 1996, AJ, 112, 839
- (19) Cresci, G., et al., 2006, in press
- (20) Dahn, C. C., Harris, H. C., Vrba, F. J., et al., 2002, AJ, 124, 1170
- (21) Dawson, S., Stern, D., Bunker, A. J., Spinrad, H., & Dey, A., 2001, AJ 122, 598
- (22) Dickinson, M., Stern, D., Giavalisco, M., Ferguson, H. C, et al., 2004, ApJ, 600, L99
- (23) Dunlop, J. S., Cirasuolo, M., McLure, R. J., 2006, submitted to MNRAS (astro-ph/0606192)
- (24) Eyles, L., Bunker, A., Ellis, R., Stanway, E., Lacy, M., Ellis, R., & Doherty, M., 2005, MNRAS, 364, 443
- (25) Eyles, L., Bunker, A., Ellis, R., Lacy, M., Stanway, E., Stark, D., & Chiu, K., 2006, submitted (astroph/0607306).
- (26) Fan, X., Narayanan, V. K.; Lupton, R. H., et al., 2001, AJ, 122, 2833
- (27) Fan, X., Narayanan, V. K.; Strauss, M. A., et al., 2002, AJ, 123, 1247
- (28) Fan, X., Strauss, M. A., Schneider, D. P., et al., 2003, AJ, 125, 1649
- (29) Francis, P. J., & Koratkar, A., 1995, MNRAS, 274, 504
- (30) Giavalisco, M., 2002, ARA&A, 40, 579
- (31) Giavalisco, M., et al., 2004a, ApJ, 600, L93
- (32) Giavalisco, M., et al., 2004b, ApJ, 600, L103
- (33) Gnedin, N. & Prada, F., 2004, ApJ, 608, L77
- (34) Grazian, A., Fontana, A., De Sanctis, C., et al., 2006, A&A, 453, 507
- (35) Gunn, J. E.; Peterson, B. A., 1965, ApJ, 142, 1633
- (36) Hopkins, A. M., 2004, ApJ, 615, 209
- (37) Hopkins, A. M., & Beacom, J. F., 2006, in press (astro-ph/0601463)
- (38) Hu et al., 1996, Nature, 382, 231
- (39) Hu et al., 1999, ApJ, 522, L9
- (40) Hu et al., 2002, ApJ, 568, L75
- (41) Kodaira, K.; Taniguchi, Y.; Kashikawa, N., et al., 2003, PASP, 55, L17
- (42) Leggett, et al., 2002, ApJ 564, 452
- (43) Labbé, I.; Franx, M., Rudnick, G.; et al., 2003, AJ, 125, 1107
- (44) Le Fèvre, O., Paltani, S., Arnouts, S., et al., 2005, Nature, 437, 519
- (45) Loeb, A., et al., 2005, ApJ, 62, 553
- (46) Mannucci, F., Basile, F., Poggianti, B. M., Cimatti, A., Daddi, E., Pozzetti, L., & Vanzi, L., 2001, MNRAS, 326, 745
- (47) Maiolino, R., Oliva, E., Ghinassi, F., Pedani, M., Mannucci, F., Mujica, R., & Juarez, Y., 2004, A&A, 420, 889
- (48) Madau, P., et al., 1998, ApJ 498, 106
- (49) Madau, P., Haardt, F., Rees, M., 1999, ApJ, 266, 713
- (50) Malhotra, S., & Rhoads, J. E., 2002, ApJ, 565, L71
- (51) Mobasher, B., et al., 2005, ApJ, 635, 832
- (52) Meurer, G. R., Heckman, T. M., Lehnert, M. D., Leitherer, C. & Lowenthal, L., 1997, AJ, 114, 54
- (53) Meurer, G. R., Heckman, T. M., & Calzetti, D., 1999, ApJ, 521, 64
- (54) Ouchi., M., Shimasaku, K., Okamura, S., et al., 2004, ApJ 611, 660
- (55) Paltani, S., Le Fevre, O. , Ilbert, O., et al., 2006, submitted to A&A (astro-ph/0608176)
- (56) Pentericci, L. et al., 2002, AJ 123, 2151
- (57) Richard, J., Pelló, R., Schaere, D., Le Borgne, J.-F., & Kneib, J.-P., 2006, in press (astro-ph/0606134)
- (58) Ricotti, M. et al., 2004, MNRAS, 352, L21
- (59) Shiminovich, D., Ilbert, O., Arnouts, S., et al., 2005, ApJ, 619, L47
- (60) Shimasaku, K., et al., 2005, PASJ, 57, 447
- (61) Somerville, R. S., Lee, K., Ferguson, H. C., Gardner, J. P., Moustakas, L. A., & Giavalisco, M., 2004, ApJ, 600, L171
- (62) Spinrad, H., Stern, D., Bunker, A., et al., 1998, AJ 116, 2617
- (63) Stanway, E. R., Bunker, A. J., & McMahon, R. G., 2003, MNRAS, 342, 439
- (64) Stanway, E. R., et al., 2004a, ApJ, 604, L13
- (65) Stanway, E. R., Bunker, A. J., McMahon, R. G., Ellis, R. S., Treu, T. & McCarthy, P. J., 2004b, ApJ, 607, 704
- (66) Stanway, E. R., McMahon, R. G., & Bunker, A. J., 2005, MNRAS, 359, 1184
- (67) Steidel, C. C., et al., 1996, ApJ, 462, L17
- (68) Steidel, C. C., et al., 1999, ApJ, 519, 1
- (69) Steidel, C. C., et al., 2003, ApJ, 592, 728
- (70) Stiavelli, M., Fall M., & Panagia, N., 2004, ApJ, 610, 1
- (71) Taniguchi, Y.; Ajiki, M.; Nagao, T., et al., 2005, PASP, 57, 165
- (72) Testi, L., et al., 2001, ApJ 552, 147