Precise Radial Velocities of Giant Stars
II. Pollux and its Planetary Companion
Abstract
It has long been speculated that the observed periodic radial velocity pattern for the K giant Pollux might be explained in terms of an orbiting planetary companion. We have collected 80 high-resolution spectra for Pollux at Lick Observatory yielding precise radial velocities with a mean error of 3.8 m/s, providing the most comprehensive and precise data set available for this star. Our data confirm the periodicity previously seen in the radial velocities. We derive a period of 589.73.5 days and, assuming a primary mass of 1.86 M⊙, a minimum companion mass of 2.90.3M, consistent with earlier determinations. No evidence for any periodicities is visible in our analysis of the shapes of the spectral lines via the bisector method, so that we conclude that evidence is accumulating and compelling for a planet around Pollux. However, some last doubt remains about this interpretation, because non-radial pulsations which might be present in giant stars could in principle also explain the observed radial velocities, while the accompanying bisector variations might be too small to be detectable with current data.
1 Introduction
Pollux ( Gem, HR 2990, HD 62509, HIP 37826) is one of the brightest stars in the sky (V=1.16 mag) and has been observed extensively in the past. Fundamental parameters from a detailed model atmosphere analysis of the spectrum have e.g. been provided by Drake & Smith (1991), and it is usually classified as K0IIIb star (Keenan & McNeil, 1989). The parallax determined by Hipparcos results in a distance of 10.30.1 pc. In the Hipparcos Catalogue Pollux was flagged as a possible micro-variable with a photometric amplitude of less than 0.03 mag (but no obvious periodicity), as well as a possibly non-single star, maybe because of slightly different astrometric solutions from the two different data reduction consortia.
Walker et al. (1989) were the first to report significant radial velocity (RV) variations for Pollux, with a standard deviation of 26 m/s around the mean from RV measurements spread over about five years. Though they noted that based on a periodogram analysis significant periodicity was present in the data, they did not quote any period. Only after having monitored Pollux extensively over twelve years with a typical RV precision of 10–20 m/s, Larson et al. (1993) published a RV period of 584.653.3 days and discussed possible reasons for the observed periodicity. Possible explanations include an orbiting planetary companion or rotational modulation of surface features. The latter hypothesis was supported by a slight indication in the data for a periodicity in the equivalent width index data of the 8662Å (Ca ii) line with about the same period as found in the radial velocities, but with a very low amplitude and only a marginal statistical significance.
Finally, Hatzes & Cochran (1993) presented again strong evidence for a periodicity in the radial velocities with a period of 558 days. The spectra were taken over a period of 3.5 years, and the typical RV accuracy was 20 m/s. The RV variations were consistent in amplitude and phase with the older data by Walker et al. (1989).
Here we present again precise radial velocity measurements of Pollux which leave no doubt about a periodicity, determined from our data to 589.7 days. This RV set is the most comprehensive and precise one taken so far for this star, spanning almost six years. From the first measurements of Walker in 1981 to the latest ones by us in 2006, this adds up to 25 years of RV monitoring for Pollux, with no evidence for a change in phase or amplitude of the almost sinusoidal variations. Along with no detectable variations in the spectral line shapes, our data set thus lends further evidence for the companion hypothesis.
In Section 2, we describe our observations which are part of a larger program of monitoring giant stars for periodic RV changes and present our orbital fit to the RV data. In Section 3, we analyze the spectral line shapes with the help of the bisector method, and in Section 4 we present a discussion and our final conclusions.
2 Observations
| Parameter | Value |
|---|---|
| Period [days] | |
| [JD-2 450 000] | |
| Eccentricity | |
| [deg] | |
| [M]aaThe companion mass error does not include the uncertainty in the stellar mass. | |
| Semi-major axis [AU] | |
| RV semi-amplitude [m s-1] | |
| Reduced | 6.3 |
| rms scatter around fit [m s-1] | 9.0 |
The observations were carried out as part of a larger program measuring precise radial velocities of several hundred G and K giant stars at Lick Observatory. The early objectives of this program have been described in Frink et al. (2001), and the first substellar companion from the survey (around the K giant Dra) was announced in Frink et al. (2002). Hekker et al. (2006) characterize the giant stars with the most stable radial velocities in our survey, and Mitchell et al. (2007) present evidence for four more K giant stars harboring one or more substellar companions.
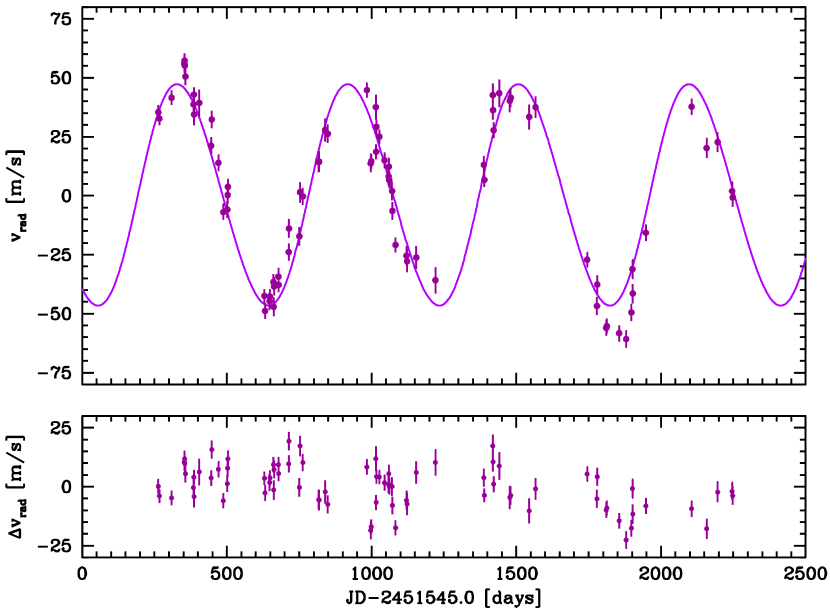
As part of this ongoing program, we have obtained 80 spectra for Pollux covering about 5.5 years. All observations were taken using the Hamilton High Resolution Echelle Spectrograph (R60 000 at 6000 Å) at Lick Observatory, attached to the 0.6 m Coudé Auxiliary Telescope (CAT). Typical exposure times were 1.5 minutes for Pollux, yielding a S/N of up to 200. However, some observations were taken with cloud cover, where exposure times can be considerably longer and the S/N somewhat smaller (around 150). The individual radial velocities, obtained as described in Butler et al. (1996), are listed in Table 2, along with their formal errors. Figure 1 shows the measurements together with a Keplerian fit to the data; the orbital elements are listed in Table 1. There is no doubt about the clear periodicity in the data, as has already been observed by Walker et al. (1989), Larson et al. (1993) and Hatzes & Cochran (1993).
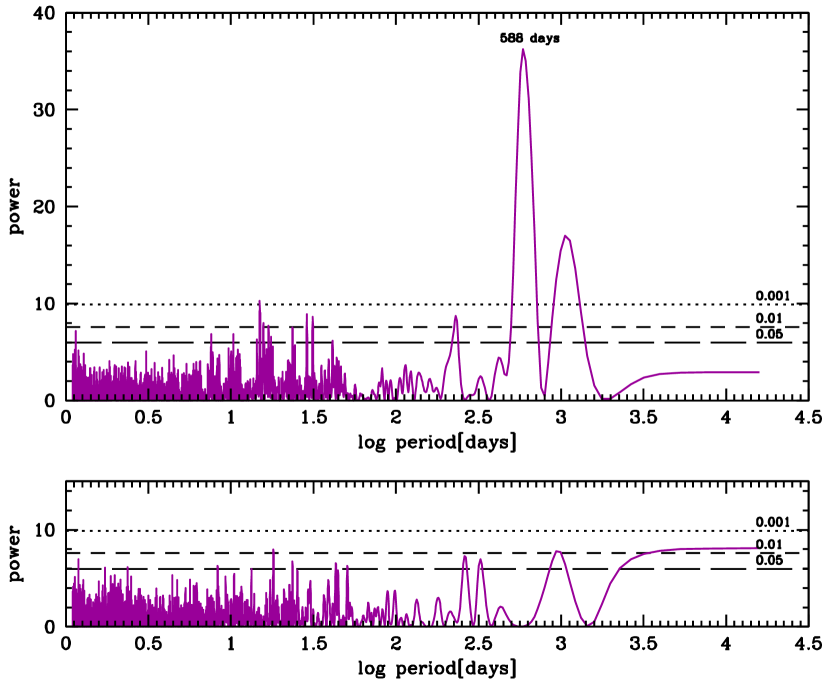
Nevertheless, there is some additional scatter at a level of 9 m/s present in the data, which is larger than expected based on the formal measurement errors. It is possible that this stems from radial pulsations, but with the theoretical period for the fundamental mode shorter than 1 day (Hatzes & Cochran, 1993) our sampling is inadequate to provide any further constraints. Solar-like oscillations in late G giants have been found by Frandsen et al. (2002) and de Ridder et al. (2006), and it is not unreasonable to assume that similar oscillations in Pollux are responsible for the excess jitter. The amplitude however is not large enough to affect the derivation of the orbital parameters of the putative companion. Furthermore, there are no indications for any additional periodicities, as can be seen in the lower part of Fig. 1 where the orbital fit has been subtracted from the data, and the corresponding Lomb-Scargle periodogram in the lower part of Fig. 2.
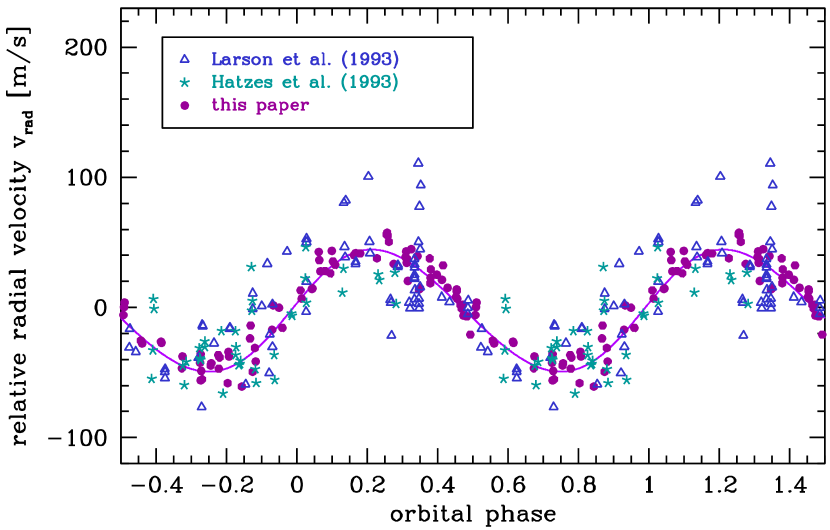
Our period for the orbital fit is 589.73.5 days and compares very well with the value of Larson et al. (1993) (584.653.3 days), while it is somewhat larger than the period derived by Hatzes & Cochran (1993) (5548 days). All previous measurements are consistent in amplitude and phase with our result; Fig. 3 shows a phased plot of our measurements along with the earlier ones by Larson et al. (1993) and Hatzes & Cochran (1993). (Note that we measure only relative radial velocities with an arbitrary zero point, so that a vertical shift had to be applied before plotting them along with the other data sets. This vertical shift is a free parameter in our fit; its formal error is 1.1 m/s and should be negligible for the comparison.) A combined fit to all RV data produces very similar orbital parameters as a fit to our RV data alone; the period from the combined fit is larger by 1.6 days as compared to the period quoted in Table 1 based on our RV data alone, very well within the formal error.
The minimum companion mass derived from our orbital fit is 2.9 M assuming a stellar mass for Pollux of 1.86 M⊙. The stellar mass was derived from the location of the star in the color-magnitude diagram as determined from Hipparcos data and compared to the evolutionary tracks from Girardi et al. (2000). Solar metallicity was assumed for the comparison, which is a good approximation (Drake & Smith, 1991). Allende Prieto & Lambert (1999) derive a value of 1.7 M⊙ for the mass of Pollux with a very similar method as described above, and Drake & Smith (1991) also derive a mass of 1.7 M⊙ from a detailed model atmosphere analysis. Using this value for the stellar mass would yield a minimum mass of 2.7 M. The error on the minimum companion mass due to the error in the knowledge of the primary mass is thus about 0.2 M, so that the total error (including the formal error derived from the orbital fit, see Table 1) amounts to about 0.3 M.
Together, the radial velocities cover about 25 years, and the variations have been rather consistent over that time. Nevertheless, though we consider the interpretation of the observed RV changes as the result of an orbiting companion likely, it is possible that another mechanism might cause the observed RV variations. In Chapter 3, we take a closer look at the spectral line shapes which might provide further hints at the underlying mechanism.
3 Line Shape Analysis
In order to investigate whether the observed RV variations are caused by a shift of the spectral lines as a whole (as expected in the presence of a companion) or by a change in the symmetry of the spectral lines giving rise to a net change in RV (as expected in the presence of pulsations), bisectors of the cross correlation profile have been analyzed. We used all spectral lines between about 6540 Å and 9590 Å from 29 spectral orders and obtained an average line profile by correlation with a synthetic template which was obtained from the VALD database (Kupka et al., 1999, available at http://ams.astro.univie.ac.at/vald/), matching the effective temperature and surface gravity of Pollux. The spectral range from about 5000 Å to 5800 Å could not be used because it is affected by iodine lines, and the spectral range around 6300 Å was avoided because it is dominated by strong telluric oxygen lines (which give rise to a spurious one year period when included in the analysis). Otherwise, as many lines as possible from a continuous spectral range were used, since it is known (Gray, 1983, 1984) that different lines in the same star can display different bisector behavior.
For the cross correlation with the synthetic template, our individual spectra had to be wavelength-calibrated, for which we used the Thorium-Argon exposure which was taken closest in time to each spectrum, either from the beginning or end of the night. Altogether, about 1110 spectral lines with theoretical depths between 0.1 and 0.9 were used for the cross correlation. Of course many blended lines are included in the cross correlation, but by using many lines we are confident that the effects average out. Furthermore, as long as the same lines are used for all observations, and only variations in the shape are of interest, blends by stellar lines do not affect the final result.
After having obtained the cross correlation profiles, we determined bisectors by stepping down the blue side of the profile, linearly interpolating the line depth at the red side for the same flux level as observed at the blue side (in the center of the profile, a parabolic fit was used instead of the linear one), and derived the midpoints between the velocities on the blue and red side of the profile. The connection of midpoints determined in this way is the bisector; see Povich et al. (2001) for more details on the method.
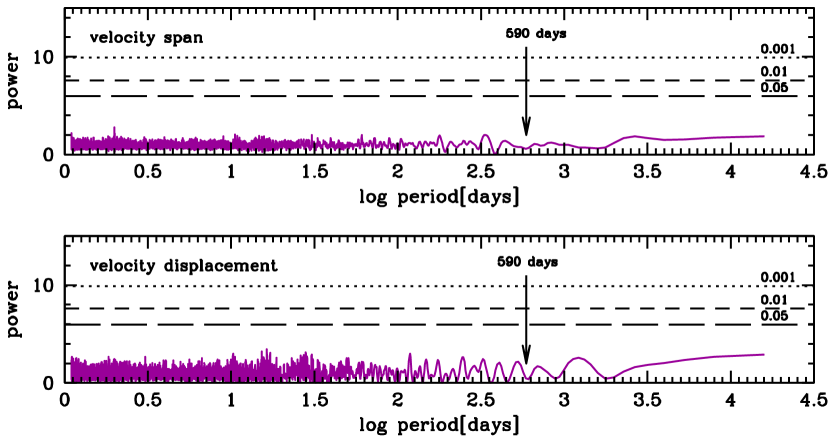
In order to analyze possible variations in the bisector, two quantities are defined which characterize its shape: the velocity span and the velocity displacement. While the bisector span is the difference between the width of the bisector at two different flux levels (30% and 75% were used here), the velocity displacement is the average width of the bisector at three different flux levels (30%, 60% and 75% were used).
Periodograms of both quantities are shown in Fig. 4. No significant periods whatsoever are present in these periodograms; all trial periods have extremely small significance levels. In particular, no peak is present at the RV period, so that we conclude that there is no evidence for any variations in the shapes of the spectral lines in our Pollux spectra.
This finding is consistent with the one by Hatzes & Cochran (1998), who also analyzed the bisectors of two different spectral lines in their Pollux data without discovering any periodicities similar to the RV period (they used 554 days). However, they caution that low-order non-radial pulsation modes, which might be able to account for the observed RV variations, might produce changes in the bisector velocity span of only 5 to 20 m/s. While we estimate the errors in a single bisector velocity span to lie between 50 and 100 m/s in our analysis (50 m/s in the analysis of Hatzes & Cochran (1998)), the sensitivity to a real periodic signal in the data increases if one uses a large number of spectra for the periodogram, to about the relevant level. However, we conclude that non-radial pulsation cannot be completely ruled out with the observational material or analysis methods currently available.
4 Conclusions
The presently available data on Pollux are all compatible with an orbiting substellar companion around this bright and nearby star. The minimum mass of the companion is 2.90.3 M, which makes it most likely a planet and not a brown dwarf. From the non-detection of the companion in the Hipparcos data, one can derive an upper limit on the companion mass, since it would have been detected by Hipparcos if it had been massive enough. The lower limit on the inclination which we derive from Hipparcos is about 5°, which translates into an upper mass limit of 33 M, constraining the companion to be of substellar nature (if the companion interpretation of the RV pattern is correct). Its period is 589.73.5 days, and it orbits at a distance of 1.690.03 AU from the star in an almost circular orbit. The RV pattern has been stable over the last 25 years. An analysis of the spectral line shapes shows no evidence for any changes with the RV period nor any other periods, which one might expect in the presence of pulsations. Hipparcos has picked up excess scatter in the astrometric standard solution (without companion), but it is unlikely that this is the signature of the planetary companion, since its expected minimum astrometric signature is only 50 as.
Detailed theoretical predictions of the expected amount of bisector asymmetry in the presence of non-radial g- or r-mode pulsations in giant stars are currently not available. However, the numerical simulations conducted by Hatzes (1996) show that it is in principle possible to explain the observed RV variations in Pollux by low-order non-radial pulsation modes, while the accompanying bisector variations would be too small to be detected with current techniques (Hatzes & Cochran, 1998). This is the main reason why some last doubt remains about the interpretation of the RV variations in terms of an orbiting companion, even if it would be a bit surprising to find only one single long-period pulsation mode. Note that the small eccentricity which we find (0.060.04) is barely significantly different from zero, so that it cannot be used to rule out pulsations as the reason for the observed RV variations as has been done for highly eccentric giant star orbits (Frink et al., 2002).
In contrast to that, rotational modulation of starspots can be excluded as the reason for the observed RV changes, since otherwise some photometric variability larger than the micro-variability actually seen should have been detected by Hipparcos. Also, it would be difficult to explain how a single or several starspots could produce RV variations which are so close to sinusoidal over the rotation period as well as stable over the last 25 years.
We conclude that while evidence is accumulating and compelling for an orbiting planet around Pollux, the final confirmation has to await a theoretical prediction of the amount of spectral line asymmetry in the presence of non-radial g- or r-mode pulsations in giant stars, much increased sensitivity in bisector analyses or photometry or the detection of the companion with independent techniques like e.g. precise astrometry.
After this paper was first submitted we learned of the similar paper by Hatzes et al. (2006). Hatzes et al. (2006) present 55 new radial velocity measurements of Pollux with mean internal errors between 11 and 17 m/s taken between 1998 and 2006 and analyze them together with the older datasets by Larson et al. (1993) and Hatzes & Cochran (1993) also used in the present paper. Their orbital elements are in excellent agreement with the ones derived in the present paper, and both papers arrive at the same conclusions regarding the interpretation of the observed RV periodicity in terms of an orbiting planetary companion.
http://ams.astro.univie.ac.at/vald/.
References
- Allende Prieto & Lambert (1999) Allende Prieto, C., & Lambert, D. L. 1999, A&A, 352, 555
- Butler et al. (1996) Butler, R. P., Marcy, G. W., Williams, E., McCarthy, C., Dosanjh, P., & Vogt, S. S. 1996, PASP, 108, 500
- de Ridder et al. (2006) de Ridder, J., Barban, C., Carrier, F., Mazumdar, A., Eggenberger, P., Aerts, C., Deruyter, S., & Vanautgaerden, J. 2006, A&A, 448, 689
- Drake & Smith (1991) Drake, J. J., & Smith, G. 1991, MNRAS, 250, 89
- Frandsen et al. (2002) Frandsen, S., et al. 2002, A&A, 394, L5
- Frink et al. (2001) Frink, S., Quirrenbach, A., Fischer, D., Röser, S., & Schilbach, E. 2001, PASP, 113, 173
- Frink et al. (2002) Frink, S., Mitchell, D. S., Quirrenbach, A., Fischer, D. A., Marcy, G. W., & Butler, R. P. 2002, ApJ, 576, 478
- Girardi et al. (2000) Girardi, L., Bressan, A., Bertelli, G., & Chiosi, C. 2000, A&AS, 141, 371
- Gray (1983) Gray, D. F. 1983, PASP, 95, 252
- Gray (1984) Gray, D. F. 1984, PASP, 96, 382
- Hatzes & Cochran (1993) Hatzes, A. P., & Cochran, W. D. 1993, ApJ, 413, 339
- Hatzes (1996) Hatzes, A. P. 1996, PASP, 108, 839
- Hatzes & Cochran (1998) Hatzes, A. P., & Cochran, W. D. 1998, ASP Conf. Ser. 134: Brown Dwarfs and Extrasolar Planets, 134, 312
- Hatzes et al. (2006) Hatzes, A.P., Cochran, W.D., Endl, M., Guenther, E.W., Saar, S.H., Walker, G.A.H., Yang, S., Hartmann, M., Esposito, M., Paulson, D.B. 2006, accepted by A&A
- Hekker et al. (2006) Hekker, S., Reffert, S., Quirrenbach, A., Mitchell, D. S., Fischer, D. A., Marcy, G. W., Butler, R. P. 2006, accepted by A&A
- Keenan & McNeil (1989) Keenan, P. C., & McNeil, R. C. 1989, ApJS, 71, 245
- Kupka et al. (1999) Kupka, F., Piskunov, N., Ryabchikova, T. A., Stempels, H. C., & Weiss, W. W. 1999, A&AS, 138, 119
- Larson et al. (1993) Larson, A. M., Irwin, A. W., Yang, S. L. S., Goodenough, C., Walker, G. A. H., Walker, A. R., & Bohlender, D. A. 1993, PASP, 105, 825
- Mitchell et al. (2007) Mitchell, D.S., Reffert, S., Quirrenbach, A., Fischer, D. A., Marcy, G. W., Butler, R. P. 2007, in preparation
- Povich et al. (2001) Povich, M. S., Giampapa, M. S., Valenti, J. A., Tilleman, T., Barden, S., Deming, D., Livingston, W. C., & Pilachowski, C. 2001, AJ, 121, 1136
- Walker et al. (1989) Walker, G. A. H., Yang, S., Campbell, B., & Irwin, A. W. 1989, ApJ, 343, L21
| JDaaJulian date - 2 450 000 [days] | [m s-1] | [m s-1] |
|---|---|---|
| 1808.039 | 3.1 | |
| 1812.039 | 2.9 | |
| 1854.073 | 3.1 | |
| 1898.060 | 3.8 | |
| 1898.940 | 3.1 | |
| 1899.899 | 3.2 | |
| 1901.898 | 3.7 | |
| 1929.819 | 3.5 | |
| 1930.893 | 3.2 | |
| 1931.723 | 4.5 | |
| 1949.771 | 5.7 | |
| 1990.667 | 3.3 | |
| 1992.693 | 3.8 | |
| 2015.697 | 3.2 | |
| 2032.681 | 3.3 | |
| 2046.656 | 3.6 | |
| 2047.657 | 3.7 | |
| 2048.659 | 3.5 | |
| 2175.055 | 2.9 | |
| 2177.047 | 3.3 | |
| 2193.021 | 3.6 | |
| 2193.983 | 3.2 | |
| 2205.968 | 3.3 | |
| 2206.970 | 4.1 | |
| 2207.995 | 3.5 | |
| 2222.917 | 3.4 | |
| 2223.924 | 3.1 | |
| 2258.832 | 3.7 | |
| 2259.898 | 4.0 | |
| 2295.812 | 3.9 | |
| 2297.873 | 4.2 | |
| 2307.749 | 3.7 | |
| 2362.729 | 4.3 | |
| 2363.740 | 4.4 | |
| 2384.701 | 4.9 | |
| 2393.676 | 3.9 | |
| 2529.043 | 3.3 | |
| 2542.035 | 3.8 | |
| 2544.004 | 3.1 | |
| 2560.031 | 5.4 | |
| 2561.051 | 3.2 | |
| 2562.023 | 3.1 | |
| 2572.020 | 3.1 | |
| 2590.000 | 3.4 | |
| 2603.974 | 3.7 | |
| 2604.957 | 3.8 | |
| 2605.893 | 3.5 | |
| 2615.882 | 4.0 | |
| 2616.889 | 3.7 | |
| 2627.889 | 3.2 | |
| 2665.800 | 4.1 | |
| 2667.840 | 4.7 | |
| 2699.669 | 4.8 | |
| 2765.687 | 5.6 | |
| 2933.021 | 3.8 | |
| 2935.010 | 3.0 | |
| 2964.043 | 4.9 | |
| 2964.938 | 4.0 | |
| 2966.919 | 3.4 | |
| 2985.912 | 5.8 | |
| 3022.829 | 4.9 | |
| 3025.893 | 4.0 | |
| 3089.732 | 5.3 | |
| 3111.687 | 4.5 | |
| 3290.027 | 3.0 | |
| 3323.988 | 3.8 | |
| 3324.988 | 3.9 | |
| 3355.851 | 3.3 | |
| 3357.988 | 3.2 | |
| 3400.828 | 3.3 | |
| 3424.734 | 3.7 | |
| 3442.703 | 3.6 | |
| 3446.642 | 4.0 | |
| 3447.665 | 4.1 | |
| 3492.671 | 3.4 | |
| 3651.058 | 3.5 | |
| 3703.043 | 4.3 | |
| 3741.009 | 4.3 | |
| 3790.775 | 3.7 | |
| 3792.756 | 3.9 |