Dependence of radio halo properties on
star formation activity
and galaxy mass
We investigate the relation between the existence and size of radio halos, which are believed to be created by star formation (SF) related energy input into the interstellar medium, and other galaxy properties, most importantly star formation activity and galaxy mass. Based on radio continuum and H observations of a sample of seven late-type spiral galaxies we find a direct, linear correlation of the radial extent of gaseous halos on the size of the actively star-forming parts of the galaxy disks. Data of a larger sample of 22 galaxies indicate that the threshold energy input rate into the disk ISM per unit surface area for the creation of a gaseous halo depends on the mass surface density of the galaxy, in the sense that a higher threshold must be surpassed for galaxies with a higher surface density. Because of the good prediction of the existence of a radio halo from these two parameters, we conclude that they are important, albeit not the only contributors. The compactness of the SF-related energy input is also found to be a relevant factor. Galaxies with relatively compact SF distributions are more likely to have gaseous halos than others with more widespread SF activity. These results quantify the so-called “break-out” condition for matter to escape from galaxy disks, as used in all current models of the interstellar medium and first defined by Norman & Ikeuchi (1989).
Key Words.:
ISM: general – galaxies: spirals – galaxies: evolution – galaxies: halos – galaxies: starburst – radio continuum: galaxies1 Introduction
| NGC 1808 | M 82 | NGC 4666 | NGC 4700 | NGC 7090 | |
| (2000) | 05:07:42.3 | 09:55:52.2 | 12:45:08.3 | 12:49:07.6 | 21:36:28.6 |
| (2000) | –37:30:47 | +69:40:47 | –00:27:51 | –11:24:47 | –54:33:24 |
| (km s-1) | 1000 | 203 | 1520 | 1404 | 849 |
| D (Mpc) | 10.9 | 3.2 | 26.4 | 25.5 | 11.7 |
| PA (∘) | 320 | 60 | 225 | 48 | 130 |
| i (∘) | 60 | 90 | 78 | 90 | 90 |
The entries in the rows of Table 1 are:
(2000): J2000 equinox centre coordinates
: Heliocentric velocity, from Koribalski et al. (1993;
NGC 1808), de Vaucouleurs et al. (1991; M 82), Walter et al. (2004;
NGC 4666) and Dahlem et al. (2005; NGC 4700 and NGC 7090)
D: Distances are based on = 75 km s-1 Mpc-1
and a virgocentric infall velocity of 300 km s-1 (cf. Dahlem et
al. 2001).
i: Inclination angle
The investigation of gaseous halos in late-type spiral galaxies is closely linked to studies of the galaxies’ chemical evolution. Halos are potential mediators of metal redistribution via disk-halo interactions (e.g. Bregman 1980). If escape velocity is reached, for example in galactic winds, outflowing halo gas influences the evolution of the intergalactic medium by means of metal and energy injection, thus adding to the potential importance of gaseous halos on cosmological scales (e.g. Heckman 2005).
Over the last decade it has become clear that spiral galaxies with high-mass star formation (SF) have gaseous halos (e.g., Heckman, Armus, Miley 1990; Lehnert and Heckman 1995; Dahlem 1997; Rossa and Dettmar 2003a). In fact, we have found evidence (Dahlem et al. 1998; Dahlem et al. 2001) that almost all far-infrared (FIR) “warm” edge-on spirals (i.e., with 60 m to 100 m FIR flux ratios ) have gaseous halos. The only remaining exceptions from this rule are galaxies for which no firm statement can be made due to the lack of data of sufficient quality.
These gaseous halos comprise all known phases of the interstellar medium (ISM) previously found in the disks (e.g., Dahlem 1997). Optical (H) emission was detected in M 82 already by Lynds and Sandage (1963). Radio detections came later, starting with NGC 4631 (Ekers and Sancisi 1977). Yet later, X-ray emission was detected from halos (e.g., Watson et al. 1984).
Further progress in this field of research has been made by studies in various wavebands, such as optical H imagery (Rossa and Dettmar 2000, 2003a,b; see also the work by Dettmar 1992 and Rand 1996) and X-ray imaging spectroscopy (e.g., Dahlem et al. 1998, Pietsch et al. 2000, Strickland et al. 2004a,b and references therein; Tüllmann et al. 2006). H I was detected in halos around spirals (e.g., Fraternali et al. 2004 and references therein; Boomsma et al. 2005) and, most recently, diffuse ultra-violet (UV) emission was found from the starburst outflows of NGC 253 and M 82 (Hoopes et al. 2005).
Radio synchrotron emission from relativistic electrons is the most extended and pervasive component of these halos, which makes them most easily detectable. Thus, recent attempts to detect radio emission from extraplanar gas in actively star-forming galaxies have been quite successful (e.g. Irwin et al. 1999; Dahlem et al. 2001). Nevertheless, a debate is still continuing about how such halos are created and energetically maintained (Dahlem 1997). In a first attempt to establish general rules of behaviour for gaseous halos of spirals, we (Dahlem, Lisenfeld, Golla 1995; hereafter DLG95) investigated the dependence of the properties of radio halos on the level of SF in the underlying disks of NGC 891 and NGC 4631. At the time, these were the only two galaxies for which we had data of sufficient quality to conduct such studies. 1.49 GHz radio continuum images were used to measure the properties of the radio halos of both galaxies. The most suitable tool to determine the radius inside which high-mass SF is occurring, , are FIR data. However, only very few images with sufficient angular resolution exist (in particular those obtained with the IRAS CPC detector; see van Driel et al. 1993). In the case of NGC 4631 we substituted the FIR data with an H image.
As part of a small radio continuum survey of FIR-warm edge-on spiral galaxies, radio images of several more suitable galaxies were obtained (Dahlem et al. 2001, 2005). Here we present an analysis of those radio images with sufficient resolution for detailed studies of halo properties. We compare these with H emission line images and/or other tracers of SF in galaxy disks, to investigate whether these galaxies show a similar dependence of their radio halo properties on the level of activity in the underlying disks as NGC 891 and NGC 4631 (DLG95). To ensure that processes related to high-mass SF dominate the energy balance of the ISM in these galaxies, systems with known luminous active galactic nuclei (AGNs) and closely interacting galaxies were excluded (see Dahlem et al. 2001).
2 Database
Here we concentrate on radio continuum and H halos, but different gaseous phases are normally found associated with each other (Dahlem 1997; Veilleux et al. 2005; Tüllmann et al. 2006). Therefore, it is very likely that galaxies with either radio continuum or H halos in general have multi-phase gaseous halos, including all the phases of the ISM mentioned above.
2.1 Sample selection
Only galaxies with known extraplanar emission both in the radio continuum and optical emission lines were considered. Also, these galaxies were selected to be neither closely interacting (and thus not tidally disturbed) nor to host a dominant AGN and are therefore suitable for studying the dependence of gaseous halo properties on the SF activity in the underlying disks. The available datasets must allow the measurement of at least the following three quantities: 1. The maximum radius at which a spiral galaxy actively forms stars, ; 2. the maximum radius at which nonthermal radio continuum emission from cosmic rays is observed in their disks, ; 3. the maximum radius at which synchtrotron radio continuum emission is detected in the halo, . These selection criteria severely limit the number of suitable targets. At present the list of galaxies fulfilling all selection criteria, for which we have suitable datasets (in addition to NGC 891 and NGC 4631; DLG95), comprises five new objects; their basic properties are collected in Table 1. For these galaxies the following observational datasets are used. All data are available to us in electronic, reduced form, except the radio continuum data for NGC 1808 by Saikia et al. (1990). For this galaxy the derived radii were taken from the literature.
2.2 Radio continuum observations
Low-frequency (1.4 GHz) radio continuum observations are used to trace cosmic-ray (CR) electrons in halos around the disks of the sample galaxies.
The radio data analysed here have all been published before. The radio data of NGC 1808 were published by Saikia et al. (1990), the data of M 82 (=NGC 3034) were obtained by Reuter et al. (1992). The radio image of NGC 4666 is from Dahlem et al. (1997). The 1.4 GHz maps of NGC 4700 and NGC 7090 are from Dahlem et al. (2001). The observations and their calibration and data reduction are all described in the respective papers.
2.3 H images
H imagery is used as a tracer of active SF in the disks of galaxies. Almost all H images used for comparison with the radio continuum data have been taken from previous studies. The H image of NGC 1808 was published by Jiménez-Bailón et al. (2005). M. Lehnert kindly provided us with a wide-field H image of M 82 (Lehnert et al. 1999). The H frame of NGC 3175 is from Ryder and Dopita (1993). The NGC 4666 H image was originally published by Lehnert and Heckman (1995) and has already been used by us earlier (Dahlem et al. 1997). The H images of NGC 4700 and NGC 7090 originate from Rossa and Dettmar (2003a,b).
2.4 Additional data
In addition we include some galaxies in the present study for which the measurement of the three radii , and (see Sec. 2.1) is not possible from the available images. Still, observations of these galaxies can be useful and are added here (once the existence of a gaseous halo is established) to investigate the dependence of their halo properties on some global galaxy parameters, such as e.g. their average energy input rates and galaxy mass.
To this end we use additional 1.4 GHz radio continuum images of NGC 1406, NGC 3175 and NGC 7462 from Dahlem et al. (2001). Furthermore data of three galaxies from the sample by Irwin et al. (1999) are used. Their analysis of the radio emission is different from ours (Dahlem et al. 2001) and not easily comparable. Therefore, we only include here galaxies from their sample not showing evidence of emission beyond the modelled thin disks, which is a robust criterion similar to the one used by us in the rest of the sample. An H image of NGC 7462 from Rossa and Dettmar (2003a,b) was also used.
3 Results
| (1) | (2) | (3) | (4) | (5) | (6) | (7) | ||
|---|---|---|---|---|---|---|---|---|
| Object | Band | Location | HPBW | Width | Measurements | -offset | ||
| Disk/Halo | ( ′′) | ( ′′) | Averaged | ( ′′) | (HPBW) | (kpc) | ||
| NGC 1808 | 1.4GHz | Disk | 0.6 | 5 | 2 | 0 | 0 | 0 |
| 1.4GHz | Halo | 1 | 5 | 2 | 10 | 10 | 0.5 | |
| H | Disk | 1 | 5 | 2 | 0 | 0 | 0 | |
| M 82 | 1.4GHz | Disk | 3.8 | 5 | 2 | 0 | 0 | 0 |
| 1.4GHz | Halo | 3.8 | 5 | 2 | 30 | 7.89 | 0.5 | |
| H | Disk | 1 | 5 | 2 | 0 | 0 | 0 | |
| NGC 4666 | 1.4GHz | Disk | 14 | 12 | 2 | 0 | 0 | 0 |
| 1.4GHz | Halo | 14 | 12 | 4 | 32 | 2.29 | 4.1 | |
| H | Disk | 1.9 | 12 | 2 | 0 | 0 | 0 | |
| NGC 4700 | 1.4GHz | Disk | 13 | 12 | 2 | 0 | 0 | 0 |
| 1.4GHz | Halo | 13 | 12 | 3 | 16 | 1.23 | 2.0 | |
| H | Disk | 1 | 12 | 2 | 0 | 0 | 0 | |
| NGC 7090 | 1.4GHz | Disk | 14 | 30 | 2 | 0 | 0 | 0 |
| 1.4GHz | Halo | 14 | 30 | 3 | 60 | 1.74 | 3.4 | |
| H | Disk | 1 | 30 | 2 | 0 | 0 | 0 | |
The entries in the columns of Table 2 are:
(1) Object name; (2) Observing waveband; (3) Location of cut(s) from
which measurements were obtained; (4) Angular resolution of data used;
(5) Width of the cut over which datapoints were averaged; (6) Number
of measurements used to derive mean value; (7) Offset of cuts from
galaxy disks, in units of arcsec, half power beamwidths and kpc.
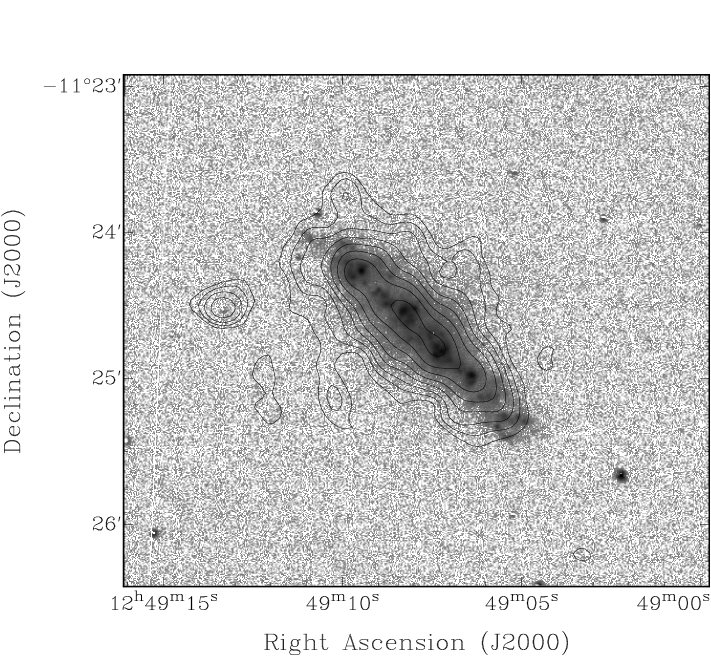
In the publications from which the data were taken most of the basic emission properties of the sample galaxies are listed (e.g., total flux densities, centre positions, etc.). An example of a (previously unpublished) dataset used here is provided in Fig. 1, where we display a contour overlay of a new VLA 1.49 GHz continuum map of NGC 4700 on our H line image. One can see directly related radio continuum and optical line emission, not only in the disk plane, but also beyond. Other galaxies in our sample exhibit a similar strong association of radio continuum and H emission.
In the following sections we report on our measurements of the radial extent of both the star-forming parts of the galaxy disks, , and of the associated radio synchrotron halos, . A correspondence between these two radii is a crucial test of the dependence of the existence of radio halos on the level of SF in the underlying disks. At the same time we measure the radial extent of the radio continuum-emitting disks of the galaxies, , and its difference compared to the size of the star-forming part, .
The measurements are performed by creating slices along the disk planes of the sample galaxies to determine and and , and additional slices parallel to the disk to determine . The slices have a narrow width (approximately one beamwidth of our radio continuum images), over which surface brightnesses are averaged and then plotted as a function of galactocentric distance. Details on the placement and size of the regions are summarised in Table 2. The procedures for measuring these quantitites are exactly the same as used by us in DLG95. In the following subsections we will use data of NGC 4666 as an example to demonstrate these techniques.
3.1 Size of the actively star-forming vs. the radio continuum-emitting parts of galaxy disks
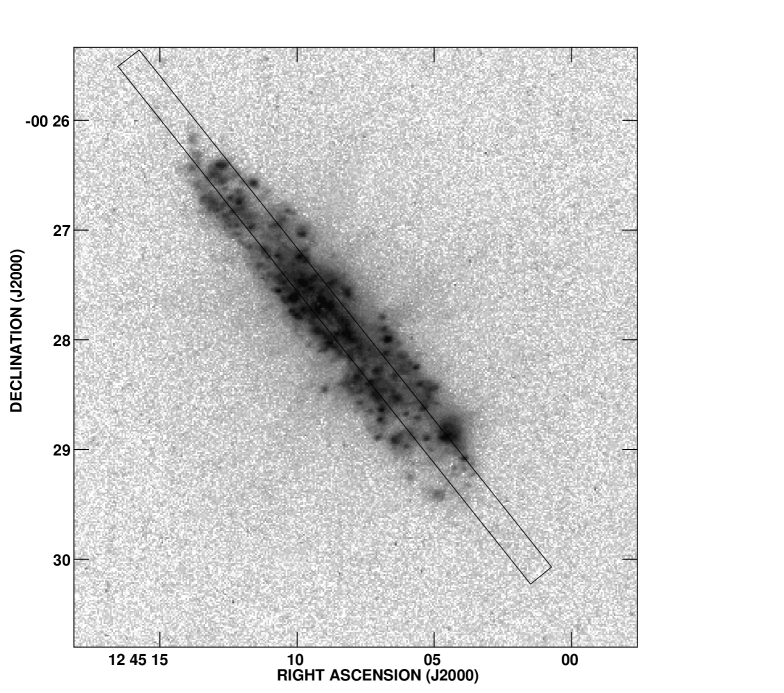
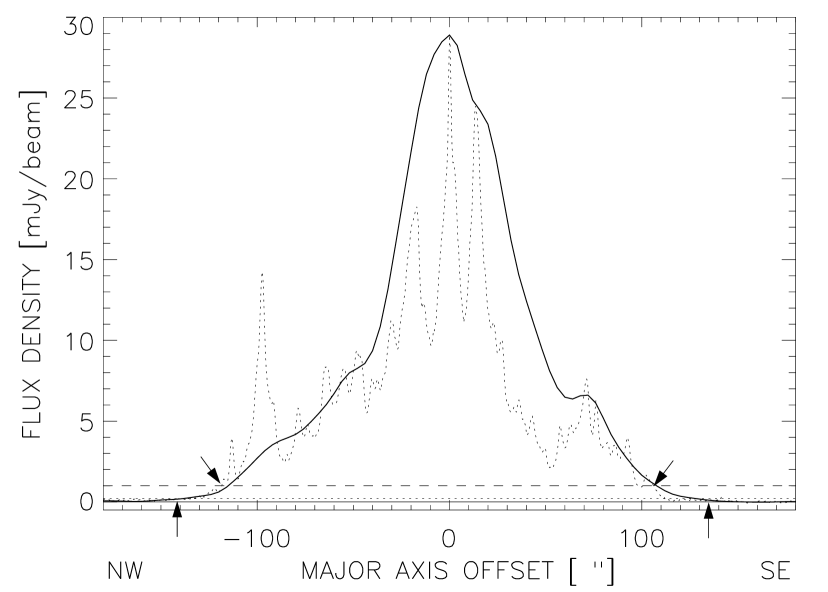
In principle, the maximum radii at which SF is observed, , can be measured from our radio continuum maps, at the radial points where the surface brightness of the disk emission drops drastically. However, in order to make sure that these measurements are truely independent of those of the radial extent of the radio halos (below), we choose instead to use H emission from H II regions in the disk as a tracer of SF and thus as a measure of . A quantitative measurement can be obtained by setting a threshold at a given H surface brightness, which can be converted into a SF rate. This would require the use of flux-calibrated H images, which we do not have available for all targets at this time. The placement of the slice through our H image along the disk plane of NGC 4666 is displayed in Fig. 2. Fig. 3 shows the resulting radial profile. Two measurements, one on each side of the disk, are obtained, which are then averaged. The cutoff criterion for where the star-forming disk ends has been set to be on the outer edge of the outermost bright H II-regions in the disk (Figs. 2 and 5). Although this definition lacks a specific threshold value, the steepness of the radial brightness profile ensures that the values for are relatively robust. The resulting values are listed in Table 3.
Note that once the correct value of is determined, one can use integral (IRAS) far-infrared fluxes or radio continuum data–neither of which are affected by optical thickness–to determine average energy input rates by massive SF per unit area, by assuming that all emission arises from the star-forming parts of the disks.
| (1) | (2) | (3) | (4) | (5) | (6) | (7) | (8) | ||||
| Object | |||||||||||
| [Mpc] | [ ′′] | [kpc] | [ ′′] | [kpc] | [ ′′] | [kpc] | [kpc] | [ ′′] | [kpc] | ||
| NGC 891 | 9.5 | 278 | 12.8 | 200 | 9.2 | 203 | 9.3 | 3.5 | 424 | 19.5 | 0.22 |
| NGC 4631 W | 10.0 | 492 | 23.8 | 421 | 20.4 | 362 | 17.6 | 6.2 | 444 | 21.5 | 0.67 |
| NGC 4631 E | 433 | 21.0 | 338 | 16.4 | 348 | 16.9 | 4.1 | 444 | 21.5 | 0.62 | |
| NGC 1808 | 10.9 | 9 | 0.47 | 15 | 0.79 | 8 | 0.42 | 0.05 | 195 | 10.3 | 0.0017 |
| M 82 | 3.2 | 46 | 0.71 | 60 | 0.93 | 21 | 0.33 | 0.38 | 336 | 5.2 | 0.0039 |
| NGC 4666 | 26.4 | 119 | 15.2 | 90 | 11.5 | 106 | 13.6 | 1.6 | 138 | 17.7 | 0.59 |
| NGC 4700 | 25.5 | 63 | 7.7 | 42 | 5.2 | 51 | 6.3 | 1.1 | 90 | 11.1 | 0.35 |
| NGC 7090 | 11.7 | 147 | 8.3 | 93 | 5.3 | 74 | 4.2 | 0.9 | 222 | 12.6 | 0.35 |
The entries in Table 3 are:
(1) Galaxy name; (2) Distances are based on = 75 km s-1
Mpc-1 and a virgocentric infall velocity of 300 km s-1 (cf.
Dahlem et al. 2001); (3) Radial extent of the radio continuum-emitting
disk; (4) Radial extent of the radio synchrotron halo; (5) Radial
extent of the star-forming disk, measured from H; (6)
Difference between and ; (7) Radius of stellar
disk at 25th magnitude (in the B-band); (8) Scaling factor between
star-forming part of the disk, , vs. stellar disk extent,
.
The values for the radii of the radio continuum-emitting disks, , were measured at the 5- confidence level of the images by producing cuts through the radio continuum emission distribution in the galaxy disks along their major axes, as described by us in DLG95. Again, two measurements are taken and then averaged. The placement of the cut through the 1.49 GHz disk emission of NGC 4666 is exactly the same as that for the H cut (Fig. 2). The resulting surface brightness profile as a function of galactocentric distance is shown in Fig. 3 as a solid line. Details are listed in Table 2 and the resulting measurements of can be found in Table 3.
3.2 Radial extent of the radio halos,
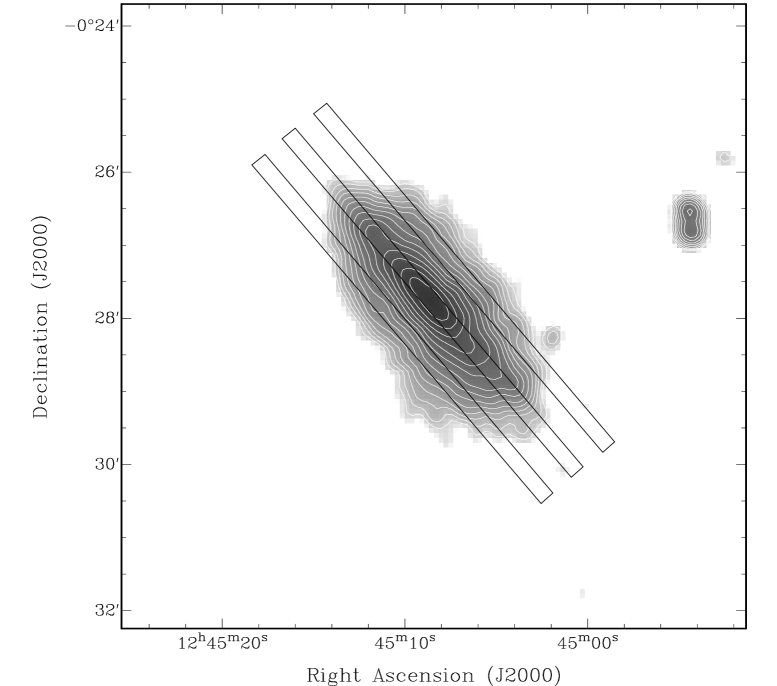
We measure the radial extent of the radio halos, , by producing cuts through the radio continuum emission distribution in the halos, parallel to the galaxies’ major axes, but offset from the disk planes (DLG95). Measurements are again taken at the 5- confidence level. We show the positions of the cuts through the radio halo of NGC 4666 in Fig. 4, where we follow exactly the same procedure as in DLG95 (cf. Fig. 3 in that paper). The placement of the cuts is quantified in Table 2. From the two cuts through the halo of each galaxy, one can ideally obtain four measurements of . Because axial symmetry is a good assumption for the relatively undisturbed systems studied here, the four values can be averaged into one per galaxy. Fig. 5 displays, as an example, the points at which and were measured in NGC 4666. In practice, some values cannot be used, e.g. because of the presence of nearby background sources. Column 6 in Table 2 provides the number of measurements used to obtain for each galaxy. The average values for obtained by us (in angular and spatial units) are presented in column 4 of Tab. 3. Since it is important that the cuts in the halo not be contaminated by disk emission (by either beam-smearing, a warped disk or a deviation of inclination from edge-on [i=90∘]), -offsets where chosen to be more than one beam-width. At the same time, the -offsets must not be too large because the signal-to-noise ratio of the data drops rapidly (exponentially) away from the galaxy disks. Accordingly, cuts were produced at intermediate -offsets, well above the projected disks of the galaxies, but as low as possible in order to achieve the highest possible signal-to-noise ratios. We list the -offsets of the cuts from the major axes in units of arcsec, kpc and beamwidths in Table 2.

All average values for the three radii (, and ) are collated in Table 3. The values in the top part of the table, separated by a horizontal line, are reproduced from DLG95, the lower part of the table contains new measurements.
Our estimates of the uncertainties for the various radii are dominated by uncertainties arising from the limited angular resolution of the radio images. In addition, the observed radio halos are not exactly cylindrical and therefore there is a weak dependence of the radial extent, , on the -offset at which the measurement is obtained. Because of the constraints mentioned before, this uncertainty can at present not be avoided.
Due to signal-to-noise limitations, studies of variations of the halo width as a function of -distance can currently not be conducted yet.
4 Discussion
Our new results enable us to perform the same studies on a sample of five new galaxies as done previously for NGC 891 and NGC 4631 (DLG95), with which they can be compared:
-
1.
Check whether there is a relation between the maximum radius at which massive SF is observed, , and the radial extent of the radio halo, (Sec. 4.1);
-
2.
calculate the average energy input rate from high-mass SF in the disk, , and determine the threshold value for the onset of halo emission (Sec. 4.3).
In addition, the slowly increasing size of our sample now also allows us to investigate whether the existence and properties of gaseous halos depend on a number of other global physical galaxy properties (Sec. 4.4). For this study values obtained for other galaxies (DLG95) have been reused.


4.1 Star-forming disk vs. radial halo extent
As before (DLG95), we find a strong dependence of the halo properties on the level of disk activity in our sample galaxies. The numbers quantifying these relationships are collated in Table 3. A tight and linear correlation between the radial extent of radio halos, , and the areas of active SF in the underlying disks, , is confirmed. This is visualised in the left panel of Fig. 6. A weaker and strongly nonlinear dependence is visible when plotting against the radial extent of the optical disk at the 25th magnitude surface brightness, (right panel of Fig. 6). The use of is not meaningful in this context, as can be judged by considering a study of galaxies with proto-typical circumnuclear starbursts. In these galaxies, the vast difference between and (see entries for NGC 1808 and M 82 in Table 2) illustrates clearly that is not a suitable tracer of currently ongoing SF activity. This, in turn, supports the notion that the observed gaseous halos are created by processes related to the young stellar populations (I), not the old ones (II).
The extent of the radio halos, , of galaxies with widespread SF is similar to that of the underlying star-forming disks, , because in the outer parts of the galaxy disks the SF rates (SFRs) and thereby energy input rates are too low to create outflows (cf. DLG95). The values are in most cases slightly smaller than , which is probably a sensitivity bias. These data points lie just below the line of unity in the left panel of Fig. 6.
A direct comparison of the values of and (Table 2) suggests that for circumnuclear starbursts (NGC 1808, M 82) is slightly larger than . This is caused by the fact that the starburst-driven outflow cones widen beyond the disk planes in the arche-typical hour-glass shape (e.g. Veilleux et al. 2005 and references therein). For this reason, classical starbursts will always appear slightly above the line of unity in Fig. 6 (left panel).
The significance of a direct relation of the halo extent and the maximum radius at which a galaxy is actively forming stars is that–based on the data used here–halos appear to exist only when and where the current massive SF rate is high. It corroborates calculations predicting outflows from active SF regions predominantly perpendicular to the disk plane due to the pressure gradient along which material can flow. At the same time expansion within the disk is inhibited by the resistance of swept-up disk material.
One example of a model making such predictions, although too simplistic to explain all details, is the “chimney” model by Norman & Ikeuchi (1989). Any modern model of the interstellar medium in galaxies contains a halo component, which is created naturally as a consequence of the buoyancy of disk gas heated by massive SF (see, e.g,. Mac Low & Ferrara 1999). Bregman (1980) pointed out that the conservation of angular momentum during the transport of matter into a galaxy’s halo (in the form of a “galactic fountain”) leads to radial motions, thus facilitating an efficient radial re-distribution of metal-enriched material within galaxies.
The major advance of our current observational results over DLG95 is that our findings are now firmer, because based on significantly more sensitive observations of more objects (seven compared to two) than before.
4.2 Extent of the star-forming disk vs. total radio continuum-emitting disk
There are two reasons why a significant difference between the
extent of an actively star-forming disk and that of the radio
continuum-emitting part of a galaxy can be observed:
1. Diffusion of CRs from sites of massive SF. In the case of
radial diffusion within the disk, for galaxies in which the
level of SF drops rapidly at a certain galactocentric radius,
is a measure of the
radial CR diffusion coefficient within the disk, (DLG95).
2. The presence of low-level SF in the outermost parts of the
disks can lead to low surface brightness radio emission.
Galaxies with widespread SF (in the present sample NGC 4666, NGC 4700 and NGC 7090; NGC 891 and NGC 4631 from DLG95) exhibit a significant difference between and (see Table 3). This suggests either radial electron diffusion in the disks or low-level SF in the outer parts of their disks, or a combination of both.
On the other hand, the measured differences between and within the disks of circumnuclear starbursts are insignificant. A likely cause of this similarity could be that radial propagation of CRs within the disks is inhibited by the high pressure of the ambient medium and possibly by poloidal magnetic fields, which are found in powerful starburst galaxies (e.g., Lesch et al. 1990). At the same time, there is little or no SF in the disks of some circumnuclear starburst galaxies beyond their Inner Lindblad Resonance (or turnover radius of rotation); see e.g. Combes (1987), Lesch et al. (1990).
4.3 Energy input rates into the disk ISM
| (1) | (2) | (3) | (4) | (5) | (6) | (7) |
| Object | Morph. | |||||
| TypeRC3 | [Mpc] | [kpc] | [ W Hz-1] | [yr-1] | [10-3 ergs s-1 cm-2] | |
| NGC 891 | SA(s)b? sp | 9.5 | 9.3 | 8.2 | 0.13 | 1.60 |
| NGC 3044 | SB(s)c? sp | 20.6 | 10.0 | 6.1 | 0.10 | 1.02 |
| NGC 4631 | SB(s)d | 10.0 | 17.3a | 14.7 | 0.23 | 0.82 |
| NGC 5907 | SA(s)c: sp | 14.9 | 18.1 | 2.6 | 0.04 | 0.13 |
| NGC 4565 | Sbc | 9.7 | 16.9 | 1.5 | 0.02 | 0.09 |
| NGC 4244 | SA(s)cd? sp | 3.1 | 4.5 | 0.1 | 0.002 | |
| M 82 | I0;Sbrst H II | 3.2 | 0.33 | 10.1 | 0.16 | 1550 |
| NGC 1808 | (R’_1)SAB(s:)b | 10.9 | 0.42 | 5.9 | 0.09 | 565 |
| NGC 4666 | SABc: | 26.4 | 13.7 | 34.1 | 0.53 | 3.1 |
| NGC 3175 | SAB(s)b | 15.9 | 3.5 | 2.1+ | 0.03 | 2.98 |
| NGC 4700 | SB(s)c? sp; H II | 25.5 | 6.3 | 2.3 | 0.04 | 0.99 |
| NGC 1406 | SB(s)bc: sp | 14.9 | 7.9 | 3.4+ | 0.05 | 0.90 |
| NGC 3437 | SAB(rs)c: | 25.5 | 11.8 | 5.7+ | 0.09 | 0.69 |
| NGC 7090 | SBc? sp | 11.7 | 4.2 | 0.6∗ | 0.01 | 0.59 |
| NGC 2748 | SAbc H II | 28.7 | 14.3 | 6.6+ | 0.10 | 0.54 |
| NGC 1421 | SAB(rs)bc: | 31.1 | 21.8 | 12.8+ | 0.20 | 0.45 |
| NGC 7462 | SB(s)bc? sp | 15.1 | 5.4 | 0.7+ | 0.01 | 0.41 |
| NGC 1055 | SBb: sp LINER2 | 16.0 | 18.3 | 7.2+ | 0.11 | 0.36 |
| NGC 3717 | SAb: sp H II | 27.1 | 23.2 | 10.8+ | 0.17 | 0.34 |
| NGC 5297 | SAB(s)c: sp | 34.5 | 12.7 | 3.3 | 0.05 | 0.34 |
| NGC 2613 | SA(s)b | 25.9 | 21.2 | 5.5 | 0.08 | 0.21 |
| NGC 4517 | SA(s)cd: sp | 19.5 | 18.4 | 1.7 | 0.03 | 0.08 |
The entries in Table 4 are:
(1) Galaxy name; (2) Morphological type from NED, based on the RC3
catalogue; (3) Distances are based on = 75 km s-1 Mpc-1
and a virgocentric infall velocity of 300 km s-1 (cf. Dahlem et
al. 2001); (4) Radial extent of the star-forming disk, measured from
H imagery; (5) Total nonthermal radio power at 1.49 GHz (1.384
GHz for galaxies marked with an asterisk [∗]; 1.43 GHz for galaxies
marked with a cross [+]); (6) Supernova rate derived from the total
radio power, , applying eq. 4 of DLG95; (7) The energy
input per SF area derived from eq. 8 of DLG95, assuming for all galaxies
a magnetic field strength of 5 G.
Note to Table 4:
a) Average value for both sides of the disk
Based on we calculate the surface area within the sample galaxies over which SF occurs, assuming circular symmetry, . This we adopt as the surface area over which energy is released homogeneously into the ambient medium by SF-related process, i.e. stellar winds, supernovae and their remnants (Leitherer and Heckman 1995), . The energy input is assumed to be proportional to the nonthermal radio emission and its calculation and normalisation to unit surface area, = /, are performed exactly as described in DLG95. The relevant numbers are collated in Tables 3 and 4, where the top parts contain values from DLG95, while the lower parts add new measurements to the database.
Especially for the classical circumnuclear starbursts the use of instead of is obviously essential. Neglecting this correction would lead to errors in estimates of the mean energy input rates per unit surface area, , by factors of 1000, typically, as can be seen by inverting the numbers in column 8 of Table 3. But also for galaxies with widespread SF corrections in by factors of 1.5–5 occur when using instead of (Tables 3 and 4).
Again, there is a clear difference between proto-typical starburst galaxies (NGC 1808, M 82) and others with more widespread SF. The energy injection rates in circumnuclear starbursts, , are orders of magnitude higher than in galaxies with widespread SF, leading to much more energetic outflows which can be detected at high distances above the disk planes, of up to 5–10 kpc (Dahlem et al. 1998, Lehnert et al. 1999, Strickland et al. 2004a,b, Tüllmann et al. 2006). In these outflows gas can reach of order escape velocity (e.g., HAM90) and shock heating plays an important role (e.g., Chevalier and Clegg 1985, HAM90, Dahlem et al. 1997).
Outflows from galaxies with widespread SF reach lower maximum -heights of up to 1–5 kpc (Rand 1996, Rossa & Dettmar 2000, 2003a,b, Miller & Veilleux 2003), because the average energy input rates per unit surface area are lower than in starbursts, although the total energy input may be similar (see column 5 in Table 4).
4.4 Halo dependence on various physical properties
Several quantities were investigated for potential relationships. In particular, possible dependences of the halo properties on the level of SF in the galaxy disks, as measured by the energy deposition rate , and on galaxy mass surface density were tested.
| (1) | (2) | (3) | (4) | (5) | (6) | (7) | (8) | (9) |
|---|---|---|---|---|---|---|---|---|
| Object | mK | /A25 | ||||||
| [Jy] | [Jy] | [ L⊙] | [ L⊙] | [mag] | [ M⊙] | [M⊙ pc-2] | ||
| NGC 891 | 61.10 | 198.63 | 0.31 | 1.27 | 1.44 | 5.94 | 3.2 | 27.0 |
| NGC 1055 | 23.27 | 60.09 | 0.39 | 1.21 | 1.18 | 7.15 | 3.0 | 30.6 |
| NGC 1406 | 11.91 | 27.00 | 0.44 | 0.51 | 0.54 | 8.61 | 0.7 | 31.9 |
| NGC 1421 | 11.20 | 24.30 | 0.46 | 2.03 | 3.43 | 8.40 | 3.6 | 44.5 |
| NGC 1808 | 87.81a | 137.20a | 0.64a | 1.70a | 0.70 | 6.66 | 2.2 | 65.9 |
| NGC 2613 | 6.31 | 25.42 | 0.25 | 1.10 | 6.37 | 6.83 | 10.6 | 47.6 |
| NGC 2748 | 7.95 | 19.44 | 0.41 | 1.30 | 1.70 | 10.32 | 0.5 | 10.6 |
| M 82 | 1271.32 | 1351.09 | 0.94 | 1.87 | 0.26 | 4.67 | 1.2 | 138.9 |
| NGC 3044 | 10.47 | 21.16 | 0.49 | 0.81 | 1.34 | 8.98 | 0.9 | 15.6 |
| NGC 3175 | 13.07 | 28.20 | 0.46 | 0.62 | 0.73 | 7.79 | 1.6 | 61.6 |
| NGC 3437 | 12.15 | 20.62 | 0.59 | 1.33 | 0.92 | 8.88 | 1.5 | 57.6 |
| NGC 3717 | 10.52 | 23.84 | 0.44 | 1.48 | 2.67 | 7.52 | 6.1 | 35.0 |
| NGC 4244 | 4.20 | 16.06 | 0.26 | 0.01 | 0.17 | 7.72 | 0.07 | 4.8 |
| NGC 4517 | 6.92 | 20.20 | 0.34 | 0.57 | 3.61 | 7.33 | 3.8 | 14.3 |
| NGC 4565 | 9.83 | 47.23 | 0.21 | 0.27 | 1.92 | 6.06 | 3.0 | 22.0 |
| NGC 4631 | 82.90 | 208.66 | 0.40 | 1.67 | 3.21 | 6.67 | 2.2 | 15.2 |
| NGC 4666 | 37.34 | 82.88 | 0.45 | 4.92 | 3.32 | 7.06 | 8.9 | 91.1 |
| NGC 4700 | 3.05 | 5.36 | 0.57 | 0.34 | 1.54 | 9.78 | 0.7 | 17.4 |
| NGC 5297 | 1.81 | 7.99 | 0.23 | 0.59 | 2.95 | 9.89 | 1.1 | 5.4 |
| NGC 5907 | 12.02 | 42.37 | 0.28 | 0.64 | 2.61 | 6.76 | 3.7 | 18.4 |
| NGC 7090 | 5.88 | 17.97 | 0.33 | 0.18 | 0.97 | 8.16 | 0.6 | 12.7 |
| NGC 7462 | 3.11 | 6.32 | 0.49 | 0.13 | 0.55 | 9.65 | 0.3 | 10.0 |
The entries in Table 5 are:
(1) Galaxy name; (2) IRAS 60 m band flux density; from NED; (3) IRAS
100 m band flux density; from NED; (4) flux ratio;
(5) Far-infrared luminosity, based on the standard formulas used by us
earlier (Dahlem et al. 2001); (6) Optical blue luminosity, determined as
= , where the absolute blue
magnitude is the apparent blue magnitude, K-corrected, corrected for
Galactic extinction and scaled by the distance of the object, -25-5log(); values
are from NED. This definition provides an estimate of the blue luminosity
() at 4400 Å; (7) Apparent total magnitude in the K-band
(centered at 2.17 m) from 2MASS; (8) Mass in galactic disk derived
from the K-band magnitude, as described in Sec. 4.4.1;
(9) Average mass surface density within the optical (r25) disk.
Note to Table 5:
a) Not used for studies of FIR properties due to unknown contribution
from a low-luminosity AGN.
4.4.1 Energy injection rate vs. galaxy mass surface density
Lower-mass galaxies not only have lower escape velocities than more massive ones, but the onset of disk-halo interactions will also be easier for a shallower gravitational potential. Therefore, the existence of a radio halo is expected to depend, apart from the energy input from the disk (see above), on the gravitational force that particles must overcome to escape from a galaxy disk. The gravitational potential that particles experience when being lifted above the disk is proportional to the mass surface density in the disk. We approximate the mass in the disk by the stellar mass derived from near-infrared emission, which traces old stars that are responsible for the bulk of the stellar mass.
The stellar mass is deduced from the total K-band magnitude, , from the Two Micron All Sky Survey (2MASS). The luminosity in this band, , was calculated as
| (1) |
which gives an estimate of the luminosity () at 2.17 m.
From the luminosity the stellar mass was derived assuming optically thin emission (which may lead to a slight underestimate of the NIR emissivity) and a mass-to-light ratio of 3, which is indicative of a stellar population of age 5.9 Gyr (Bruzual & Charlot 2003). The K-band magnitudes and values for the galaxies in our sample are listed, together with other parameters, in Table 5.


The significance of the rate at which energy is deposited into the ISM of spiral galaxies, , on the initiation of disk-halo outflows, and thereby the creation of gaseous halos, has been described above (Sec. 4.3). Only galaxies with energy input rates above a certain threshold value can start disk-halo interactions. Note that values can be converted directly into the commonly used, but more indirect, SF rates per unit area, which are often measured in units of M⊙ yr-1 kpc-2.
In order to investigate the influence of both the galaxy mass surface density and the energy input rates, we plot in the left panel of Fig. 7 the stellar surface density, /, where is the area of the optical disk, versus for the galaxies in our extended sample. This plot is similar to the one shown in Lisenfeld et al. (2004), however now using the stellar mass in the disk, rather than the total dynamical mass. In addition, the present plot also includes more new galaxies from the present paper.
As expected, we note a clear division between galaxies with and without radio halo: Galaxies with low mass surface densities and high energy input rates have radio halos, as opposed to galaxies with high mass surface densities and low energy input rates. The line drawn indicates the transition between both regimes.
The significance of the observed dichotomy is that, because of the smaller force that particles must overcome and the associated lower escape velocities, it is easier for low-mass galaxies to have gaseous halos around them than massive ones (e.g. Heckman et al. 1995, Martin 1997, 1998). Once the energy input rate is high enough, also spiral galaxies with a high mass surface density can create and maintain gaseous halos. The energy input levels in classical starburst galaxies are shown to be so high (Fig. 7, left panel) that gravitational forces are negligible, as already assumed by Chevalier and Clegg (1985).
These new findings refine our statement (DLG95) that there is “a threshold energy input rate” above which outflows can occur by including the galaxy mass surface density as an additional parameter. The energy threshold value determined here for galaxies of given mass surface density for the onset of disk-halo interactions can be used in the future to predict whether or not a certain galaxy can be expected to have a gaseous halo, i.e. whether the “breakout condition”, as defined by Norman & Ikeuchi (1989), required for outflows to occur is fulfilled. The detected vs. / relation is reliable, because it does not depend strongly on the adopted galaxy distances, both quantities essentially being derived from surface brightnesses.
In this context it is important to note that using instead of to measure would lead to the displacement of objects along the x-axis to lower values of , which would skew the detected vs. /() relationship. This is illustrated in the right panel of Fig. 7. Accordingly, no such clear separation between galaxies with and without a halo is visible there and the placement of data points for classical starbursts is completely wrong.
Strongly interacting galaxies must be excluded from studies of the dependence of halo properties on the underlying SF activity, because of the potential influence of the gravitational force of a companion galaxy on the gas kinematics and thus disk-halo interactions. At the present time we do not have sufficient information to disentangle the two effects.


4.4.2 Localised outflows vs. large-scale halos
The values of derived above are averages. These are a measure of the global energy input rates into a galaxy’s ISM required to form large-scale halos.
As calculated by us earlier (DLG95), local values of in active SF regions are more likely to be of order ergs s-1 cm-2. Fig. 7 suggests that local outflows above giant H II regions, with ergs s-1 cm-2, should always be possible, even in otherwise quiescent galaxies with high mass surface densities. This explains why a galaxy such as NGC 4565, with a low SF rate and thereby low average energy input level (see Fig. 7), can exhibit a small number of dust filaments perpendicular to its disk plane which might be tracers of localised outflows of material. Note that, apart from the non-detection of a radio halo, NGC 4565 is also deficient in H and [OIII] in the disk-halo interface (Rand et al. 1992 and Robitaille et al. 2006), which again argues against the existence of a large-scale gaseous halo.
The decisive difference between a circumnuclear starburst and an individual localised outflow in a disk with more widespread SF is the total amount of energy injected into the ISM. The energy injection rates, , are yet higher in starbursts than in Giant Extragalactic H II regions (GEHRs; Kennicutt 1984). Also, since classical starbursts comprise a number of star-forming regions each of which equals a GEHR, energy (and mass) is deposited into the ambient medium over a longer time than in an individual GEHR. Hence, while for an individual GEHR the total energy can amount to of order ergs, that of a classical starburst is orders of magnitude larger, nearer ergs. In the case of ultra-luminous infrared galaxies (ULIRGs) up to ergs are deposited (HAM90).
4.4.3 Compactness of the star formation distribution
The left panel of Fig. 8 suggests that there is no clear link between the far-infrared luminosities, , and the ratio of the surface areas of the star-forming parts vs. the total extent to 25th optical blue magnitude of the galaxy disks, , in our sample galaxies. In fact, when comparing the position of M 82 on one hand with those of NGC 891 and NGC 4631 on the other, one can see that for widely different SF distributions galaxies can have the same . 111 NGC 1808 was excluded from this part of the investigation, because the contribution of its low-luminosity Seyfert 2 AGN to the total FIR luminosity is unknown. In the determination of its radio flux density (above) the flux contribution of the AGN was subtracted by fitting the central peak using the AIPS task JMFIT.
However, in the right panel of Fig. 8, although again there is no clear correlation between the two quantities, a trend is indicated that galaxies with radio halos have smaller / values and at the same time higher / ratios than the ones without halos. This suggests that a compact SF distribution favours the creation of a gaseous halo.


The left panel of Fig. 9 shows another trend, namely for galaxies with radio halos to have both compact SF distributions and warm average dust temperatures (as reflected by their high IRAS 60 m to 100 m flux ratios, ). The right panel of Fig. 9, which is similar to Figs. 38 and 39 by Dahlem et al. (2001) and Fig. 5 by Rossa and Dettmar (2003a), indicates that galaxies with radio halos also have high energy input rates into their ISM and correspondingly high average dust temperatures.
These relationships show that any combination of high / ratio, compact SF distribution and high flux ratio (0.4) is a good tracer of galaxies with radio halos. This explains why high FIR flux densities and high flux ratios (indicating the presence of warm dust) are such good selection criteria to find, after rejection of AGNs, galaxies with SF-driven gaseous halos (Dahlem et al. 2001).
4.4.4 Energy input rate vs. halo z-height
A search for a dependence of the radio halo -scale heights on the level of energy input in the disk did not yield conclusive results. Since the uncertainties involved are yet too large to make firm statements, this topic will not pursued any further at this time.
4.5 Future work
It is unlikely that large numbers of new targets fulfilling the stringent selection criteria for studies like this will be found in the near future. The main search criteria (FIR flux and colour) become more unreliable when going to more distant and thus fainter sources. In addition, the detection and proper imaging of gaseous halos in distant galaxies is extremely time-consuming on the present generation of telescopes. A much larger sample will become available only through the advent of the next generation of more powerful telescopes (both optical and radio). Progress in this field at the present time can be made by obtaining more complete databases for the galaxies presented here (and a few others known already, including e.g. NGC 253) and by finding ways to measure halo properties in face-on (or at least low inclination) galaxies.
Acknowledgements.
It is a pleasure to thank the following colleagues for contributing data to this study: S. Ryder for making available an H image of NGC 3175; M. Lehnert for providing us with an H image of M 82; U. Klein for making available the radio continuum images of M 82 by Reuter et al. (1992). UL acknowledges support by the Spanish Ministry of Education, via the research projects AYA 2005-0716-C02-01, ESP 2004-06870-C02-02, and the Junta de Andalucía. This research has made use of the NASA Extragalactic Database and the LEDA database, the contributions of which are gratefully acknowledged. We thank the anonymous referee for very constructive criticism and useful suggestions which have led to significant improvements of the paper. The Digitized Sky Survey was produced at the Space Telescope Science Institute under U.S. Government grant NAG W-2166. The National Geographic Society – Palomar Observatory Sky Atlas (POSS-I) was made by the California Institute of Technology with grants from the National Geographic Society.References
- (1) Boomsma, R., Oosterloo, T. A., Fraternali, F., van der Hulst, J. M., & Sancisi, R. 2005, A&A, 431, 65
- (2) Bregman, J. N. 1980, ApJ, 236, 577
- (3) Bruzual, G., & Charlot, S. 2003, MNRAS, 344, 1000
- (4) Chevalier, R. A., & Clegg, A. W. 1985, Nature, 317, 44
- (5) Combes, F. 1987, in Proc. NATO Conf. on Galactic and Extragalactic Star Formation, ed. R. Pudritz & M. Fich, Dordrecht: Reidel, 475
- (6) Dahlem, M. 1997, PASP, 109, 1298
- (7) Dahlem, M., Ehle, M., Ryder, S. D., Vlajić, M., & Haynes, R. F. 2005, A&A, 432, 475
- (8) Dahlem, M., Lazendic, J.S., Haynes, R.F., Ehle, M., & Lisenfeld, U. 2001, A&A, 374, 42
- (9) Dahlem, M., Lisenfeld, U., & Golla, G. 1995, ApJ 444, 119 [DLG95]
- (10) Dahlem, M., Petr, M. G., Lehnert, M. D., Heckman, T. M., & Ehle, M. 1997, A&A, 320, 731
- (11) Dahlem, M., Weaver, K. A., & Heckman, T. M. 1998, ApJS, 118, 401
- (12) Dettmar, R.-J. 1992, Fund. Cosm. Phys., 15, 143
- (13) van Driel, W., de Graauw, T., de Jong, T., & Wesselius, P. R. 1993, A&AS, 101, 207
- (14) Dumke, M., Krause, M., & Wielebinski, R. 2000, A&A, 355, 512
- (15) Ekers, R. D., & Sancisi, R. 1977, A&A, 54, 973
- (16) Fraternali, F., Oosterloo, T. A., & Sancisi, R. 2004, ApSS, 289, 377
- (17) Heckman, T. M. 2005, Starbursts: From 30 Doradus to Lyman Break Galaxies. Edited by R. de Grijs and R.M. Gonzalez Delgado. Astrophysics & Space Science Library, Vol. 329. Dordrecht: Springer, p.3
- (18) Heckman, T. M., Armus, L., & Miley, G. K. 1990, ApJS, 74, 833 [HAM90]
- (19) Heckman, T. M., Dahlem, M., Lehnert, M. D., et al. 1995, ApJ, 448, 98
- (20) Hoopes, C. G., Heckman, T. M., Strickland, D. K., et al. 2005, ApJ, 619, L99
- (21) Hummel, E., & Dettmar, R.-J. 1990, A&A, 236, 33
- (22) Irwin, J. A., English, J., & Sorathia, B. 1999, AJ, 117, 2102
- (23) Jiménez-Bailón, E., Santos-Lleó, M., Dahlem, M., et al. 2005, A&A, 442, 861
- (24) Kennicutt, R. C. 1984, ApJ, 287, 116
- (25) Koribalski, B., Dahlem, M., Mebold, U., & Brinks, E. 1993, A&A, 268, 14
- (26) Lehnert, M. D., & Heckman, T. M. 1995, ApJS, 97, 89
- (27) Lehnert, M. D., Heckman, T. M., & Weaver, K. A. 1999, ApJ, 523, 575
- (28) Leitherer, C., & Heckman, T. M. 1995, ApJS, 96, 9
- (29) Lesch, H., Biermann, P. L., Crusius, A., et al. 1990, MNRAS, 242, 194
- (30) Lisenfeld, U., Dahlem, M., & Ehle, M. 2004, in How does the Galaxy Work? A Galactic Tertulia with Don Cox and Ron Reynolds, E. J. Alfaro (ed.), Astrophysics and Space Science Library, 315, p. 75
- (31) Lynds, C. R., & Sandage, A. 1963, ApJ, 137, 1005
- (32) Mac Low, M.-M., & Ferrara, A. 1999, ApJ, 513, 142
- (33) Martin, C. L. 1997, ApJ, 491, 561
- (34) Martin, C. L. 1998, ApJ, 506, 222
- (35) Miller, S. T., & Veilleux, S. 2003, ApJS, 148, 383
- (36) Norman, C. A., & Ikeuchi, S. 1989, ApJ, 345, 372
- (37) Pietsch, W., Vogler, A., Klein, U., & Zinneker, H. 2000, A&A, 360, 24
- (38) Rand, R. J., Kulkarni, S. R., & Hester, J. J. 1992, ApJ, 396, 97
- (39) Rand, R. J. 1996, ApJ, 462, 712
- (40) Reuter, H.-P., Klein, U., Lesch, H., Wielebinski, R., & Kronberg, P. P. 1992, A&A, 256, 10
- (41) Robitaille, T., Rossa, J., Bomans, D., & van der Marel, R. 2006, (subm. to A&A)
- (42) Rossa, J., & Dettmar, R.-J. 2000, A&A, 359, 433
- (43) Rossa, J., & Dettmar, R.-J. 2003a, A&A, 406, 493
- (44) Rossa, J., & Dettmar, R.-J. 2003b, A&A, 406, 505
- (45) Ryder, S. D. & Dopita, M. A. 1993, ApJS, 88, 415
- (46) Saikia, D. J., Unger, S. W., Pedlar, A., et al. 1990, MNRAS, 245, 397
- (47) Strickland, D. K., Heckman, T. M., Colbert, E. J. M., Hoopes, C. G., & Weaver, K. A. 2004a, ApJS, 151, 193
- (48) Strickland, D. K., Heckman, T. M., Colbert, E. J. M., Hoopes, C. G., & Weaver, K. A. 2004b, ApJ, 606, 829
- (49) Tüllmann, R., Pietsch, W., Rossa, J., Breitschwerdt, D., & Dettmar, R.-J. 2006, A&A 448, 43
- RC (3) de Vaucouleurs, G., de Vaucouleurs, A., Corwin, H. G., et al., 1991, Third Reference Catalogue of Bright Galaxies, (New York, Berlin: Springer-Verlag), (RC3)
- (51) Veilleux, S., Cecil, G., & Bland-Hawthorn, J. 2005, ARAA, 43, 769
- (52) Walter, F., Dahlem, M., & Lisenfeld, U. 2004, ApJ, 606, 258
- (53) Watson, M. G., Stanger, V., & Griffiths, R. E. 1984, ApJ, 286, 144