Confirming the high velocity outflow in PG1211+143
Abstract
An XMM-Newton observation of the bright QSO PG1211+143 was previously reported to show evidence for a massive, energetic outflow, with an outflow velocity of v0.1c based on the identification of blue-shifted absorption lines detected in both EPIC and RGS spectra. Subsequently, an order-of-magnitude lower velocity has been claimed from an ion-by-ion model fit to the RGS data. We show here, in a re-analysis of the higher signal-to-noise EPIC data, that the high velocity is confirmed, with the resolution of additional absorption lines yielding a revised outflow velocity in the range 0.13-0.15c. Confirmation of a massive and energetic outflow in a non-BAL AGN has important implications for metal enrichment of the IGM and for the feedback mechanism implied by the correlation of black hole and galactic bulge masses. We note the near-Eddington luminosity of PG1211+143 may be the critical factor in driving such an energetic outflow, a situation likely to be common in AGN at higher redshift.
keywords:
galaxies: active – galaxies: Seyfert: quasars: general – galaxies: individual: PG1211+143 – X-ray: galaxies1 Introduction
An analysis of the EPIC and RGS spectra from an XMM-Newton observation of the bright narrow emission line QSO PG1211+143 in 2001 provided evidence for a highly ionised outflow with a velocity of 0.1c (Pounds et al. 2003; hereafter P03), though a lower velocity has recently been claimed from a separate analysis, principally based on the low signal-to-noise RGS data (Kaspi and Behar 2006). Confirmation of the high velocity outflow is important since the mechanical energy in the flow, if not highly collimated, is a significant fraction of the bolometric luminosity of PG1211+143 and could be typical of AGN accreting near the Eddington rate (King and Pounds 2003), while also providing an example of the feedback required by the linked growth of SMBH in AGN with their host galaxy (King 2005). Subsequently, the same XMM-Newton observation of PG1211+143 has been used by Gierlinski and Done (2004) to suggest how strong absorption of the intrinsic X-ray continuum in a ‘velocity-smeared’, high column, of moderately ionised gas can provide a physically preferred explanation (to Comptonisation) for the strong soft excess widely seen in type 1 AGN (Wilkes and Elvis 1987, Turner and Pounds 1989). A similar study by Chevallier et al. (2006), which also considered an ionised reflection origin of the soft excess, concluded that absorption was the more likely cause of a strong soft excess (as in PG1211+143).
In the present paper we re-examine the XMM-Newton EPIC data of PG1211+143 which formed the strongest evidence for the high velocity claimed in P03. We use the latest calibration files and - in particular - take advantage of the higher spectral energy resolution of the MOS cameras demonstrated in recent studies of the Type 2 Seyferts Mkn3 (Pounds and Page 2005) and NGC1068 (Pounds and Vaughan 2006).
We assume a redshift for PG1211+143 of (Marziani et al. 1996).
2 Observation and data reduction
PG1211+143 was observed by XMM-Newton on 2001 June 15 for 53 ks. In this paper we concentrate on data from the EPIC pn (Strüder et al.2001) and MOS (Turner et al.2001) cameras, which were deployed in large and small window mode, respectively, both with the medium filter. All X-ray data were first screened with the XMM SAS v6.5 software and events corresponding to patterns 0-4 (single and double pixel events) selected for the pn camera and patterns 0-12 for the MOS1 and MOS2 cameras. We extracted source counts within a circular region of 45′′ radius defined around the centroid position of PG1211+143, with the background being taken from a similar region, offset from but close to the source. After removal of data during periods of high background the effective pn exposure was 49.5 ks while the MOS cameras were combined to give a single-camera-equivalent exposure of 107 ks. Individual spectra were binned to a minimum of 20 counts per bin, to facilitate use of the minimalisation technique in spectral fitting.
Spectral fitting was based on the Xspec package (Arnaud 1996), version 11.3. All spectral fits include absorption due to the line-of-sight Galactic column of (Murphy et al. 1996) and errors are quoted at the 90% confidence level ( for one interesting parameter).
3 Absorption lines in the EPIC data
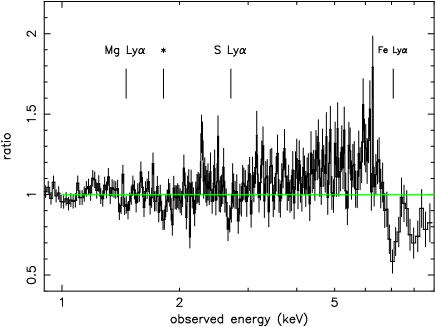
Figure 1 reproduces the ratio plot of pn data to a simple power law fit (photon index of 1.78) over the 1–10 keV band, as modelled in P03. Marked on the figure are 3 statistically significant ‘narrow’ absorption lines, with their identification as proposed in P03, where they formed a key part of the case for a high velocity outflow. Denoted by an asterix in figure 1 is a further ‘absorption line’ at 1.8 keV, which was not included in the P03 analysis due to prevailing uncertainties in the detector calibration near the neutral Si edge. Repeating the analysis in P03 by successively adding gaussian lines to the power law model in Xspec the observed absorption lines can be quantified. Fitting first the strongest line at 7 keV improves the fit by of 69 for 3 fewer degrees of freedom, with a line energy of 7.070.03 keV (observer frame), width =16846 eV and flux -5.70.9 ph cm-2 s-1, corresponding to an equivalent width against the power law continuum of 21035 eV. Fitting additional gaussians to the weaker spectral features at 2.7 and 1.5 keV, with line width fixed at =50 eV, gives further significant improvements to the fit, with of 17 and 16, respectively, each for 2 additional degrees of freedom. The best fit line energies, again in the observer frame, are 2.70.03 and 1.470.02 keV, with respective fluxes of -4.5 ph cm-2 s-1 and -5.7 ph cm-2 s-1 (EWs of 30eV and 14eV, accurate to a factor 2). Identifying the 3 absorption lines with the resonance Ly transitions of FeXXVI, SXVI and MgXII then yields the mean outflow velocity of 0.090.01c reported in P03.
3.1 Examining the higher resolution MOS spectrum
As noted in P03, the outflow velocity of 0.09c is conservative in that identifying the 7 keV feature with Fe XXV He, rather than FeXXVI Ly, would require a larger energy shift and correspondingly higher velocity. Encouraged by the impressive low energy spectra from the (higher resolution) MOS cameras, demonstrated in two recent studies of the Seyfert 2 galaxies Mkn3 (Pounds and Page 2005) and NGC1068 (Pounds and Vaughan 2006) we have re-examined the spectral structure in the XMM-Newton observation of PG1211+143, concentrating on the MOS data. Our aim was to clarify the spectral structure at medium and low energies in the hope of removing the ambiguity in identifying the 7 keV absorption line, and hence improving confidence in the deduced outflow velocity.


| Line | Energyobs | Energylab | ratio | line flux | EW | |
|---|---|---|---|---|---|---|
| NeX Ly | 1.0780.05 | 1.022 | 1.055 | -3.92.2 | 5 | 7 |
| MgXI 1s-2p | 1.4340.14 | 1.352 | 1.061 | -3.42 | 7 | 5 |
| MgXII Ly | 1.5460.02 | 1.473 | 1.050 | -6.41.5 | 16 | 29 |
| SiXIII 1s-2p | 2.0030.02 | 1.866 | 1.073 | -4.51.3 | 17 | 12 |
| SXV 1s-2p | 2.6250.06 | 2.460 | 1.067 | -3.31.9 | 21 | 10 |
| SXVI Ly | 2.7650.03 | 2.620 | 1.055 | -3.81.1 | 26 | 20 |
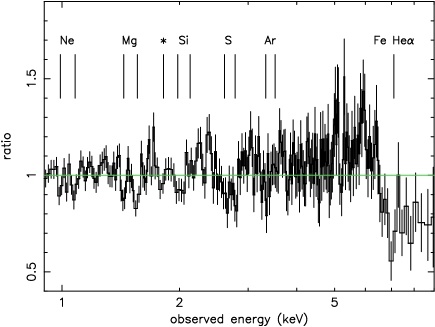
With the higher energy resolution of the MOS camera the absorption features at 1.47 keV and 2.71 keV now both appear as a resolved line pair, with the energy spacing of the respective He and Ly resonance lines of Mg and S. Furthermore, additional narrow absorption features are seen to match with same K-shell resonance lines of Ne, Si and possibly Ar.
To quantify these absorption features we explored the MOS data with Xspec. We first fitted the MOS data at 1-5 keV with a power law to provide a baseline; below 1 keV the spectrum rises steeply due to strong soft X-ray emission (Pounds and Reeves 2006). Several narrow features clearly visible in the data-to-power-law-model ratio plot (figure 3, upper panel) contributed to a poor statistical fit (=351/266). Fitting gaussians to the visible features, with a fixed width of = 10eV, found 6 significant negative (absorption) lines. The overall improvement to the fit was very significant with reduced to 270/254. The fitted line energies and fluxes are listed in Table 1 where the observed line energy is in each case compared with the most likely identification, chosen as the nearest resonance transition of an abundant ion. Crucially, all 6 line energies exhibit a ‘blue shift’ in the range 5-7 %. Assuming the same ratio for the absorption line observed at 7.07 keV gives a preferred identification with He of FeXXV (figure 2). In the rest frame of PG1211+143 the revised identification of the absorption spectrum now yields an increased outflow velocity in the range v0.13-0.15c.
4 Comparison with an ionised outflow
To test the compatibility of the visual absorption line set with a physical absorber we then compared the MOS data with a photoionised gas modelled using the XSTAR code (Kallman et al 1996). Free parameters of the absorber in this comparison were the column density and ionisation parameter, with outflow (or inflow) velocities included as an adjustment to the apparent redshift of the absorbing gas. All relevant abundant elements from Ne to Fe were included with the relative abundances constrained to within a factor 2 of solar.
Since our primary aim was to check the energies and relative strength of the principal absorption lines identified in the visual spectral fit shown in figure 2, the model did not attempt to match the broad excess flux near 6 keV; it therefore consisted only of a power law with photoionised absorber. Fitting over the 1-10 keV band the addition of the photoionised absorber improved the spectral fit from of 522 for 358 degrees of freedom to 465/345. The best-fit column density was NH cm-2, with an ionisation parameter of log=2.90.4 and nominal relative abundances of Ne, Mg, Si, S, Ar and Fe of 0.5, 1, 0.5, 1, 0.5 and 0.5. Figure 3 (mid panel) reproduces this absorbed power law model, with the strongest predicted absorption lines (in order of increasing energy) corresponding to K-shell resonance transitions of Ne, Mg, Si, S, Ar and Fe, supporting the visual assessment of figure 2. Additionally, we note the Ly line of MgXII would occur at 1.83 keV, suggesting much of the observed deficit at that energy may be real (and that our MOS calibration models the neutral Si edge rather well).


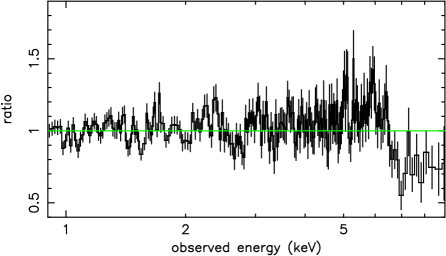
To clarify the comparison with the MOS data in the lower energy band, the upper panel of figure 3 illustrates the photoionised absorber with the Fe abundance set to zero. Removing Fe from the absorber also shows that potential confusion from Fe-L absorption is limited above 1.2 keV. The apparent redshift read from the XSTAR model was (-4.90.3) x 10-2, corresponding to an outflow velocity (in the rest frame of PG1211+143) of v0.1300.003c. While this value is consistent with the range of velocities of 0.13-0.15c deduced from the individual line fitting in Xspec, the implied precision is probably not justified given the simplicity of the single absorber XSTAR model.
Although the addition of a lower ionisation absorber would improve the match to the observed line ratios, in particular in providing stronger absorption for He-like Mg and Ne, we have not included a second absorber in the model, having already achieved our objective of modelling a high velocity outflow across multiple ions. However, it is interesting to note that the addition of a lower ionisation component would also enhance the ‘red wing’ to the Fe K absorption, already showing up in the XSTAR plot in figure 3 (mid panel), due to increased contributions from ions of FeXX-XXIV, and thereby explain the apparently resolved 7 keV absorption line (=16846 eV) in the pn spectrum.
In summary, modelling the MOS absorption spectrum with a photoionised absorber shows it to be physically compatible with a highly ionised outflow of velocity in the range 0.13-0.15c, as derived from individual line fitting.
4.1 A revised mass rate and energy in the high velocity flow
In their previous analysis of the PG1211+143 absorption line spectrum P03 showed that, provided the high velocity outflow was not tightly collimated, then the mass loss rate and mechanical energy in the flow would be comparable to the mass accretion rate and 10 % of the bolometric luminosity. We can now re-estimate those quantities. In doing so we use an estimate of 7% for the covering factor of the fast outflow, calculated by comparing the absorbed and re-emitted power in the highly ionised gas derived from a broad band fit to the full 0.3-10.0 keV spectrum of PG1211+143 (Pounds and Reeves 2006).
Assuming a radial flow, the outflow mass rate is then = 0.3.nr2.v.mp 0.2.Lion/.v.mp where n is the particle density at a radius r, and Lion erg s-1 is the ionising luminosity. With the observed ionisation parameter log3, we find gm s-1 (3.5 yr-1).
The corresponding mechanical energy in the fast, highly ionised outflow is then erg s-1, compared with an estimated bolometric luminosity for PG1211+143 of erg s-1. We note this ratio is a factor 3 higher than the ratio v/c expected from a radiation driven wind (King and Pounds 2003). However, given the undoubted simplification of our single-absorber model, and uncertainties in derivation of the covering factor, it is probably premature to adopt the popular appeal to magnetic forces to drive the outflow!
5 How common are energetic, high velocity flows?
The Black Hole Winds model of King and Pounds (2003) provided a simple physical basis whereby massive, high velocity outflows can be expected in AGN accreting near the Eddington limit. A simultaneous observation of PG1211+143 in 2001 with the XMM-Newton Optical Monitor (Mason et al. 2001) showed the energetically dominant BBB to be at a typical value, indicating a bolometric luminosity of erg s-1. With a reverberation mass estimate for the SMBH in PG1211+143 of (Kaspi et al. 2000) that luminosity suggests accretion in PG1211+143 is indeed near the Eddington rate, a conclusion consistent with the optical description of PG1211+143 as a Narrow Line QSO (Boroson and Green 1992, Kaspi et al. 2000), given that a high accretion ratio has been causally linked with Narrow Line Seyfert 1 galaxies (eg Pounds and Vaughan 2000 and references therein). It may well be that energetic outflows are a signature of Eddington-limited accretion in AGN. This might be the case for the bright Seyfert 1 IC4329A, which Markowitz et al.(2006) have recently shown to exhibit a strongly blue-shifted Fe K absorption line indicating a highly ionised outflow at v0.1c. While relatively rare in the local universe such X-ray spectra could be common for luminous, higher redshift AGN.
6 Summary
(1) A previous analysis of the 2001 XMM-Newton observation of the bright quasar PG1211+143 reported evidence of a high velocity ionised outflow, with a mass and kinetic energy comparable to the accretion mass and bolometric luminosity, respectively (P03).
(2) This finding is now confirmed, with the previous uncertainty in the derived velocity removed by securing the identification of the main observed absorption lines.
(4) We suggest that fast, energetic outflows may be a typical signature of type 1 AGN accreting at or close to the Eddington limit.
Acknowledgements
The results reported here are based on observations obtained with XMM-Newton, an ESA science mission with instruments and contributions directly funded by ESA Member States and the USA (NASA). The authors wish to thank the SOC and SSC teams for organising the XMM-Newton observations and initial data reduction. We also thank the anonymous referee for a careful reading of the text and constructive comments.
References
- [1] Arnaud K.A. 1996, ASP Conf. Series, 101, 17
- [2] Boroson T.A., Green R.F. 1992, ApJS, 80, 109
- [3] Chevallier L., Collin S., Dumont A.M., Czerny B., Mouchet M., Goncalves A.C., Goosmann R. 2006, astro-ph/0601464
- [4] Gierlinski M., Done C. 2004, MNRAS, 349, L7
- [5] Kallman T., Liedahl D., Osterheld A., Goldstein W., Kahn S. 1996, ApJ, 465, 994
- [6] Kaspi S. Smith P.S., Netzer H., Maoz D., Jannuzi B.T., Giveon U. et al.. 2000, ApJ, 533, 631
- [7] Kaspi S., Behar E. 2006, ApJ, 636, 674
- [8] King A.R., Pounds K.A. 2003, MNRAS, 345, 657
- [9] King A.R. 2005, ApJ, 635, 121
- [10] Markowitz A., Reeves J.N., Braito V. 2006, astro-ph/0604353
- [11] Marziani P., Sulentic J.W., Dultzin-Hacyan D., Clavani M., Moles M. 1996, ApJS, 104, 37
- [12] Murphy E.M., Lockman F.J., Laor A., Elvis M. 1996, ApJS, 105, 369
- [13] Pounds K.A., Reeves J.N., King A.R., Page K.L., O’Brien P.T., Turner M.J.L. 2003, MNRAS, 345, 705 (P03) see also Erratum in 2005, MNRAS, 356, 1599
- [14] Pounds K.A., Vaughan S. 2000, New Astron. Rev., 44, 431
- [15] Pounds K.A., Page K.L. 2005, MNRAS, 360, 1123
- [16] Pounds K.A., Vaughan S. 2006, MNRAS, 368, 707
- [17] Pounds K.A., Reeves J.N. 2006, in preparation
- [18] Strüder L.et al. 2001, A&A, 365, L18
- [19] Turner M.J.L.et al. 2001, A&A, 365, L27
- [20] Turner T.J., Pounds K.A. 1989, MNRAS, 240, 833
- [21] Wilkes B.J., Elvis M. 1987, ApJ, 323, 343