Sub-milliarcsecond Imaging of Sgr A* and M 87
Abstract
We present and discuss new result from mm-VLBI observations of M 87 and Sgr A*. The imaging of these sources with a spatial resolutions of a few to a few ten Schwarzschild radii offers new possibilities to study the immediate environment of super-massive black holes.
1 Introduction
In astronomy, the highest angular resolution is obtained with Very Long Baseline Interferometry (VLBI). VLBI observations at short millimeter wavelengths (mm-VLBI) provide angular resolutions in the ten micro-arcsecond range (i.e. as for a km baseline at mm ( GHz)). While VLBI observations at 2 mm and 1 mm wavelength are still in a stage of technical development, 3 mm VLBI experiments are performed on a regular basis.
The Global mm-VLBI Array (GMVA111web link: http://www.mpifr-bonn.mpg.de/old_mpifr/div/vlbi/globalmm) is operational since early 2000. At 86 GHz ( mm), it combines the European antennas (Effelsberg 100 m, Pico Veleta 30 m, the phased Plateau de Bure interferometer 6x15 m, Onsala 20 m, Metsähovi 14 m) with the VLBA. With the participation of the two sensitive IRAM telescopes and the 100 m Effelsberg telescope, the array sensitivity is improved by a factor of , when compared to the VLBA alone. For compact galactic and extragalactic radio sources, the GMVA provides VLBI images with an angular resolution of down to as.
In the following we present and discuss results from mm-VLBI observations of the nuclei of M 87 and of Sgr A*. When expressed in terms of Schwarzschild radii (), the spatial resolution obtained for M 87 and Sgr A* become very comparable. M 87 is about times more distant than Sgr A*, but has a putative black hole at its center, which is also times more massive than that of Sgr A*. Present day 3 mm-VLBI therefore allows to image both sources with a spatial resolution of only . In view of the morphological difference between Sgr A* and M 87 (the latter exhibits a long relativistic jet), a comparison of the sub-milliarcsecond structure and kinematics of both objects may lead to a better understanding of the astro-physical processes acting in the vicinity of such super-massive black holes.
2 3 mm VLBI observations of M 87
The giant elliptical galaxy M 87 (NGC 4486, 3C 274, Virgo A) is one of the closest radio galaxies with a prominent radio jet. Its relative brightness at millimeter wavelengths makes it ideally suited for high angular resolution mm-VLBI studies, which address the still unanswered question how the powerful jets in radio-galaxies and quasars are launched and collimated.
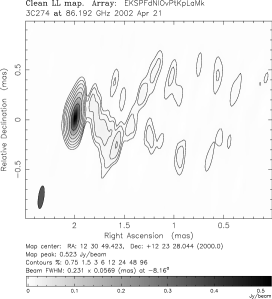
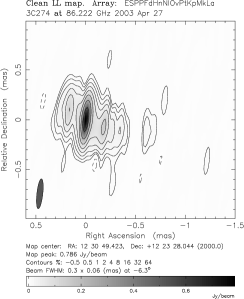
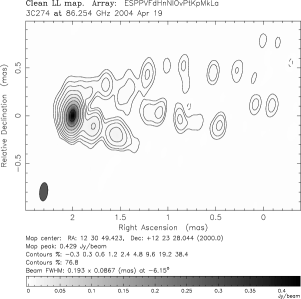
At a distance of D=16.75 Mpc (Whitmore et al. 199) an angular scale of 0.1 mas corresponds to a spatial scale of cm (0.0081 pc). This translates to Schwarzschild radii for an assumed super-massive black hole at the center of M 87 (e.g. Machetto et al. 1997). Global 3 mm VLBI observations, performed at the edge of the accessible VLBI observing bands, have revealed new images of the inner-most region of M 87. The 3 mm VLBI images shown in Figure 1 were made from observations performed during 2002–2004 and show a one-sided core-jet structure, extending mas to the west. The complexity of the source structure and the only moderate dynamic range of the maps (lower sensitivity in earlier observations) do not yet allow to relate the individual structural components seen at the different epochs with each other and by this determine the jet kinematics. Despite the obvious limitations, which will be overcome in the near future, a number of basic statements can already be made:
(i) In the maps, an unresolved compact component at the eastern end of the jet is seen. An upper limit to its size is given by the (elliptical) VLBI observing beam. The uniformly weighted and un-tapered beam size of the observations of April 2004 is as, which gives an upper limit to the size of the jet base (VLBI core) of . Circular Gaussian model fitting yields a typical flux density of Jy and a size of as () for the VLBI core. This results in a brightness temperature of K, clearly indicative of non-thermal (synchrotron) radiation.
(ii) The 86 GHz VLBI map of April 2004 looks remarkably similar to two previously observed 43 GHz VLBI maps, which indicate conical jet-expansion on sub-milliarcsecond scales (Junor et al. 1999, Ly et al. 2004). The new 86 GHz maps, which have a times higher resolution, reveal a bifurcated (possibly edge-brightened) expanding one-sided jet, with the southern edge of the emission cone being brighter and more compact than the northern part. The fact that the northern edge of the cone (at mas) is almost invisible in the maps of 2002 and 2003 may be explained with dynamic range limitations in these two maps.
(iii) The large morphological differences seen between the three 86 GHz maps indicate structural variations on time-scales of less than one year. On angular scales mas, all three maps show some south-west oriented jet emission oriented along a position angle of . In April 2003, the source was times brighter than usual, and a bright component was seen at the map center (at zero position). Since in hybrid VLBI imaging using closure phases the absolute position information is lost, this bright component most likely should not be identified with the jet base (VLBI-core). Instead, the fainter component located mas in the north-east, may be identified with the VLBI-core. We note the tentative detection of a possible counter-jet at 43 GHz (Ly et al. 2004), which however was not seen earlier (Junor et al. 1999), nor at longer wavelengths (Dodson et al. 2006), nor in our 86 GHz VLBI maps of 2002 and 2004.
(iv) Owing to the limited time sampling at 86 GHz, a detailed kinematic study of the component motion in the inner jet of M 87 is not yet possible. Similar to the case of many other VLBI jets, we may assume that the bright central component seen in April 2003 was ejected from the VLBI core after a flux density outburst. This would give an apparent rate of change of mas/yr, corresponding to an apparent velocity of c. This speed would be consistent with the observed motion of c seen at larger core separations with VLBI at 15 GHz (Kellermann et al. 2004), and with a lower limit of 0.25 c from VLBI at 43 GHz (Ly et al. 2004b). On the other hand, if we compare the relative positions of the two main secondary components seen in April 2002 and April 2004 (at mas & mas, respectively) stationarity of the inner jet components cannot be excluded. More frequent VLBI observations are necessary to determine the jet kinematics.
We like to point out that a measurement of VLBI core size and of the jet’s transverse width as a function of core separation, are very important parameters for theoretical jet models. The class of models, which are based on the magnetic sling shot mechanism (Blandford & Payne 1982) predict a minimum transverse width of the jet after initial acceleration to be of order , (with bulk Lorentz factor and light cylinder radius , e.g. Tomimatsu & Takahashi 2003). Notably such jets are expected to be hollow (edge-brightened), just as observed here. After collimation, the light cylinder has a radius of at least (Camenzind 1990, Fendt & Memola, 2001, Casse & Keppens 2004), which sets a lower bound to the observable jet width. With jet Lorentz-factors in the range (Biretta et al. 1999), we expect a minimum jet width of . The observed diameter of the jet (at mas) is mas, or (see Figure 1). This is at the lower end of the expected range, favoring a moderately low bulk Lorentz-factor () in this region.
At its origin near the black hole, the diameter of the jet depends on the size of the region, where it is initially accelerated. In the Blandford & Payne type models, the twisted magnetic field lines are anchored in the inner part of the rotating accretion disk. The minimum jet width is then determined by the diameter of the least stable orbit, which is at for a Schwarzschild BH, and for a rotating Kerr BH (e.g. Meier et al. 2001). The observed small size of the VLBI core () is already within a factor of near these values, suggesting that the width of the ‘jet-nozzle’ is indeed of order of the light cylinder diameter. Since the radiating jet boundary cannot be indefinitely thin, one could expect that the observed jet width is a bit larger than the light cylinder. In this case, the observed small size of the VLBI core would point more towards jet models, in which the jet gains energy directly from BH-rotation (Blandford & Znajek 1977, see also McKinney 2006). Better VLBI images and more specific theoretical modeling of jet opening angle and speed will help to discriminate between the different types of models (e.g. Blandford & Payne versus Blandford & Znajek), and may tell to what degree black hole rotation plays a role in jet formation.

3 VLBI observations of Sgr A* at 3, 2, and 1 mm wavelength
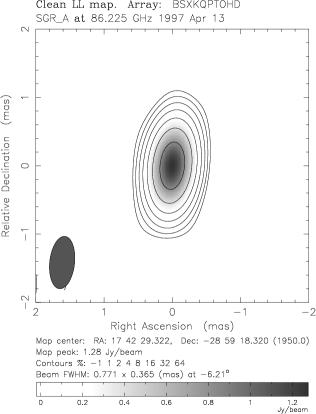
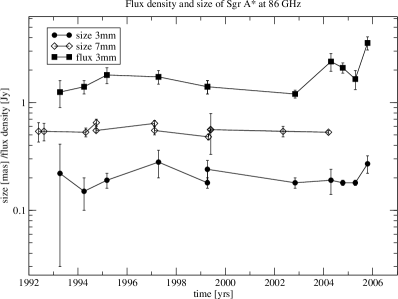
3 mm: From the early 1990’s onwards, Sgr A* was repeatedly observed with VLBI at 3.5 mm (86 GHz) in various array configurations, using European, American and global VLBI arrays (Krichbaum et al. 1994, Rogers et al. 1994, Doeleman et al. 2001, etc.). In Figure 2 we show one of the early maps from global 3 mm VLBI, which reveals a partially resolved point sources, similar to the recently published VLBA image (Shen et al. 2005). At mm-wavelengths, the accurate determination of flux density and size is often affected by calibration uncertainties (low source elevation on the northern hemisphere, atmospheric opacity variations). This requires special observing and calibration methods. In parallel to the ongoing research with the VLBA, we have continued to observed Sgr A*, using the sensitive and large antennas at MPIfR (Effelsberg 100 m telescope) and at IRAM (Pico Veleta 30 m, Plateau de Bure 6 x 15 m). With baseline lengths of km, and a detection sensitivity of mJy (, 512 Mbit/sec) per baseline, this array measures the visibility amplitudes and (closure-) phases with particular high . In April and October 2004, Sgr A* was moderately bright with flux densities of Jy and Jy, respectively. In October 2005, however, the source was detected with a much higher signal-to-noise ratio than before ( on PV-PdB). A preliminary analysis of the new data yields (via circular Gaussian model fitting) a flux density of Jy and a size of mas. The relatively high source flux is confirmed independently by ATCA measurements, performed 3 days after our VLBI experiment ( Jy, Z.-Q. Shen, priv. comm.). The source size appears marginally larger (by ), when compared to our previous size measurements in 2004 ( mas and mas), and in comparison to the VLBA measurements of Shen et al. 2005, who obtained mas with the VLBA. As in previous observations, the closure phase (see Figure 3) is close to zero (within ), showing no evidence for a deviation from the known point-like (or symmetric) structure. In Figure 5, we plot all available 86 GHz VLBI size measurements, using the data from the literature and including own unpublished old and new data. If one excludes the new data point of October 2005, the weighted mean average size is mas. This appears significantly smaller than the October 2005 measurement. For comparison we also show in Fig. 5 the sizes at 43 GHz (weighted mean: mas) and the flux density of Sgr A* at 86 GHz. It will need a denser 3 mm VLBI monitoring to check, if the brightness distribution of Sgr A* indeed is variable. In view of the observed flux density variations at millimeter wavelengths (see Miyoshi et al., Miyazaki et al., Marrone et al., this conference), structural variability of Sgr A* would be not unexpected (see Bower et al. 2004 for possible size variations at 7 mm).
2 mm: VLBI observations at wavelengths shorter than 3 mm are still difficult and are limited by the number of available radio telescopes and their sensitivity. In a pilot VLBI experiment at 147 GHz (2 mm), which aimed at first fringe detection across the Atlantic at this short wavelength, Sgr A* was observed among a dozen other AGN (Krichbaum et al. 2002). Several AGN were detected on the long ( km) baseline between Spain (Pico Veleta) and the Arizona telescopes (Kitt Peak (KP) 12 m, Heinrich-Hertz telescope (HHT) 10 m), which limits the size of their compact emission regions to as. Sgr A* was detected with a signal-to-noise ratio of on the short (85 M) baseline between KP and HHT. With a total flux density of Jy and a correlated flux density of Jy an upper limit to its size of mas can be derived, fully consistent with the measured sizes at 3 mm and 1.4 mm.


1 mm: In April 2003, our attempt to observe Sgr A* with global VLBI at 230 GHz failed due to weather and technical problems. In this experiment, which was motivated in a similar manner as the 2 mm VLBI experiment described before, several bright AGN were observed. Finally two blazars (3C 454.3, 0716+714) were detected with on the 6.4 G baseline between Pico Veleta and HHT (Krichbaum et al. 2004). Although limited by receiver performance and stability of local oscillators at HHT, this experiment demonstrates the technical feasibility of global VLBI at 1.3 mm, and sets a new record in angular resolution. For the detected compact radio sources we obtained sizes of as. With such a high angular resolution, which would correspond to a spatial resolution of Schwarzschild radii in Sgr A*, the direct (VLBI-) imaging of the immediate vicinity of a SMBH should become possible within the next few years.
We now like to make a remark with regard to the previous 215 GHz VLBI observations of Sgr A* published earlier (Krichbaum et al. 1998). Recently, Eckart et al. 2006 (also Eckart et al., this conference) detect an emission component D1 of mas size, located mas west of Sgr A*. With single dish radio telescopes operating at short mm-/sub-mm wavelengths, in-beam confusion between Sgr A* and D1 leads to an over-estimate of the total flux density of Sgr A* in this spectral band (by Jy for K), at least partially removing the so called sub-mm excess (e.g.. Serabyn et al. 1997, Falcke et al. 1998). In fact, a less pronounced or non-existing sub-mm excess, leads to a flat synchrotron-self-absorbed radio spectrum as observed in many other AGN. This then would allow an interpretation of the high energy data via the synchrotron-self-Compton process (see Eckart et al. 2004 & 2006).
The existence of such an extended emission region, which is fully resolved and therefore invisible to VLBI, was considered by Krichbaum et al. 1998 as a possibility to explain the apparent discrepancy between observed total flux (from single antenna measurements) and the correlated VLBI flux, which originates from the compact component. Relating the sub-mm excess of the total spectrum mainly to the flux contribution of component D1, allows to redetermine the total flux of Sgr A* at 215 GHz and reject ‘case 1’ in the discussion of Krichbaum et al. 1998. This leads to refined estimate of the observed size for Sgr A* at 215 GHz: as, which corresponds to a linear size of Schwarzschild radii and a robust lower limit of .
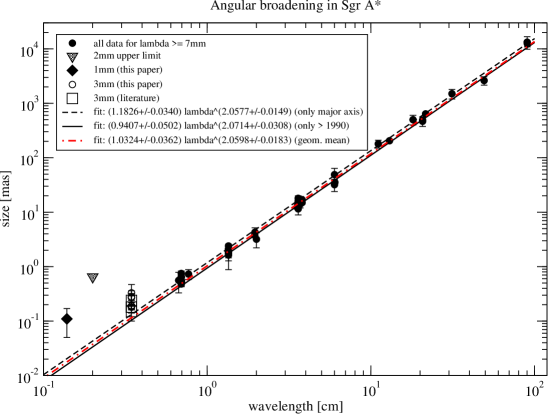
4 Intrinsic Source Size
The observed frequency dependence of the source size of Sgr A* (Fig. 4) is commonly interpreted as being due to scatter broadening by the intervening interstellar medium. The intrinsic size is determined by the deconvolution of the observed size with the extrapolated scattering size : . The exact form of the assumed scattering law (, with fit parameters ) determines . In Figure 4 we show a few illustrative least-square fit lines, which were obtained from all at present available size measurements, selecting those above cm222these wavelengths should be least affected by a finite intrinsic source size and performing a fit to (i) only the major axis, (ii) the geometric mean of major and minor axis, and (iii) the most recent () data. The resulting mean slopes in the range of deviate slightly from the slope of other authors recently have used (Bower et al. 2004, Shen et al. 2005 and references therein). Depending on the number of data points included in the fit, their weighting scheme and the frequency range over which the fit is performed, one obtains slightly different estimates of the intrinsic size of Sgr A*. Since the size determination at the shortest wavelengths ( mm) is still restricted to a circular Gaussian component, we determine the de-convolved intrinsic size of Sgr A* using the geometric mean size from major and minor axis at all wavelengths. Formally we obtain the following sizes333For kpc and an angle of 0.1 mas corresponds to : at 7 mm, at 3.4 mm, at 2 mm, and at 1.4 mm.
5 Future Outlook
Global mm-VLBI performed at the shortest wavelengths ( mm) will allow to study Sgr A* (and other AGN like, e.g. M 87) with a resolution of only a few Schwarzschild radii, facilitating the direct imaging of the immediate vicinity of super-massive black holes. Global mm-VLBI observations of Sgr A* are clearly a great challenge and demand coordinated efforts. In Figure 6 we show simulations of visibility amplitudes and closure phases for a realistic near future global mm-VLBI observation of Sgr A* at 230 GHz. New telescopes like APEX (to be later replaced by ALMA) located in the southern hemisphere, and phased interferometers operating as single VLBI antennas (PdB, CARMA, SMA) are crucial to provide the necessary sensitivity on the longest baselines. When these telescopes become available for mm-VLBI, we may hope to image the environment of the SMBH in Sgr A* and detect possible deviations from circular symmetry, which are theoretically predicted for a rotating accretion disk black hole system.
References
References
- [1] Blandford R.D., & Znajek R.L., 1977, MN 179, 433.
- [2] Blandford R.D., & Payne D.G., 1982, MN 199, 883.
- [3] Biretta J.A., Sparks W.B., Machetto F., 1999, ApJ 520, 621.
- [4] Bower G.C., et al. 2004, Sci 304, 704.
- [5] Casse F., & Keppens R., 2004, ApJ 601, 90.
- [6] Camenzind M., 1990, RvMA 3, 234.
- [7] Doeleman S.S, Shen Z.-Q., Rogers A.E.E., et al., 2001, ApJ 121, 2610.
- [8] Dodson R., Edwards P.G., Hirabayashi H., PASJ 58, 253.
- [9] Eckart A., Baganoff F.K., Morris M., et al., 2004, A&A 427, 1.
- [10] Eckart A., Baganoff F.K., Schödel R., et al., 2006, A&A 450, 535.
- [11] Falcke H., Goss W.M., Matsuo,H., et al., 1998, ApJ 499, 731.
- [12] Fendt C., & Memola E., 2001, A&A 365, 631.
- [13] Junor W., Biretta J.A., Livio M., 1999, Nat 401, 891.
- [14] Kellermann K.I., Lister M.L., Homan D.C., et al., ApJ 609, 539.
- [15] Krichbaum T.P., et al., 1994, IAU Symp. No. 159, ed. T. Courvoisier & A. Blecha, Kluwer, p. 187.
- [16] Krichbaum T.P., Graham D.A., Witzel A., et al., 1998, A&A 335, 106.
- [17] Krichbaum T.P., et al. 2002, in: 6th EVN Symp., ed. E. Ros et al., MPIfR, Bonn, p. 125 (astro-ph/0207022).
- [18] Krichbaum T.P., et al. 2004, in: 7th EVN Symp., ed. R. Bachiller et al., OAN, Toledo, p. 15 (astro-ph/0411487).
- [19] Ly C., Walker R.C., & Wrobel J.M., 2004, AJ 127, 119.
- [20] Ly C., Walker R.C., & Junor W., 2004b, AAS 205, #110.01
- [21] Machetto F.D., Marconi A., Axon D.J., et al., 1997, ApJ 489, 597.
- [22] McKinney J.C., 2006, MN 368, 1561.
- [23] Meier D.L., Koide S., Uchida Y., 2001, Sci 291, 84.
- [24] Serabyn E., Carlstrom J., Lay O., et al., 1997, ApJ 490, 77.
- [25] Shen Z.-Q., Lo K.Y., Liang M.-C., et al., 2005, Nat 438, 62.
- [26] Rogers A.E.E., Doeleman S.S, Wright M.C.H., et al., 1994, ApJ 434, L59.
- [27] Tomimatsu A., & Takahashi M., 2003, ApJ 592, 321.
- [28] Whitmore B.C., Sparks W.B., Lucas R.A., et al., 1995, ApJ 454, L73.