Discovery of H absorption in the unusual broad absorption line quasar SDSS J083942.11+380526.3 111Based in part on data collected at Subaru Telescope, which is operated by the National Astronomical Observatory of Japan.
Abstract
We discovered an H absorption in a broad H emission line of an unusual broad absorption line quasar, SDSS J083942.11+380526.3 at , by near-infrared spectroscopy with the Cooled Infrared Spectrograph and Camera for OHS (CISCO) on the Subaru telescope. The Presence of non-stellar H absorption is known only in the Seyfert galaxy NGC 4151 to date, thus our discovery is the first case for quasars. The H absorption line is blueshifted by 520 km s-1 relative to the H emission line, and its redshift almost coincides with those of UV low-ionization metal absorption lines. The width of the H absorption ( km s-1) is similar to those of the UV low-ionization absorption lines. These facts suggest that the H and the low-ionization metal absorption lines are produced by the same low-ionization gas which has a substantial amount of neutral gas. The column density of the neutral hydrogen is estimated to be cm-2 by assuming a gas temperature of 10,000 K from the analysis of the curve of growth. The continuum spectrum is reproduced by a reddened ( mag for the SMC-like reddening law) composite quasar spectrum. Furthermore, the UV spectrum of SDSS J083942.11+380526.3 shows a remarkable similarity to that of NGC 4151 in its low state, suggesting the physical condition of the absorber in SDSS J083942.11+380526.3 is similar to that of NGC 4151 in the low state. As proposed for NGC 4151, SDSS J083942.11+380526.3 may be also seen through the close direction of the surface of the obscuring torus.
1 INTRODUCTION
Broad absorption line (BAL) quasars are characterized by the absorption troughs of UV resonance lines of which velocity widths are typically km s-1. The troughs are blueshifted relative to emission lines from 2,000 km s-1 to as much as 0.2c. BAL quasars are divided into three subtypes depending on what kind of ions seen as absorption. High-ionization BAL quasars (HiBALs) show absorption from C IV, N V, Si IV and Ly. Low-ionization BAL quasars (LoBALs) show absorption from Mg II, Al III, and Al II, in addition to the high-ionization absorption. A fraction of LoBALs show absorption from excited fine-structure levels of the ground term and excited terms of Fe II and Fe III (Hazard et al., 1987; Becker et al., 1997, 2000; Hall et al., 2002). They are called iron LoBALs (FeLoBALs). BAL quasars occupy 10-20% of optically selected quasars (Weymann et al., 1991; Hewett & Foltz, 2003; Reichard et al., 2003). The fraction of LoBALs among BAL quasars is 13-15%, and % in all quasars (Weymann et al., 1991; Reichard et al., 2003). FeLoBALs are rare and comprise only 15% of LoBALs (Hall et al., 2002).
The number of known FeLoBALs has been increasing. After discovery of the first FeLoBAL LBQS 0059-2735 (Hazard et al., 1987), Cowie et al. (1994) discovered a similar object to this in their K-band survey (Hawaii 167). Becker et al. (1997, 2000) also discovered five FeLoBALs in their radio-selected quasar sample, FIRST Bright Quasar Survey (FBQS; White et al., 2000). The Sloan Digital Sky Survey (SDSS; York et al., 2000) is dramatically increasing the number of FeLoBALs. Reichard et al. (2003) discovered 10 FeLoBALs in SDSS Early Data Release quasar catalog (Schneider et al., 2002). Hall et al. (2002) identified more than one dozen of FeLoBALs whose characteristics of spectra are much different from those of previously known BAL quasars. Some of them have tremendous numbers of UV absorption lines. Others have absorption troughs which removes almost (%) all the flux shortward of Mg II. At least one FeLoBAL has Fe III absorption but does not have Fe II absorption. Many of them are heavily reddened by up to mag. Such unusual FeLoBALs may occupy a new parameter space (the black hole mass, mass accretion rate, viewing angle, outflow rate etc.) of quasars. An Extensive search for such BAL quasars is therefore important to understand the structure and evolution of quasars.
There is still no consensus concerning whether BAL quasars are intrinsically different from non-BAL quasars. Weymann et al. (1991) pointed out the close similarity in the emission-line and continuum properties of BAL quasars and non-BAL quasars. They concluded that BAL quasars are non-BAL quasars seen from a different viewing angle, i.e., both types of quasars belong to the same population. The results of spectropolarimetry of BAL quasars (e.g., Goodrich & Miller, 1995; Cohen et al., 1995; Hines & Wills, 1995; Ogle et al., 1999; Schmidt & Hines, 1999) have also been interpreted in such a way that BAL quasars are quasars seen through the edge of the obscuring tori. On the other hand, some authors argue that BAL quasars, especially LoBALs, are young or recently refueled quasars (Boroson & Meyers, 1992; Voit, Weymann & Korista, 1993; Becker et al., 2000). They infer that the absorption troughs of BAL quasars appear when the nuclei are blowing the obscuring dust off; through this BAL phase, quasars may evolve from a dust-enshrouded stage (the infrared luminosity is therefore expected to be large) to a normal quasar phase (Sanders et al., 1988). All four LoBALs/FeLoBALs currently known at are, in fact, ultraluminous infrared () galaxies and major mergers (Canalizo & Stockton, 2002). The discovery of a population of unusual BAL quasars (Hall et al., 2002) may suggest there is a population in different evolutionary phase or structure.
During our search for LoBALs and FeLoBALs by visual inspection of spectra between redshifts of 2.1 and 2.8 in the SDSS Data Release 3 (DR3; Abazajian et al., 2005), we found an unusual BAL quasar, SDSS J083942.11+380526.3 (hereafter SDSS J0839+3805). Photometric data of SDSS J0839+3805 from SDSS DR3 and the Two Micron All Sky Survey (2MASS) Point Source Catalog are tabulated in Table 1. The absolute magnitude in the band of SDSS J0839+3805 is mag (AB) with the correction (Schneider et al., 2005) by assuming km s-1 Mpc-1, , and . Figure 1 shows its rest UV spectrum from SDSS data. SDSS J0839+3805 is a FeLoBAL; it shows the absorption in the excited-state Fe II as well as C IV and Al III . The troughs at wavelengths between 7700 Å and 8000 Å and between 8500 Å and 8700 Å are from the excited levels of the ground term and the excited term of Fe II. It also shows absorption of low-ionization metal lines at such as Si II , Al II , Zn II , and Cr II . The spectrum is very similar to those of so-called “many-narrow-trough” BAL quasars, especially SDSS J112526.13+002901.3 (Hall et al., 2002).
Since the Ly emission line is narrow ( km s-1) and there are no broad emission lines such as C IV, C III], and N V in the rest UV spectrum of SDSS J0839+3805, we carried out near-infrared spectroscopy in order to examine properties of H and H emission lines. According to its redshift of 2.3163 which is measured by the peak of Ly emission line, H and H are expected to be redshifted into and bands, respectively. Note that all wavelengths in this paper are vacuum wavelengths.
2 OBSERVATIONS AND DATA REDUCTION
The - and -band spectra of SDSS J0839+3805 were obtained with the Cooled Infrared Spectrograph and Camera for OHS (CISCO) (Motohara et al., 2002) attached to the Subaru 8.2-m telescope (Iye et al., 2004) on 2005 March 26 (UT). It was cloudy, but the seeing was good (″ in band). The slit width was set to be 0.6″. This results in a resolution of 50 Å and 46 Å in band and band (i.e. ), respectively, which were measured by using night sky lines. The slit position angle was 0°. We obtained 4 exposures in each band, dithering the telescope to observe the quasar at two positions with a separation of 10″ along the slit. The total integration times on the quasar were 1000 s (250 s ) in band and 1200 s (300 s ) in band. The A0 star SAO 061318 was observed immediately after the observation of SDSS J0839+3805 for sensitivity calibration and removal of atmospheric absorption lines.
The data were reduced using IRAF222IRAF is distributed by the National Optical Astronomy Observatories, which is operated by the Association of Universities for Research in Astronomy, Inc. (AURA) under cooperative agreement with the National Science Foundation. in the standard procedure of flat fielding, sky subtraction, and residual sky subtraction. Wavelength calibration was performed using OH night sky lines. The rms wavelength calibration error is 2.6 Å in band and 1.5 Å in band, corresponding to 36 km s-1 at 21780 Å (redshifted H line of the SDSS J0839+3805) and 28 km s-1 at 16170 Å (redshifted H line), respectively. The sensitivity calibration was performed as a function of wavelength and the atmospheric absorption feature was removed by using the spectrum of SAO 061318. Since the weather condition was not photometric, the absolute flux calibration was made using photometry in the 2MASS Point Source Catalog as described later.
3 RESULTS
Figure 2 displays the -band spectrum of SDSS J0839+3805 as well as the fitting result. It clearly shows the presence of a strong H broad emission line with an absorption line. The absorption line is clearly visible in all the spectra from the individual exposures. The absorption line must be real since there is no atmospheric absorption line at this wavelength and no bad pixel at this position of the detector. In addition, the spectrum of the standard star does not show any absorption features at the same wavelength. The H emission line was fitted with a combination of three Gaussians and a linear continuum by using the wavelength regions of the spectra free of absorption features. The model profile thus constructed is shown as a solid line in Figure 2. The peak wavelength of H of the model profile is Å, and the redshift is . The H emission therefore appears to be slightly redshifted ( 140 km s-1) compared to Ly. However, the uncertainty of the redshift is larger than this nominal error due to the significant absorption around the emission line peak; it would be about (180 km s-1). The H emission is thus at the same velocity as Ly emission within the uncertainty. The FWHM is corrected for the instrumental broadening by using the simple assumption: , where is the observed FWHM of the line and is an instrumental FWHM. The of H is km s-1 and is much broader than that of Ly. In order to measure the equivalent width (EW) of H absorption, the spectrum is normalized by its effective continuum which includes both the continuum and broad emission line. The rest EW of the absorption line is calculated to be 8.0 Å. However, since the absorption is strong enough to distort the emission-line profile, it is hard to accurately restore the observed emission-line profile to the original one without the absorption line. This indicates that there is significant uncertainty in the effective continuum and therefore the EW of the H absorption. We estimate a lower limit of this EW by using an extreme case of effective continuum, which is shown as the dotted line in Figure 2. The lower limit of EW thus obtained is 4.9 Å. The redshift determined by the bottom of the H absorption line is , and is blueshifted by 520 km s-1 relative to the H emission line. The of the absorption line is km s-1. Since the is km s-1 at band, the line is marginally resolved and the is km s-1. The properties of absorption lines and emission lines are tabulated in Table 2.
Figure 3a displays the -band spectrum of SDSS J0839+3805. The signal-to-noise ratio of the spectrum is not high because of the worse weather and strong OH sky emission lines. The feature at m is H emission line, and the feature at m is probably [O III] 333This is vacuum wavelength.. A narrow absorption-like feature is seen at m in the H emission line. However, since its width (25 Å) is significantly narrower than the spectral resolution (46 Å), it is not real. The -band spectrum was modeled with a combination of Gaussians representing the H broad emission line and [O III] emission lines, and a linear continuum. The result is displayed in Figure 3a with a solid line as well as in Table 2. In order to trace the asymmetric shape, we fitted the H emission profile with two Gaussians. We ignored the possible absorption feature corresponding to the H absorption. The peak of the model H emission-line profile is at m () and it is redshifted by 640 km s-1 relative to the H emission. This apparent redshift relative to the H emission is probably caused by absorption at the blue side of the H emission line. The of H emission is km s-1, which is much narrower than that of H emission. This would also be expected if an absorption line exists and distorts the H emission at the blue side as stated above.
We fitted [O III] with a Gaussian for each line. The width and redshift were assumed to be the same for both of these two [O III] lines (see Table 2), and the intensity ratio of [O III] to was fixed to be 3.0. The peak of [O III] is at m (). The [O III] emission line is blueshifted by 480 km s-1 relative to the H emission. The width of [O III] emission line is resolved and the is km s-1. Such broad and blueshifted [O III] emission line has been discovered in more than one dozen of narrow-line Seyfert1s and narrow-line quasars (Aoki, Kawaguchi, & Ohta, 2005; Marziani et al., 2003; Zamanov et al., 2002). We note that rest-frame EW of [O III] is Å for SDSS J0839+3805, which is much larger than those found in other LoBALs/FeLoBALs. All four LoBALs/FeLoBALs in Boroson & Meyers (1992) have no or weak [O III] (EW Å). The EWs of six LoBALs in Yuan & Wills (2003) are less than 6 Å. The current observations suggest that [O III] in LoBALs/FeLoBALs is weak in general, and the strength of [O III] in SDSS J0839+3805 is exceptional. There is, however, only a dozen observations of [O III] in LoBALs/FeLoBALs. We should wait for more observations.
The -band spectrum is shown in Figure 3b. The possible absorption feature at m may be He I . If the absorption is real, its redshift is , and rest EW is Å. The line is marginally resolved and the is km s-1. The redshift and FWHM are similar to those of the H absorption.
4 DISCUSSION
4.1 H Absorption
Our spectroscopy discovers the presence of an H absorption line in SDSS J0839+3805. This is the first case for detection of the H absorption among quasars. The H absorption of SDSS J0839+3805 is deeper than continuum height. Since an absorber cannot remove more light from a continuum than is initially present and the depth of the absorption exceeds the height of the continuum, the absorption line is of non-stellar origin. We cannot consider the case where only the continuum suffers from absorption. Two cases are possible: both the continuum and broad emission-line region suffers from absorption or only the broad emission-line does. In either case the absorber is thus located outside the broad emission-line region, and absorbs at least partially the light from the broad emission-line region.
In order to compare the H absorption to UV absorption lines, we measured their redshifts and widths in the spectrum of SDSS DR3. We selected low-ionization lines and less blended lines. The results are tabulated in Table 3. The redshifts of UV low-ionization absorption lines are almost the same as that of the H absorption line. The widths of the UV low-ionization absorption lines are 360 (Zn II) – 880 (Si II) km s-1 which are similar to that of H absorption. These facts suggest that the H and UV low-ionization absorption lines are produced by the same outflowing low-ionization gas which contains a substantial amount of neutral gas.
Since our spectroscopy resolved marginally the absorption line profile, the column density can be derived from the curve of growth (Spitzer, 1978). The FWHMtrue of the H absorption line is 340 km s-1, corresponding to the Doppler parameter of km s-1 [FWHM/(4 ln 2)1/2]. The EW of 8.0 Å is on the “linear” regime of the curve of growth for H with 200 km s-1, and the column density for the hydrogen atoms which absorb H photons is . In the case of the extremely low EW (4.9 Å), the column density would be . Assuming that the absorber is in thermal equilibrium at a temperature of 10,000 K, the number ratio of hydrogen atoms at the level relative to those at the ground level is calculated to be using the Boltzmann equation. Therefore the neutral hydrogen column density is expected to be . The lack of information about the temperature of the absorber is the limitation of our analysis; high resolution spectroscopy of the H absorption is needed. We cannot be certain whether the absorption is saturated or not from our low-resolution spectroscopy. As a result, we cannot determine whether the absorber fully covers the continuum and the broad emission-line region. In case of the partial coverage of either sources, our effective continuum used in the above analysis would be an overestimate. The EW and column density would therefore be underestimates. On the other hand, since the level population is very sensitive to a temperature, the number ratio of hydrogen atoms at the level relative to those at the ground level would be larger if the temperature is higher than 10,000 K. The column density would be overestimate in that case. The uncertainty in temperature may cause an orders-of-magnitude error in column density.
4.2 Reddening of the Continuum
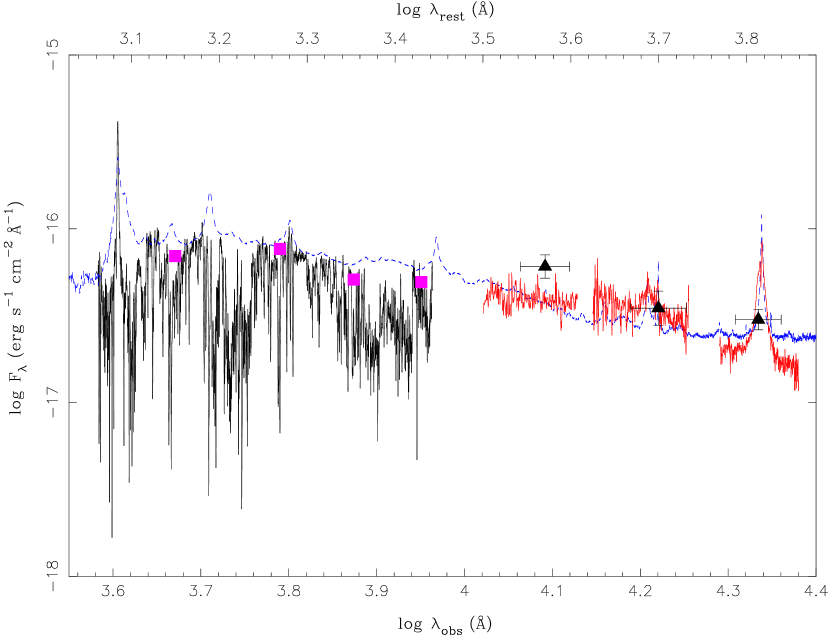
Since the color of SDSS J0839+3805 ( mag and mag) is redder than the median color of quasars at ( mag and mag) in SDSS (Richards et al., 2003), the spectrum is probably reddened. In order to estimate the reddening, we assume the presence of dust in the quasar with the SMC-like reddening law (Pei, 1992). We also tried two other types of reddening law (Milky Way and LMC), but the Milky Way-like reddening law is rejected by the absence of the 2200 Å feature in the spectrum. Though LMC-like reddening law is acceptable, the SMC-like reddening law gives us a better fit to the observed spectrum. We also assume the composite quasar spectrum from the SDSS (Vanden Berk et al., 2001) as the unreddened spectrum. The spectral energy distribution (SED) of SDSS J0839+3805 is composed of the spectrum from the SDSS DR3, the photometry from 2MASS and our spectra, and shown in Figure 4. We also plotted the SDSS photometric data except for band with the SED in Figure 4. Our spectra were scaled to the 2MASS photometric data. Since our - and -band spectra were taken simultaneously, the scaling factors should be the same value. But they are different by 50%. As seen in Figure 4, the -band 2MASS photometry looks discrepant from the SDSS data, 2MASS - and -band data. We therefore scaled both - and -band spectra by using the factor adequate for the -band spectrum. The SDSS photometric data match the SDSS spectrum well.
The SED of SDSS J0839+3805 is reasonably well reproduced by a reddened SDSS composite spectrum with a reddening of mag, which is shown by a blue dashed line in Figure 4; the reddened composite spectrum delineates the continuum level of the spectrum of SDSS J0839+3805. This amount of reddening is larger than those derived from comparisons between the composite spectrum of LoBALs and that of non-BAL quasars. Brotherton et al. (2001) estimated that LoBALs composite is reddened by mag by using the data from FBQS, and Reichard et al. (2003) found the average reddening for LoBALs is mag from SDSS data. However, two known FeLoBALs are extremely reddened. Hawaii 167 has mag (Egami et al., 1996), and FIRST J155633.8+351758 has mag (Najita, Dey & Brotherton, 2000). Hall et al. (2002) discovered several FeLoBALs reddened by mag. FeLoBALs may be more reddened than LoBALs. Hopkins et al. (2004) also found 2% of quasars are reddened by mag by examining the observed distribution of quasar SEDs including BAL quasars in the SDSS first data release quasar catalog (Schneider et al., 2003).
4.3 Similarity to NGC 4151
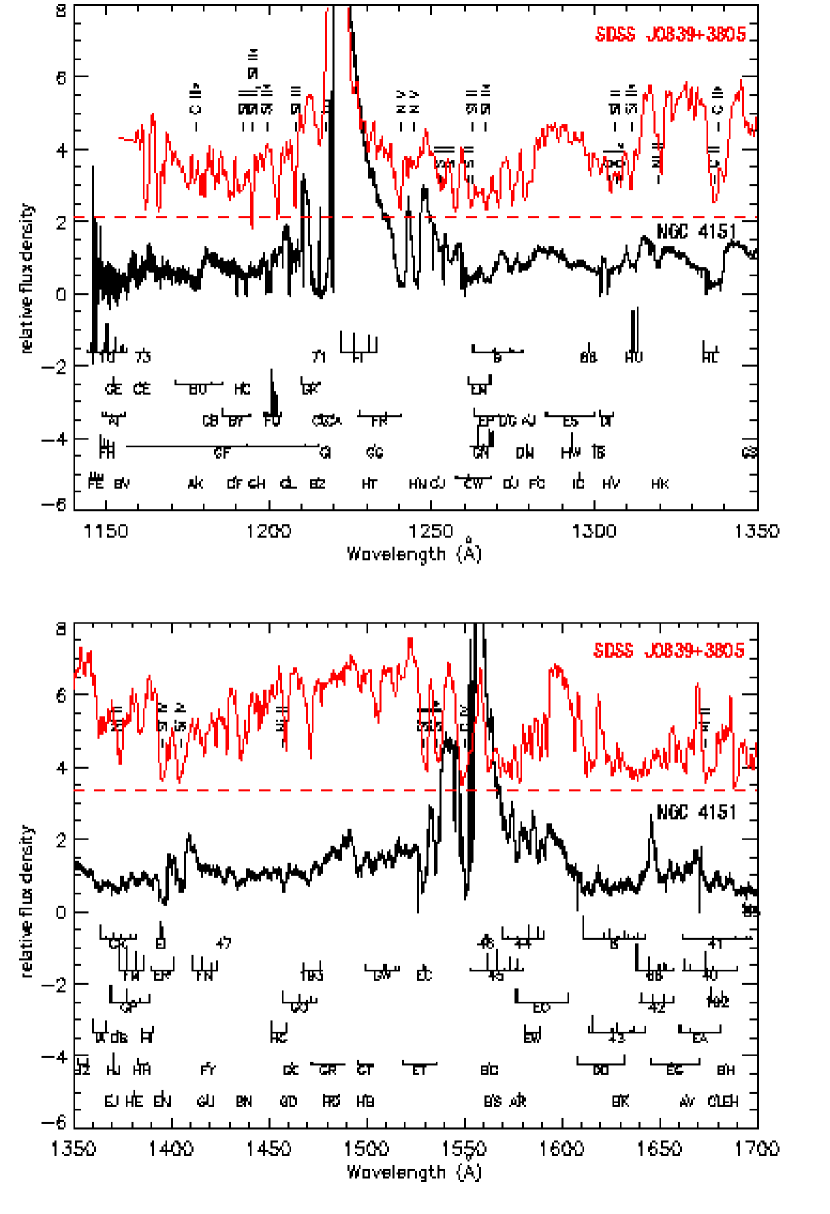
To date, the presence of non-stellar Balmer absorption lines in an active galactic nucleus (AGN) is known only in spectrum of NGC 4151 (Anderson & Kraft, 1969; Sergeev et al., 1999; Hutchings et al., 2002). The EW of H absorption in NGC 4151 was found to be Å (Anderson, 1974; Sergeev et al., 1999), and variable (Anderson, 1974; Hutchings et al., 2002). The kinematical characteristics of Balmer absorption are similar to those of H absorption in SDSS J0839+3805. The velocity blueshift of the H absorption was km s-1 and FWHM were km s-1 in NGC 4151, when the continuum flux of the nucleus was low and the absorption was deep (Hutchings et al., 2002). Interestingly, when the continuum flux of the nucleus was low, there were a large number of Fe II absorption lines that arise from excited fine-structure levels of the ground term and excited terms in the UV spectrum of NGC 4151 (Crenshaw et al., 2000; Kraemer et al., 2001).
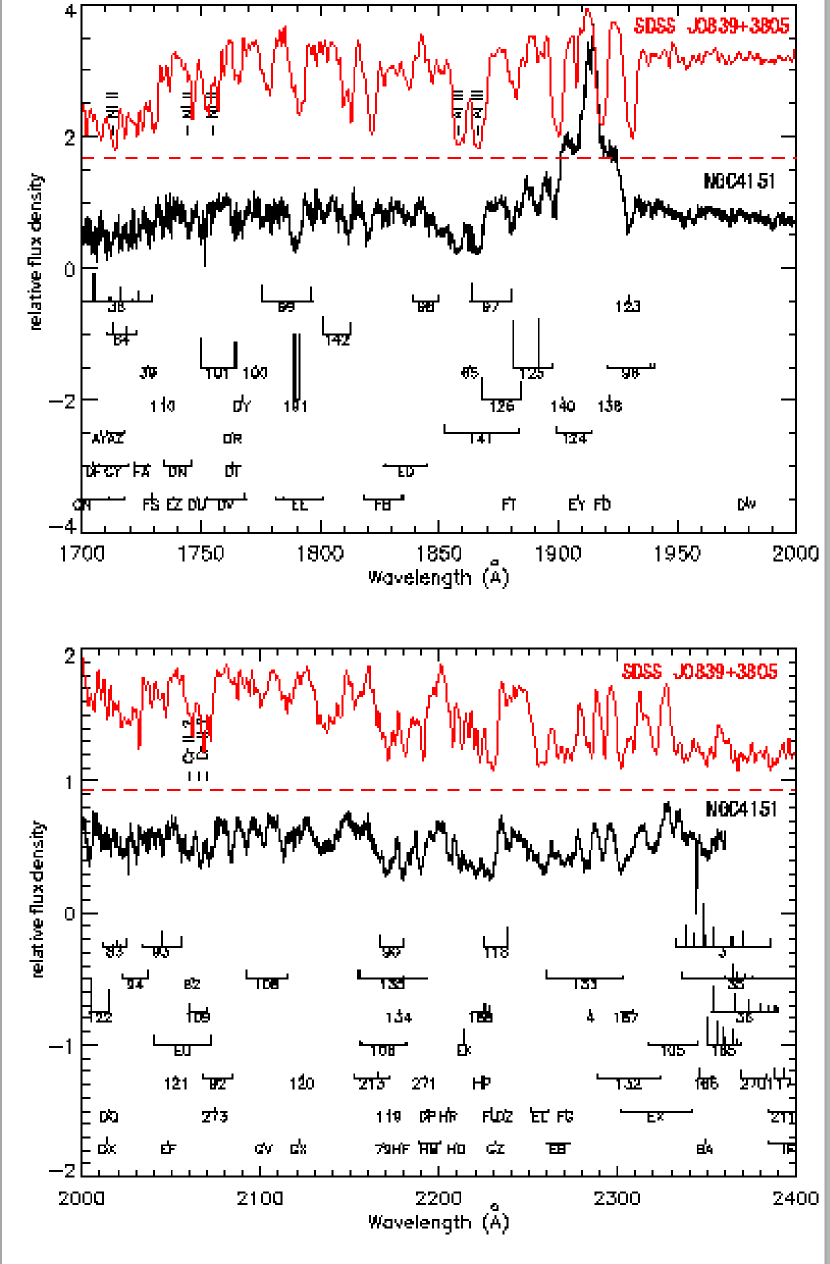
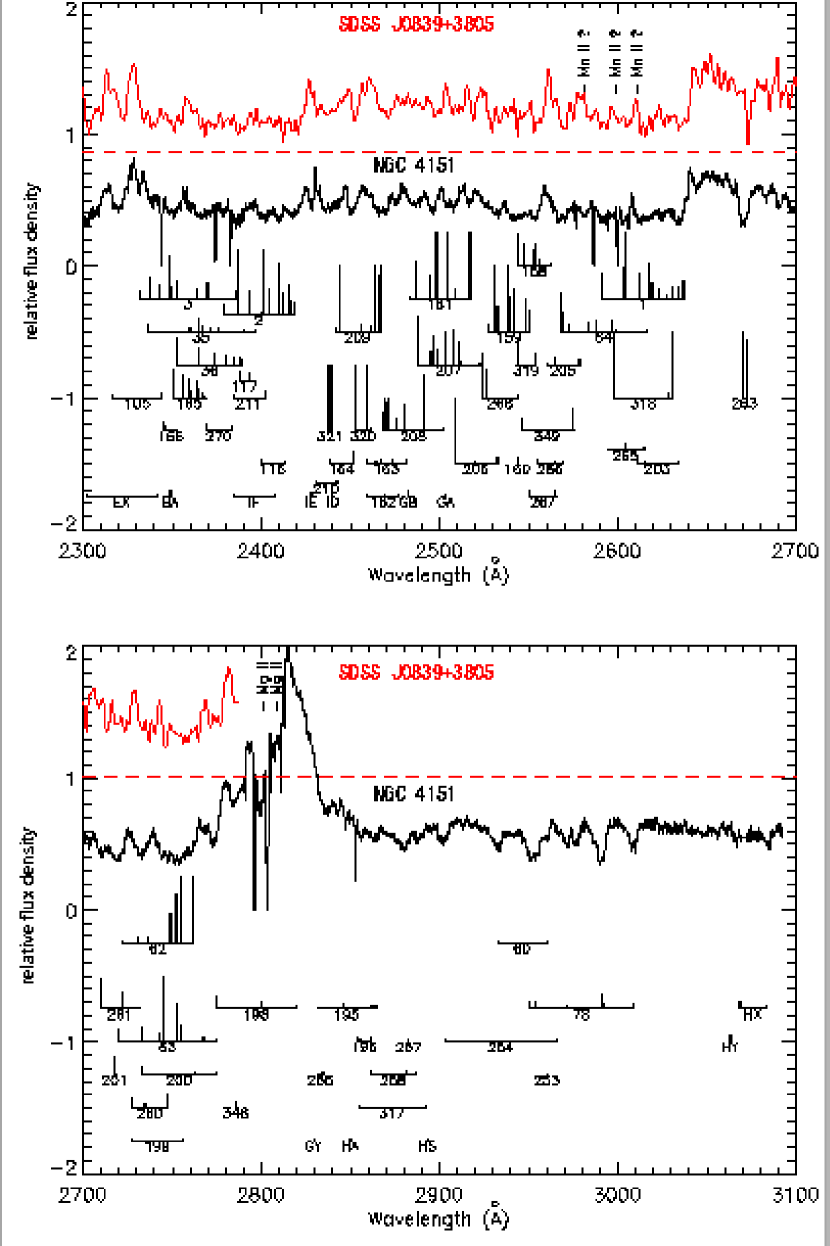
We show the UV spectrum of NGC 4151 in the low state from Kraemer et al. (2001), and compare it to that of SDSS J0839+3805 in Figures 5, 6, and 7. The low-state UV spectrum of NGC 4151 is very similar to that of SDSS J0839+3805, particularly absorption features seen in the wavelength region between 2000 Å and 2700 Å, though the features of the emission lines such as N V, C IV, and C III] are different. The remarkable similarity to the low-state UV spectrum of NGC 4151 implies that the conditions of absorbing gas in SDSS J0839+3805 are similar to those in NGC 4151, though a high-resolution spectrum as well as a detailed modeling of it are required to derive a firm conclusion. We also note that rare He I absorption line is found in both objects (Anderson & Kraft, 1969; Anderson, 1974) although it is a possible detection in SDSS J0839+3805. Only less than 10 previously known AGNs show He I absorption line (Hall et al., 2002).
From the morphology of narrow-line region, NGC 4151 is thought to be looked at the direction close to the edge of the obscuring torus (Evans et al., 1993). SDSS J0839+3805 may be also a quasar seeing from the edge of the torus (Goodrich & Miller, 1995; Cohen et al., 1995; Hines & Wills, 1995; Schmidt & Hines, 1999). As described in §4.2, SDSS J0839+3805 is indeed reddened by mag, although the dust enshrouded quasar model cannot be excluded.
5 CONCLUSION
We discovered an H absorption in the unusual BAL quasar SDSS J0839+3805 with near-infrared spectroscopy. This is the first case for detection of H absorption in quasars. The H absorption in SDSS J0839+3805 is blueshifted by 520 km s-1 relative to H emission line, and its redshift is almost coincident with those of UV low-ionization metal absorption lines. The width of H absorption line is similar to those of the UV low-ionization metal absorption lines ( km s-1). These facts suggest that H and low-ionization metal absorption lines are produced by the same low-ionization gas which has a substantial mount of neutral gas. The column density of the neutral hydrogen is expected to be cm-2 from the analysis of the curve of growth by assuming that the absorbing gas is in thermal equilibrium at a temperature of 10,000 K. SDSS J0839+3805 is found to have mag when the SED is compared to the quasar composite spectrum. The similarity of UV spectrum of SDSS J0839+3805 to that of NGC 4151 in its low state is remarkable. This fact suggests the physical conditions of the absorber in SDSS J0839+3805 are similar to those of NGC 4151 in the low state. As proposed for NGC 4151, SDSS J0839+3805 is also considered to be seen through the close direction of the surface of the obscuring torus.
Observations of H with a much better signal-to-noise-ratio are necessary to measure the EW of H absorption. Observations of the H absorption line with a higher spectral resolution will reveal whether the absorption is a saturated line and whether the absorber fully covers the continuum and the broad emission-line region. These observations will enable us to estimate the column density of neutral hydrogen more accurately . High resolution spectroscopy in the optical domain (i.e., rest UV) will also allow us to estimate the column densities of many ions. The ratios of absorption lines from the excited level to that from the ground level, such as Si II* 444The absorption arising from excited fine-structure levels of the ground term of Si II is denoted as Si II*./Si II , provide direct measurements of the electron density. The ionization degree and density of absorbing gas will help us to locate the absorbing gas and know the geometry of the absorber around the nucleus. There are one dozen H observations of FeLoBALs (Boroson & Meyers, 1992; Egami et al., 1996; Lacy et al., 2002; Najita, Dey & Brotherton, 2000; Brunner et al., 2003, K. Aoki et al., in preparation). To date, no H absorption line has been found except for SDSS J0839+3805. This may be happened due to such variability as found in NGC 4151 (Crenshaw et al., 2000). The physical origin of H absorption is an open question. More spectroscopic data of FeLoBALs in the near-infrared would answer it.
References
- Abazajian et al. (2005) Abazajian, K., et al. 2005, AJ, 129, 1755
- Anderson (1974) Anderson, K. S. 1974, ApJ, 189, 195
- Anderson & Kraft (1969) Anderson, K. S. & Kraft, R. P. 1969, ApJ, 158, 859
- Aoki, Kawaguchi, & Ohta (2005) Aoki, K., Kawaguchi, T., & Ohta, K. 2005, ApJ, 618, 601
- Becker et al. (1997) Becker, R. H., Gregg, M. D., Hook, I. M., McMahon, R. G., White, R. L., & Helfand, D. J. 1997, ApJ, 479, 93L
- Becker et al. (2000) Becker, R. H., White, R. L., Gregg, M. D., Brotherton, M. S., Laurent-Muehleisen, S. A., & Arav, N. 2000, ApJ, 538, 72
- Boroson & Meyers (1992) Boroson, T. A. & Meyers, K. A. 1992, ApJ, 397, 442
- Brotherton et al. (2001) Brotherton, M. S., Tran, H. D., Becker, R. H., Gregg, M. D., Laurent-Muehleisen, S. A., & White, R. L. 2001, ApJ, 546, 775
- Brunner et al. (2003) Brunner, R. J. et al. 2003, AJ, 126, 53
- Canalizo & Stockton (2002) Canalizo, G., & Stockton, A. 2002, in ASP Conf. Ser. 255, Mass Outflow in Active Galactic Nuclei: New Perspectives, ed. D. M. Crenshaw, S. B. Kraemer, & I. M. George (San Francisco: ASP), 195
- Cohen et al. (1995) Cohen, M. H., Ogle, P. M., Tran, H. D., Vermeulen, R. C., Miller, J. S., Goodrich, R. W., & Martel, 1995, ApJ, 448, L77
- Cowie et al. (1994) Cowie, L. L. et al. 1994, ApJ, 432, L83
- Crenshaw et al. (2000) Crenshaw, D. M., Kraemer, S. B., Hutchings, J. B., Danks, A. C., Gull, T. R., Kaiser, M. E., Nelson, C. E., & Weistrop. D. 2000, ApJ, 545, L27
- Egami et al. (1996) Egami, E., Iwamuro, F., Maihara, T., Oya, S., & Cowie, L. L. 1996, AJ, 112, 73
- Evans et al. (1993) Evans, I. N., Tsvetanov, Z., Kriss, G. A., Ford, H. C., Caganoff, S., & Koratkar, A. P. 1993, ApJ, 417, 82
- Goodrich & Miller (1995) Goodrich, R., W., & Miller, J. S. 1995, ApJ, 448, L73
- Hall et al. (2002) Hall, P. B., et al. 2002, ApJS, 141, 267
- Hazard et al. (1987) Hazard, C., McMahon, R. G., Webb, J. K., & Morton, D. C. 1987, ApJ, 323, 263
- Hewett & Foltz (2003) Hewett, P. C. & Foltz, C. B. 2003, AJ, 125, 1784
- Hines & Wills (1995) Hines, D. C. & Wills, B. J. 1995, ApJ, 448, L69
- Hopkins et al. (2004) Hopkins, P. F. et al. 2004, AJ, 128, 1112
- Hutchings et al. (2002) Hutchings, J. B., Crenshaw, D. M., Kraemer, S. B., Gabel, J. R., Kaiser, M. E., Weistrop. D., & Gull, T. R. 2002, AJ, 124, 2543
- Iye et al. (2004) Iye, M., et al. 2004, PASJ, 56, 381
- Kraemer et al. (2001) Kraemer, S. B. et al. 2001, ApJ, 551, 671
- Lacy et al. (2002) Lacy, M., Gregg, M., Becker, R. H., White, R. L., Glikman, E., Helfand, D., & Winn, J. N. 2002, AJ, 123, 2925
- Marziani et al. (2003) Marziani, P., Zamanov, R. K., Sulentic, J. W., & Calvani, M. 2003, MNRAS, 345, 1133
- Motohara et al. (2002) Motohara, K., et al. 2002, PASJ, 54, 315
- Najita, Dey & Brotherton (2000) Najita, J., Dey, A., & Brotherton, M. 2000, AJ, 120, 2859
- Ogle et al. (1999) Ogle, P. M., Cohen, M. H., Miller, J. S., Tran, H. D., Goodrich, R. W., & Martel, A. R. 1999, ApJS, 125, 1
- Pei (1992) Pei, Y. C. 1992, ApJ, 395, 130
- Reichard et al. (2003) Reichard, T. A., et al. 2003, AJ, 126, 2594
- Richards et al. (2003) Richards, G. T. et al. 2003, AJ, 126, 1131
- Sanders et al. (1988) Sanders, D. B., Soifer, B. T., Elias, J. H., Madore, B. F., Matthews, K., Neugebauer, G., & Scoville, N. Z. 1988, ApJ, 325, 74
- Schmidt & Hines (1999) Schmidt, G. D. & Hines, D. C. 1999, ApJ, 512, 125
- Schneider et al. (2002) Schneider, D. P., et al. 2002, AJ, 123, 567
- Schneider et al. (2003) Schneider, D. P., et al. 2003, AJ, 126, 2579
- Schneider et al. (2005) Schneider, D. P., et al. 2005, AJ, 130, 367
- Sergeev et al. (1999) Sergeev, S. G., Pronik, V. I., Sergeeva, E. A., & Malkov, Y. F. 1999, A&A, 341, 740
- Spitzer (1978) Spitzer, L. 1978, in Physical Processes in the Interstellar Medium (New York: Wiley)
- Vanden Berk et al. (2001) Vanden Berk, D. E., et al. 2001, AJ, 122, 549
- Voit, Weymann & Korista (1993) Voit, G. M., Weymann, R. J., & Korista, K. T. 1993, ApJ, 413, 95
- Weymann et al. (1991) Weymann, R. J., Morris, S. L., Foltz, C. B., & Hewett, P. C. 1991, ApJ, 373, 23
- White et al. (2000) White, R. L. et al. 2000, ApJS, 126, 133
- York et al. (2000) York, D. G., et al. 2000, AJ, 120, 1579
- Yuan & Wills (2003) Yuan, M. J., & Wills, B. J. 2003 ApJ, 593, L11
- Zamanov et al. (2002) Zamanov R., Marziani, P., Sulentic, J. W., Calvani, M., Dultzin-Hacyan, D., & Bachev, R. 2002, ApJ, 576, L9


| Band | Magnitude |
|---|---|
| aaMagnitude measured by PSF-fitting photometry in AB system. | |
| aaMagnitude measured by PSF-fitting photometry in AB system. | |
| aaMagnitude measured by PSF-fitting photometry in AB system. | |
| aaMagnitude measured by PSF-fitting photometry in AB system. | |
| aaMagnitude measured by PSF-fitting photometry in AB system. | |
| bbMagnitude in Vega system. | |
| bbMagnitude in Vega system. | |
| bbMagnitude in Vega system. |
| Line | Absorption/Emission | aaVelocity shift relative to the H emission line. Negative value means blueshift. | ||
|---|---|---|---|---|
| (km s-1) | (km s-1) | |||
| H | Emission | |||
| H | Absorption | |||
| H | Emission | bbRedshift and FWHM of the H emission line are probably affected by the absorption. | bbRedshift and FWHM of the H emission line are probably affected by the absorption. | bbRedshift and FWHM of the H emission line are probably affected by the absorption. |
| [O III] 5008 | Emission | |||
| He I 3890 | Absorption | |||
| Ly | Emission |
| Line | aaVelocity shift relative to the H emission line (). Negative value means blueshift. | ||
|---|---|---|---|
| (km s-1) | (km s-1) | ||
| Si II 1527 | 2.3100 | 720 | 810 |
| Si II 1533 | 2.3110 | 620 | 880 |
| Al III 1855 | 2.3101 | 710 | 890 |
| Al III 1863 | 2.3101 | 710 | 970 |
| Fe III 1914 | 2.3109 | 630 | 730 |
| Zn II 2026 | 2.3124 | 500 | 360 |