Time lag between prompt optical emission and -rays in GRBs
Abstract
Aims. The prompt optical emission contemporaneous with the -rays from -ray bursts (GRBs) carries important information on the central engine and explosion mechanism. We study the time lag between prompt optical emission and -rays in GRB 990123 and GRB 041219a, which are the only two GRBs had been detected at optical wavelengths during the ascending burst phase.
Methods. Assuming profiles of prompt optical light curves are the same as the prompt -rays, we simulate optical light curves with different time lags and compare them with the observed optical flux. Then the best fit time lag and its error are determined by chi-squared values.
Results. We find that time lags between prompt optical emission and -rays in GRB host galaxy rest-frames are consistent in the two GRBs, which is s for GRB 990123 and s for GRB 041219a. This result is consistent with a common origin of prompt optical and -ray emissions in the two GRBs. Based on synchrotron cooling model, we also derive the parameters for the two GRBs.
Key Words.:
gamma rays: bursts – methods: data analysis1 Introduction
The prompt optical emission contemporaneous with the -rays from -ray bursts (GRBs) carries crucial information on the central engine and explosion mechanism. Internal shock models and external shock models have been proposed to explain the prompt optical emission (see e.g. Meszaros & Rees 1999; Liang et al. 1999). However, the origin of the prompt optical emission remains an open issue.
Prompt optical emission have been found for several GRBs during the brief durations of bursts (e.g. Akerlof et al. 1999; Vestrand et al. 2005; Rykoff et al. 2005; Klotz et al. 2006). For two of them, i.e. GRB 990123 (Akerlof et al. 1999; Kippen et al. 1999) and GRB 041219a (Vestrand et al. 2005; Barthelmy, S., et al. 2004), early-time optical observations were carried out during their bursting phase, including both ascending and descending parts. Hence, it is possible to study the time lag between prompt optical emission and -rays in these two GRBs, which could provide important clues to the origin of prompt optical emission.
2 Data Analysis
As shown in Figure 1, in each GRB, there are only three points with a positive optical detection (crosses) during the burst phase and the profile of optical light curve remains unknown. To avoid redundant parameters, we simply assume that the prompt optical light curve profile is exactly the same as the -rays, but with a time lag to be determined. Then we simulate optical light curves with different time lags and compare them with the observed optical flux. The redshift of GRB 990123 is 1.6 (Andersen et al. 1999; Kulkarni et al. 1999). The redshift of GRB 041219a is unknown. Barkov Bisnovatyi-Kogan (2005) gave a redshift upper limit as based on a model of a dust reradiation of IR afterglow in the envelope surrounding the GRB source. In this note, we assume for GRB 041219a.
We consider the following four models for time lag between optical and gamma-ray emissions:
-
1.
No time lag between optical and gamma-ray emissions in GRB 041219a;
-
2.
No time lag between optical and gamma-ray emissions in both GRB 990123 and GRB 041219a;
-
3.
Time lags between optical and gamma-ray emissions in GRB 990123 and GRB 041219a are independent.
-
4.
Time lags between optical and gamma-ray emissions in GRB 990123 and GRB 041219a are the same in their host galaxy rest-frames;
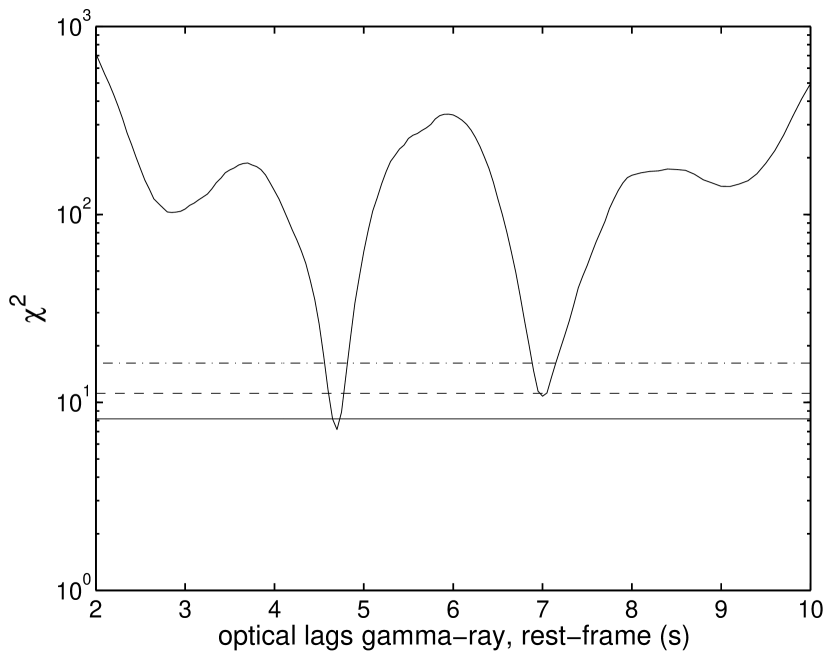
Results of tests for the four models are given in Table 1. For model 3, values of different time lags are shown in Figure 2, and simulated light curves with corresponding lags of minimum values are shown in Figure 1. values of different time lags for model 4 are shown in Figure 3.
As shown in Table 1, model 2 is rejected. Model 4 and 3 are better than model 1, indicating that a common time lag between prompt optical emission and -rays in both GRBs is quite possible. In model 3 (Figure 2), for GRB 990123, the best-fitting time lag is 12.2 s, and there is another local minimum of values around 18.2 s. The 12 s lag corresponds to moving the second pulse to the second optical point, while 18 s corresponds to moving the first pulse to the second optical point. Therefore the host galaxy rest-frame time lag should be s. For GRB 041219a, the best-fitting time lag is s with error, and the host galaxy rest-frame time lag will be s. The value is very sensitive to the time lag in GRB 990123, thus in model 4 (Figure 3), the best-fitting lag value is dominated by the contribution of GRB 990123.
3 Discussion and Conclusions
It was reported in some previous studies that the behaviors and origins of the prompt optical emission in GRB 990123 and GRB 041219a are totally different: In GRB 990123, the optical emission was uncorrelated with the prompt gamma-rays, suggesting that the optical emission was generated by a reverse external shock arising from the ejecta’s collision with surrounding material; while in GRB 041219a, the optical emission was correlated with the prompt gamma-rays, indicating optical emission was generated by internal shocks driven into the burst ejecta by variations of the inner engine (Vestrand et al. 2005). However, our results show that time correlation between prompt optical and gamma-ray emission are quite consistent in both GRBs. If GRB 041219a is a low-redshift object, rest-frame time lags of prompt optical emission behind -rays in the two GRBs is similar, indicating a common mechanism to produce the prompt optical emission in the two GRBs.
If both prompt optical and -ray emissions come from cooling pairs in the moving ejecta with a Lorentz factor through synchrotron radiation, assuming velocities of are isotropic, the frequency of emitted photon is around the peak frequency of synchrotron photons, which in the observer’s frame is
| (1) |
where is the Lorentz factor of and is the magnetic field strength in Gauss.
The power radiated per one electron or positron in the observation frame is
| (2) |
The time lag between prompt optical emission and -rays should be the typical lifetime of which emit optical photons
| (3) |
Assuming , which is a typical value in GRBs (see e.g. Liang et al. 1999), we can derive , and the total number based on synchrotron cooling, as listed in Table 2. Further assuming an emission radius cm (see e.g. Liang et al. 1999; Li et al. 2003), we can derive the synchrotron self-absorption frequency (Li et al. 2004) and the column density in the observer’s frame
| (4) |
and
| (5) |
As shown in Table 2, the self-absorption frequencies are less than the observed frequencies, thus prompt emissions can be observed. When absorption is negligible, the optical to -ray flux ratio from synchrotron cooling with constant and should be . This is consistent with the observed value of GRB 041219a, which is when there is zero lag between prompt optical emission and -rays (Vestrand et al. 2005) and about for our best-fitting model. However, in GRB 990123, the peak optical/peak -ray flux ratio is (Kulkarni et al. 1999; Akerlof et al. 1999) and the flux ratio changes to be for our best-fitting model when the time lag is 12.2 s, which is one magnitude larger than the synchrotron-cooling model predicted value, indicating that such a simplified non-absorption synchrotron cooling model alone could not account for all the observed properties of GRB 990123. It is possible that another mechanism may be operating simultaneously which can modify the flux ratio. For example, down-Comptonization of gamma-ray photons in intervening electron clouds may be able to reduce the flux ratio substantially if some gamma-ray photons are converted into optical photons which are also delayed by several seconds with respect to the gamma-ray emission, as proposed independently by Zheng et al. (2006). In this model, different covering factors of high density region around the central engine could lead to different optical to gamma-ray flux ratios.
| model 111Refer to text for details. | 222The probability that a single observation from a distribution with degrees of freedom will be larger than the values in column (2). | Lag99 333Time lag for GRB 990123. (s) | Lag04 444Time lag for GRB 041219a. (s) | ||
|---|---|---|---|---|---|
| 1 | 7.22 | 4 | 0.12 | – | 0 |
| 2 | 5150 | 6 | 0 | 0 | |
| 3 | 6.36 | 4 | 0.17 | 12.2 | 3.0 |
| 4 | 7.17 | 5 | 0.21 | 12.2 | 5.2 |
| Parameter | GRB 990123 | GRB 041219a | Ref. 555References: 1. Andersen et al. 1999; 2. Kulkarni et al. 1999; 3. Barkov & Bisnovatyi-Kogan 2005; 4. Barthelmy et al. 2004; 5. Akerlof et al. 1999; 6. Vestrand et al. 2004; 7. Liang et al. 1999; 8. Li et al. 2003; 9. Li et al. 2004. |
|---|---|---|---|
| Obervation | |||
| Redshift | 1.6 | 0.1 | 1, 2, 3 |
| Time lag (s) | 12.2 | 3.0 | |
| (erg/s) | 2, 4 | ||
| (erg/s) | 5, 6 | ||
| (Hz) | |||
| (Hz) | |||
| Assumption | |||
| Bulk Lorentz factor | 300 | 300 | 7 |
| Radius (cm) | 7, 8 | ||
| Derived parameters | |||
| B (Gs) | 28 | 53 | |
| 310 | 140 | ||
| 666Calculated from . | |||
| (Hz) | 9 | ||
| (Hz) | 9 | ||
| (cm-2) |


Acknowledgements.
We thank the anonymous referee for helpful comments that improved the manuscript. SNZ acknowledges partial funding support by the Ministry of Education of China, Directional Research Project of the Chinese Academy of Sciences and by the National Natural Science Foundation of China under project no. 10233010 and 10521001.References
- (1) Akerlof, C., et al. 1999, Nature, 398, 400
- (2) Andersen, M. I., et al. 1999, Science, 283, 2075
- (3) Barthelmy, S., et al. 2004, GCN Circ. 2874 (http://gcn.gsfc.nasa.gov/gcn/gcn3/2874.gcn3)
- (4) Barkov, M. V., & Bisnovatyi-Kogan, G. S. 2005, Astrophysics, 48, 369
- (5) Kippen, R. M., et al. 1999, GCN Circ. 224 (http://gcn.gsfc.nasa.gov/gcn/gcn3/224.gcn3)
- (6) Klotz, A., et al. 2006, preprint (astro-ph/0604061)
- (7) Kulkarni, S. R., et al. 1999, Nature, 398, 389
- (8) Li, Z., Dai, Z. G., Lu, T., & Song, L. M. 2003, ApJ 599, 380
- (9) Li, Z., & Song, L. M. 2004, ApJ 608, L17
- (10) Liang, E. P., Crider, A., Bttcher, M., & Smith, I. A. 1999, ApJ 519, L21
- (11) Meszaros, P., & Rees, M. 1999, MNRAS 306, L39
- (12) Rykoff, E. S., et al. 2005, ApJ, 631, L21
- (13) Vestrand, W. T., et al. 2005, Nature, 435, 178
- (14) Zheng, Z., Lu, Y., & Zhao, Y. H. 2006, accepted for publication in ApJ (astro-ph/0606312)