Chemical abundances for the transiting planet host stars OGLE-TR-10, 56, 111, 113, 132 and TrES-1††thanks: Based on observations collected at the ESO 8.2-m VLT-UT2 Kueyen telescope (programs 075.C-0185 and 076.C-0131).
Abstract
Aims. We used the UVES spectrograph (VLT-UT2 telescope) to obtain high-resolution spectra of 6 stars hosting transiting planets, namely for OGLE-TR-10, 56, 111, 113, 132 and TrES-1. The spectra are now used to derive and discuss the chemical abundances for C, O, Na, Mg, Al, Si, S, Ca, Sc, Ti, V, Cr, Mn, Co, Ni, Cu and Zn.
Methods. Abundances were derived in LTE, using 1-D plane-parallel Kurucz model atmospheres. For S, Zn and Cu we used a spectral synthesis procedure, while for the remaining cases the abundances were derived from measurements of line-equivalent widths.
Results. The resulting abundances are compared with those found for stars in the solar neighborhood. Distances and galactic coordinates are estimated for the stars. We conclude that besides being particularly metal-rich, with small possible exceptions OGLE-TR-10, 56, 111, 113, 132 and TrES-1 are chemically undistinguishable from the field (thin disk) stars regarding their [X/Fe] abundances. This is particularly relevant for the most distant of the targets, located at up to 2 Kpc from the Sun. We also did not find any correlation between the abundances and the condensation temperature of the elements, an evidence that strong accretion of planetary-like material, tentatively connected to planetary migration, did not occur.
Key Words.:
Stars: abundances – Stars: fundamental parameters – planetary systems – Galaxy: abundances – solar neighbourhood1 Introduction
The discovery of several short period transiting giant extra-solar planets is giving astronomers the possibility to measure physical variables like the planetary radius, mass and mean density. In all, 10 transiting cases have been discovered. While some of them are the outcome of the radial-velocity surveys (Charbonneau et al. 2000; Henry et al. 2000; Sato et al. 2005; Bouchy et al. 2005b), a few others were discovered in the context of photometric transit searches (Konacki et al. 2003; Bouchy et al. 2004; Pont et al. 2004; Alonso et al. 2004; Bouchy et al. 2005a; Konacki et al. 2005; McCullough et al. 2006).
The most prolific search for planetary transits has been carried out by the OGLE team (e.g. Udalski et al. 2002). After follow-up radial-velocity obervations, 5 of the more than 170 initial candidates were confirmed as real planetary transits. Unfortunately, all the OGLE transiting planets orbit faint (V16) distant stars (500 pc), making it difficult the task of deriving accurate stellar parameters and chemical abundances.
Recently we have obtained high-resolution and high signal-to-noise spectra of the 5 confirmed OGLE planet host stars using the UVES spectrograph at the 8.2-m VLT/Kueyen telescope (ESO, Chile). These spectra were used to derive accurate stellar parameters for the stars, which were then used to improve the estimates of the planetary radii and mean-densities. The results for OGLE-TR-10, 56, 111 and 113, as well as for the brighter TrES-1, were published in Santos et al. (2006). For OGLE-TR-132 the analysis was presented in Pont et al. (2006, in prep.). In a separate paper (Melo et al. 2006) we have further discussed the ages of these stars, showing that they are older than 0.5-2 Gyr. This conclusion has a strong impact on the evaporation rates of hot and very-hot-jupiters. Finally, in Guillot et al. (2006) we have shown that a correlation between the stellar metallicity and the planetary internal structure seems to exist. If real, this result will have a strong impact on the models of planet formation.
In the current paper we present the abundances for several chemical elements in the 6 stars mentioned above (OGLE-TR-10, 56, 111, 113, 132 and TrES-1). Using the derived stellar parameters and observed magnitudes, together with an estimate for the magnitude extinction, we then derive the distances to the targets and their galactic coordinates. The results are then discussed and the abundances compared with those found for solar-neighborhood disk dwarfs. Finally, we compare the abundances of volatile and refractory elements in the 6 stars to look for possible evidence for accretion of planetary material.
2 Observations
The observations were carried out with the UVES spectrograph at the VLT-UT2 Kueyen telescope. For TrES-1, OGLE-TR-10, 56, 111, and 113, the data were obtained between April and May 2005 in service mode (program ID 075.C-0185). More details are presented in Santos et al. (2006).
| Star | T [K] | (c.g.s.) | [km s-1] | [Fe/H] | N(Fe i, Fe ii) | (Fe i,Fe ii) | Source |
|---|---|---|---|---|---|---|---|
| OGLE-TR-10 | 607586 | 4.540.15 | 1.450.14 | 0.280.10 | 33,11 | 0.08,0.06 | Santos et al. (2006) |
| OGLE-TR-56 | 611962 | 4.210.19 | 1.480.11 | 0.250.08 | 31,9 | 0.06,0.08 | Santos et al. (2006) |
| OGLE-TR-111 | 504483 | 4.510.36 | 1.140.10 | 0.190.07 | 31,7 | 0.07,0.18 | Santos et al. (2006) |
| OGLE-TR-113 | 4804106 | 4.520.26 | 0.900.18 | 0.150.10 | 30,5 | 0.10,0.09 | Santos et al. (2006) |
| OGLE-TR-132 | 621059 | 4.510.27 | 1.230.09 | 0.370.07 | 30,8 | 0.05,0.10 | Pont et al. (2006, in prep.) |
| TrES-1 | 522638 | 4.400.10 | 0.900.05 | 0.060.05 | 36,7 | 0.04,0.05 | Santos et al. (2006) |
| Si i | ||
| 5665.56 | 4.92 | -2.0000 |
| 5690.43 | 4.93 | -1.8239 |
| 5701.10 | 4.93 | -2.0372 |
| … | … | … |
For OGLE-TR-132 we have obtained 8 exposures of 3000 seconds each (program ID 076.C-0131). The observations were done in December 2005 and January 2006. Each individual spectrum was then combined using the IRAF111IRAF is distributed by National Optical Astronomy Observatories, operated by the Association of Universities for Research in Astronomy, Inc.,under contract with the National Science Foundation, U.S.A. scombine routine. The total S/N obtained is close to 100, as measured directly from small spectral windows with no clear spectral lines in the region near 6500Å. As for the other faint OGLE stars, for each exposure on OGLE-TR-132 the CCD was read in 2x2 bins to reduce the readout noise and increase the number of counts in each bin. This procedure does not compromise the resolving power, since the sampling of the CCD is still higher (by a factor of 2) than the instrumental PSF. Similarly we opted for using a slit width of 0.9 arcsec, which provides a spectral resolution R=/50 000. The observations were made using the Dichroic 390+580 mode. The red portion of the spectra (used in the current paper) cover the wavelength domain between 4780 and 6805Å, with a gap between 5730 and 5835Å.
As before, particular attention was paid to the orientation of the slit due to the relative crowdedness of the field. The angle was chosen using the images available at the OGLE website222http://www.astrouw.edu.pl/ftp/ogle/index.html, so that no other star was present in the UVES slit during the observation.
3 Stellar parameters and iron abundances
Stellar parameters and iron abundances for our targets were taken from Santos et al. (2006) for TrES-1, OGLE-TR-10, 56, 111 and 113, and from Pont et al. (2006, in prep.) for OGLE-TR-132. These were derived in LTE using the 2002 version of the code MOOG (Sneden 1973)333http://verdi.as.utexas.edu/moog.html and a grid of Kurucz Atlas plane-parallel model atmospheres (Kurucz 1993). The whole procedure is described in Santos et al. (2004, and references therein), and is based on the analysis of 39 Fe i and 12 Fe ii weak lines, and imposing excitation and ionization equilibrium.
Details about the analysis of the 6 stars in our sample are presented in Santos et al. (2006) and Pont et al. (2006, in prep.). The stellar parameters used in the current paper are summarized in Table 1.
It is useful to mention that the stellar parameters used for the OGLE stars and TrES-1 were derived using the same methodology as the ones used by Bodaghee et al. (2003), Gilli et al. (2006), and Beirão et al. (2005) in their analysis of the same elements in the field star samples mentioned below. This gives us a guarantee of uniformity in the comparison presented in Sect. 6.
4 Abundances for other elements
The analysis was done in LTE using a grid of Kurucz (1993) ATLAS-9 model atmospheres, and the 2002 version of the code MOOG (Sneden 1973).
The abundances for Na, Mg, Al, Si, Ca, Sc, Ti, V, Cr, Mn, Co, and Ni were derived from the analysis of line-equivalent widths (EW), measured by Gaussian fitting using the splot routine in IRAF. To derive the abundances we have followed the procedure described in Beirão et al. (2005) for the first three elements of this series, and in Bodaghee et al. (2003) and Gilli et al. (2006) for the remaining cases.
| Star | [Si/H] | n(Si) | [Ca/H] | n(Ca) | [TiI/H] | n(TiI) | [TiII/H] | n(TiII) | [Sc/H] | n(Sc) |
|---|---|---|---|---|---|---|---|---|---|---|
| OGLE-TR-10 | 0.320.04 | 8 | 0.300.04 | 10 | 0.310.05 | 9 | 0.310.09 | 4 | 0.330.10 | 4 |
| OGLE-TR-56 | 0.280.05 | 9 | 0.260.08 | 11 | 0.220.04 | 6 | 0.290.05 | 4 | 0.350.05 | 6 |
| OGLE-TR-111 | 0.100.04 | 5 | 0.210.08 | 9 | 0.350.07 | 10 | 0.150.10 | 4 | 0.110.13 | 2 |
| OGLE-TR-113 | 0.160.12 | 7 | 0.000.07 | 8 | 0.290.09 | 13 | 0.200.17 | 4 | 0.140.12 | 4 |
| OGLE-TR-132 | 0.360.03 | 8 | 0.310.04 | 12 | 0.350.07 | 6 | 0.360.10 | 4 | 0.490.03 | 7 |
| TrES-1 | 0.060.04 | 9 | 0.050.07 | 12 | 0.110.06 | 13 | 0.000.01 | 4 | 0.020.06 | 5 |
| Star | [Mn/H] | n(Mn) | [V/H] | n(V) | [CrI/H] | n(CrI) | [CrII/H] | n(CrII) | [Co/H] | n(Co) |
|---|---|---|---|---|---|---|---|---|---|---|
| OGLE-TR-10 | 0.310.08 | 3 | 0.310.07 | 3 | 0.380.25 | 2 | 0.320.01 | 2 | 0.390.00 | 1 |
| OGLE-TR-56 | 0.330.16 | 3 | 0.230.07 | 4 | 0.320.00 | 1 | 0.250.18 | 2 | 0.250.11 | 4 |
| OGLE-TR-111 | 0.370.13 | 3 | 0.690.14 | 8 | 0.210.09 | 4 | 0.020.00 | 1 | 0.300.10 | 8 |
| OGLE-TR-113 | 0.290.08 | 2 | 0.560.16 | 9 | 0.100.08 | 4 | 0.190.00 | 1 | 0.300.15 | 7 |
| OGLE-TR-132 | 0.370.12 | 3 | 0.320.18 | 4 | 0.250.03 | 2 | 0.300.10 | 3 | 0.340.09 | 6 |
| TrES-1 | 0.140.01 | 3 | 0.210.07 | 8 | 0.040.02 | 4 | 0.000.00 | 1 | 0.060.09 | 7 |
| Star | [Ni/H] | n(Ni) | [Na/H] | n(Na) | [Mg/H] | n(Mg) | [Al/H] | n(Al) |
|---|---|---|---|---|---|---|---|---|
| OGLE-TR-10 | 0.220.08 | 21 | 0.240.11 | 3 | 0.230.14 | 3 | 0.290.00 | 1 |
| OGLE-TR-56 | 0.270.06 | 23 | 0.380.09 | 3 | 0.220.17 | 3 | 0.300.01 | 2 |
| OGLE-TR-111 | 0.220.10 | 22 | 0.210.17 | 3 | 0.230.12 | 3 | 0.280.15 | 2 |
| OGLE-TR-113 | 0.170.10 | 20 | 0.060.17 | 3 | 0.220.18 | 3 | 0.220.02 | 2 |
| OGLE-TR-132 | 0.360.10 | 22 | 0.310.02 | 3 | 0.260.10 | 2 | 0.400.03 | 2 |
| TrES-1 | 0.060.04 | 26 | 0.050.06 | 3 | 0.050.08 | 3 | 0.100.01 | 2 |
| Star | [C/H] | [O/H] | [S/H] | [Zn/H] | [Cu/H] |
|---|---|---|---|---|---|
| OGLE-TR-10 | 0.290.09 | 0.310.20 | 0.130.12 | 0.470.11 | 0.270.10 |
| OGLE-TR-56 | 0.240.14 | 0.350.26 | 0.200.09 | 0.090.09 | 0.230.08 |
| OGLE-TR-111 | 0.430.21 | 0.210.38 | 0.64 | 0.130.11 | 0.470.10 |
| OGLE-TR-113 | 0.810.21 | - | 0.70 | 0.340.11 | 0.530.11 |
| OGLE-TR-132 | 0.270.10 | - | 0.420.11 | 0.210.09 | 0.300.09 |
| TrES-1 | 0.060.07 | 0.110.17 | 0.26 | 0.050.06 | 0.040.08 |
For the 12 elements listed above, we used the abfind driver in MOOG to find the abundances for each measured line giving as input the model atmosphere interpolated to the correct stellar parameters listed in Table 1, the measured EW, and the atomic parameters provided in Table 2. The line-list used is an upgraded version of the one used in Gilli et al. (2006), where we added a few more lines (except for Na, Mg and Al). Semi-empirical values were derived, as before, using equivalent widths obtained in the High Resolution Solar Atlas (Kurucz et al. 1984) and a solar model atmosphere with Teff5777 K, 4.44 dex, and 1.00 km s-1. The solar abundances were taken from Anders & Grevesse (1989), except for iron, where the value of 7.47 was considered, as in all our previous studies. In our analysis of Na, Mg, Al, Si, Ca, Sc, Ti, V, Cr, Mn, Co, and Ni we used the damping option “2” in MOOG.
For Cr and Ti we used both neutral (Cr i and Ti i) and ionized (Cr ii and Ti ii) lines. For the rest of the comparison we will use the abundances derived using the neutral lines, since the studies about the field stars were based only on the neutral species. A look at Tables 3 and 4 shows that the two sets of lines yield generally similar results, within the errors.
Oxygen (O) abundances were derived from the forbiden [OI] line near 6300.3 AA. We followed the analysis procedure described in detail in Ecuvillon et al. (2006b). Given that in metal-rich stars the [OI] line is blended with a small nickel line (e.g. Allende Prieto et al. 2001), in our analysis we have computed the expected EW for this latter line, and subtracted if from the whole EW of the feature at 6300.3 Å. For OGLE-TR-113 and OGLE-TR-132, the quality of the spectra in the [OI] line region did not permit us to derive a quality value for the oxygen abundance. As in Ecuvillon et al. (2006b), we adopted a solar abundance of 8.56. As for C, S, Zn and Cu (below), in this case we adopted the damping option “0” in MOOG (Unsold approximation).


For the abundances of carbon (C), sulphur (S), zinc (Zn) and copper (Cu) we followed the prescription of Ecuvillon et al. (2004). Carbon abundances were derived using an EW analysis of two C i lines at 5380.3 and 5052.2 Å. Sulphur, zinc and copper abundances were all obtained by spectral fitting to the data, using the synth driver in MOOG. For S we have used two S i features near 6743.5 and 6757.1 Å. Zinc abundances were obtained from the Zn i line at 4810.5 Å, since the shorter wavelenth line at 4722.2 Å used by Ecuvillon et al. (2004) is not present in our spectra. Finally, Cu abundances were derived from the analysis of the Cu i 5218.2 Å line, since the feature at 5782.1 Å falls in the spectral gap of the UVES spectra. In the spectral synthesis, we considered a gaussian broadening to take into account the instrumental profile. When available from the literature (Alonso et al. 2004; Pont et al. 2004; Bouchy et al. 2004, 2005a), the projected rotational velocity was also considered. When only an upper limit for the was available, we made use of other lines in the same spectral region to optimize the broadening function, following the same procedure used in Ecuvillon et al. (2004).
We refer to Ecuvillon et al. (2004) and Ecuvillon et al. (2006b) for the line-lists used and for more detail on the the derivation of the abundances of O, C, S, Zn and Cu. An example of the spectral synthesis for the derivation of S, Zn and Cu abundances in presented in Figs. 1, 2 and 3, respectively.
| Star | I | Rstar | d0 | d | X | Y | Z | Rg | Av | RV | ||
|---|---|---|---|---|---|---|---|---|---|---|---|---|
| [mag.] | [R⊙] | [o] | [o] | [pc] | [pc] | [pc] | [pc] | [pc] | [pc] | [mag.] | [km s-1] | |
| OGLE-TR-10 | 14.9 | 1.14 | 359.8516 | -1.5767 | 1830 | 1326 | -3 | 7174 | -36 | 7175 | 1.16 | 6.2a |
| OGLE-TR-56 | 15.3 | 1.15 | 0.7053 | -2.3655 | 2246 | 1591 | 20 | 6911 | -66 | 6911 | 1.25 | 48.3a |
| OGLE-TR-111 | 15.5 | 0.83 | 289.2794 | -1.7056 | 1236 | 1011 | -954 | 8166 | -30 | 8222 | 0.72 | 25.1b |
| OGLE-TR-113 | 14.4 | 0.765 | 289.2017 | -1.7895 | 614 | 553 | -522 | 8318 | -17 | 8335 | 0.42 | 7.9c |
| OGLE-TR-132 | 15.7 | 1.28 | 289.2349 | -2.3430 | 3081 | 2180 | -2057 | 7782 | -89 | 8050 | 1.25 | 39.7c |
| TrES-1 | 10.73 | 0.83 | 67.4649 | 13.4403 | 148 | 143 | 129 | 8447 | 33 | 8448 | 0.11 | 20.7d |
The final derived abundances are listed in Tables 3, 4, 5, and 6. In the first three, the uncertainties represent the rms around the average abundance for the cases where more than one line of the same element could be measured. For C, O, S, Zn, and Cu the final errors were computed adding in quadrature the errors due to the uncertainties in atmospheric parameters following the sensitivities listed in Ecuvillon et al. (2004) and Ecuvillon et al. (2006b), together with the uncertainty in the abundance synthesis or analysis. For this latter, the rms was used when more than one line was measured. Else, the uncertainty in the measured EW was considered. For S, Zn, and Cu the uncertainty in the synthesis procedure was taken into account.
4.1 Comparison with the literature
The chemical abundances for the faint OGLE stars have not been studied elsewhere in the literature. However, for the brighter TrES-1, Sozzetti et al. (2006) have derived chemical abundances for a series of elements, most of which are also studied in the current paper.
In general, the abundances derived by Sozzetti et al. (2006) for TrES-1 are in agreement with the ones presented here. However, we do see a systematic difference between the two studies. On average, our values are slighly above (by 0.08 dex, with a dispersion around the average value of 0.08) the ones derived by the study of Sozzetti et al. This small systematic difference can be due to the use of slighly different atmospheric parameters and line-lists.
5 Distances and galactic positions
We used the available information regarding the 6 stars in our sample to derive their distances and galactic positions.
Since most of the targets (all the OGLE stars) have only I magnitudes available, we decided to work in this band, and derived the I magnitude of TrES-1 by inverting the Teff:(V-I) calibration of Alonso et al. (1996). For this we considered V=11.79 and made use of the effective temperature listed in Table 1.
Using the effective temperatures listed in the Table and the best available stellar radii estimates (Pont et al. 2006, in prep.; Bouchy et al. 2004; Laughlin et al. 2005; Santos et al. 2006) we derived the stellar luminosities. We then used the Mbol:L relation presented in Lang (1999) to obtain the bolometric magnitude of each star. From Mbol, the absolute magnitudes (MI) were derived using the Bolometric Correction for the I band (BCI) taken from Bessell et al. (1998). Finally, with MI and the apparent I magnitude, and neglecting the interstellar absorption, we could derive a first guess for the stellar distances (d0).
Once a first value was available, we used a fortran version of the IDL code EXTIN.PRO (Amôres & Lépine 2005)444The code was kindly provided by the authors. The IDL version is available at http://www.astro.iag.usp.br/jacques/programs.html and the relation AI/AV0.601 (Schlegel et al. 1998)555Similar results are derived from the tables of Grebel & Roberts (1995). to obtain a value for AV and AI. This latter was then used to obtain a new value for the stellar distance. All this procedure was done iteractively, until the distances remained unchanged. The final values, as well as the first guess (considering null extinction), are presented in Table 7. The null-extinction value for TrES-1 is very close to the one derived in previous works (Alonso et al. 2004; Laughlin et al. 2005). For this star, using the observed V magnitude, the bolometric correction from Flower (1996), and considering zero reddening, a distance of 158 pc is derived.
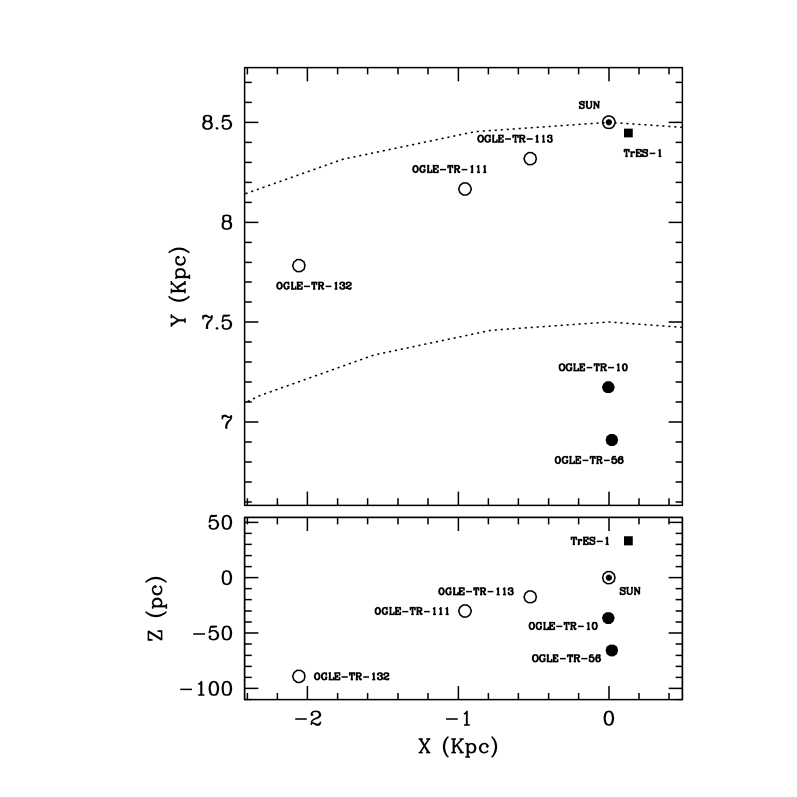
Having the distance to the stars, and the l, b galactic coordinates666Derived using the epoch 2000.0 right-ascention and declinations, and making use of the the galactic routine within the IRAF “astutils” package. we obtained the X, Y and Z galactic positions for the 6 stars (Fig. 4, Table 7). As we can see from the figure, the OGLE stars in the different fields (Carina at degrees and Bulge at degrees) are all at very different distances from the Sun. Althought the Carina-field stars (OGLE-TR-111, 113 and 132) have all a similar galactocentric radius as the Sun, the same is not true for the Bulge-field stars (OGLE-TR-10 and 56). Here we consider that the Sun is at Rg=8.5 Kpc.
We should add that errors in the stellar radii, magnitudes, and temperatures, together with possible large uncertainties in the determination of the interstellar reddening, imply that the values listed in Table 7 must be seen as indicative.
6 Galactic chemical trends
The use of chemical abundances to distinguish between different populations in the Galaxy (in particular the thin disk, thick disk, and galactic bulge) has been thoroughly discussed in the literature (e.g. Bensby et al. 2003; Nissen 2004; Fuhrmann 2004; Brewer & Carney 2006; Fulbright et al. 2005). The observed differences are though to reflect different star formation histories in the different galactic systems. It is thus interesting to check if the abundances of the elements studied in the current paper for TrES-1 and the 5 OGLE stars differ or not from the ones measured in field disk stars.
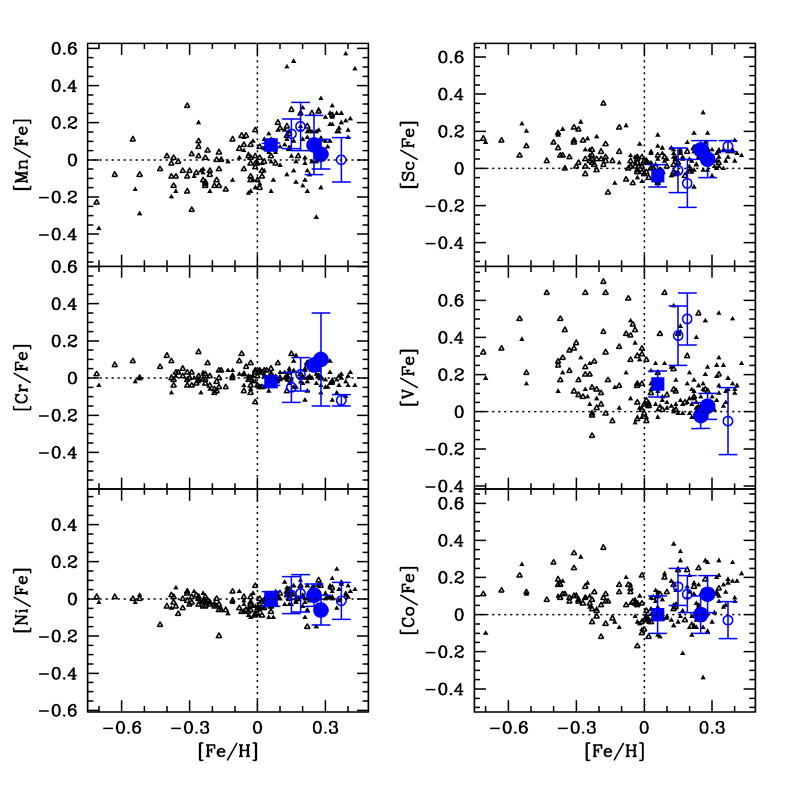
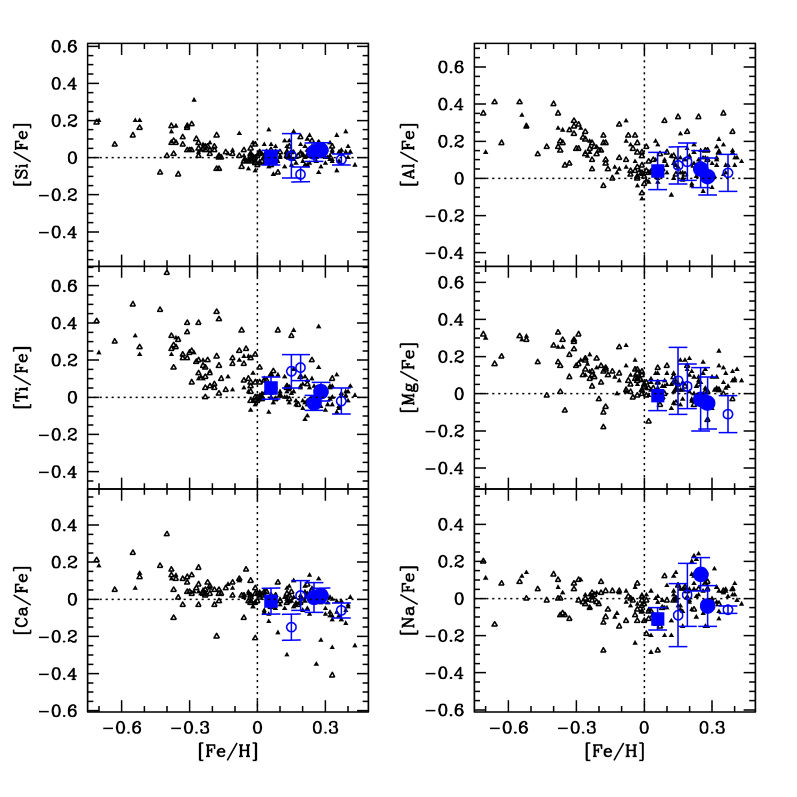
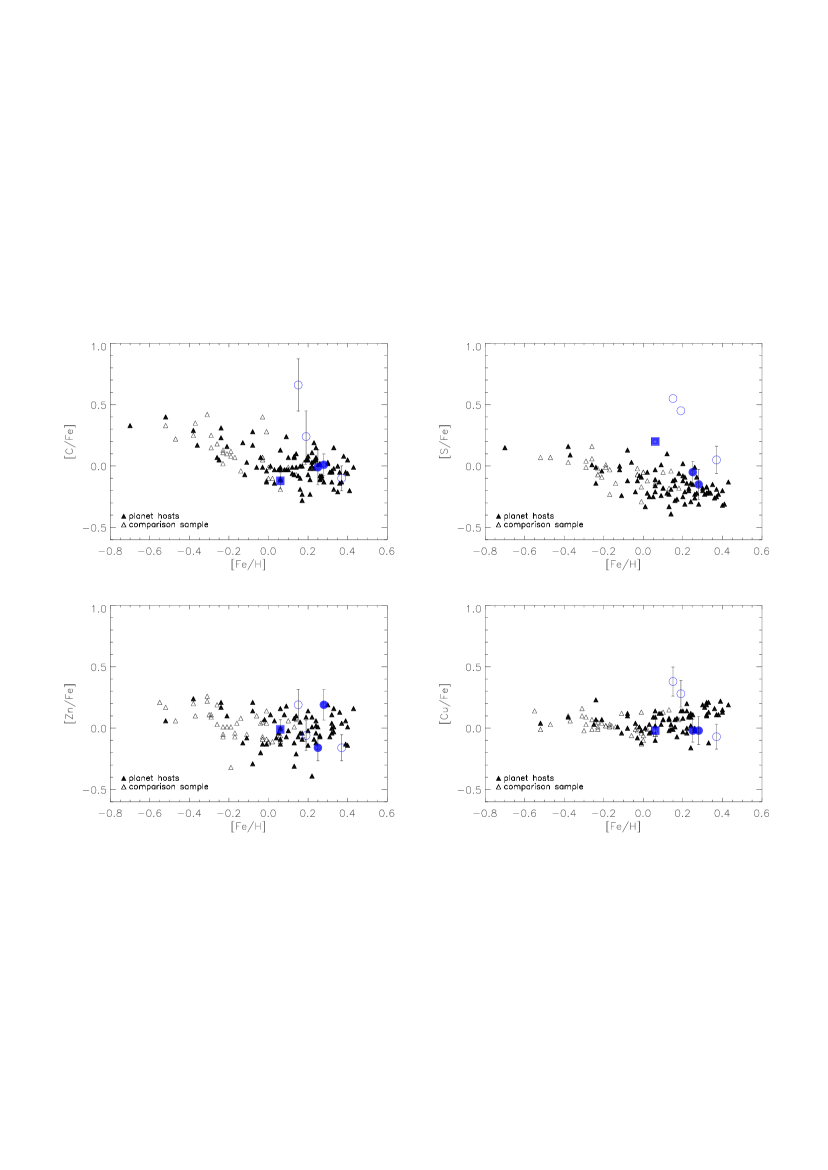
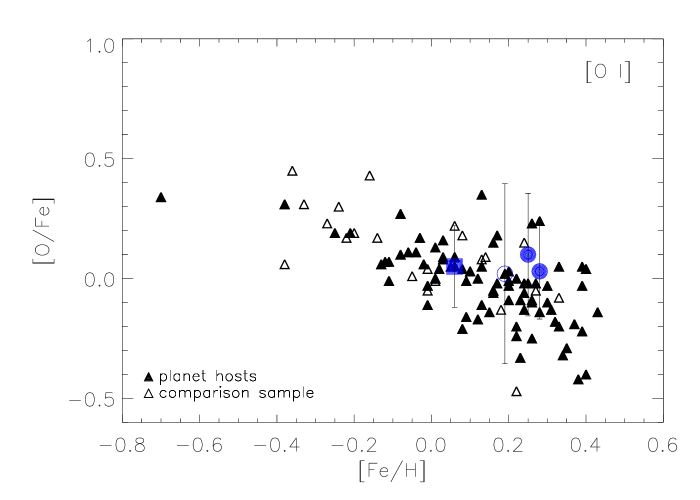
In Figs. 5, 6, 7 and 8 we present the [X/Fe] vs. [Fe/H] plots for all the elements studied in the current paper. In the figures, the small triangles denote the solar-neighborhood field stars studied in Bodaghee et al. (2003), Beirão et al. (2005), and Gilli et al. (2006) (cases of Na, Mg, Al, Si, Ca, Sc, Ti, V, Cr, Mn, Co, Ni), and in Ecuvillon et al. (2004, 2006b) (for O, C, S, Cu and Zn). Filled triangles correspond to stars with giant planets, and open triangles denote “single” (without known planets) field stars. The choice of these samples is based on the fact that these were studied using the same line-lists, analysis methods, and model atmospheres used in the current study, and thus give us confidence that a relative comparison will be unbiased. The 6 stars studied in this paper are denoted by the larger symbols. For the 3 Carina field stars (OGLE-TR-111, 113 and 132) we used an open circle, for the 2 bulge targets (OGLE-TR-10 and 56) we used a filled circle, while TrES-1 is denoted by a filled square. The choice of different symbols is important since these stars belong to different populations in the Galaxy (see Sect. 5).
As we can see from the plots, the 5 OGLE stars and TrES-1 are in a first analysis chemically indistinguishable from the field stars used as reference (mostly thin disk stars – Ecuvillon et al., in preparation), except for the fact that they represent a particularly metal-rich “population”. No major differences are found for any of the studied elements. In particular, no important alpha-element enhancement is observed. Such a trend could be typical of galactic bulge stars (e.g. Fulbright et al. 2005) or of thick disk objects (e.g. Fuhrmann 2004). The radial-velocities presented in Table 7 also do not show any particular anomaly. These same conclusions were also taken by Sozzetti et al. (2006) concerning TrES-1.
For the closest stars in the Carina field (OGLE-TR-111, 113), all with galactocentric radii similar to the Sun, this result is probably not unexpected. However, some differences could be expected for OGLE-TR-10 and 56, located at 1.5 Kpc in the direction of the galactic center, and for OGLE-TR-132, at more than 2 Kpc from us. The fact that the studied stars are not young (Melo et al. 2006), together with the stellar galactic velocity dispertion (Nordström et al. 2004), may help to explain this similarity.
A carefull look at the plots shows, however, that some small differences may exist. For instance, OGLE-TR-132 seems to generally occupy a position in the lower envelope of the points in the field star distribution. Given that this systematic effect is observed for most of the elements, this difference, although small, seems to be real. Interestingly, according to the calculations in Sect. 5, this star is the most distant of all the targets studied here.
Important differences may also be found for OGLE-TR-111 and 113 regarding V, C, Cu, and maybe Ti, where these two stars seem to be particularly overabundant. However, we should mention that the observed differences for these elements may be due to analysis effects. OGLE-TR-111 and 113 are the two coolest stars in our sample. As shown by Bodaghee et al. (2003), V and Ti are amongst the elements presenting the strongest [X/Fe] vs. Teff trends, possibly due to NLTE effects, where the lowest temperature stars present higher abundances. The high abundances of C and Cu are less simple to explain, as no clear dependence of the derived abundances of these two elements with effective temperature was found in the study of Ecuvillon et al. (2004). The very high carbon abundance of OGLE-TR-113 is particularly intriguing, although the derived value is based only on one of the two available carbon lines.
The abundances of Cu for TrES-1, OGLE-TR-10 and 56 are a bit below the field star sample, although in agreement within the errors. A similar residual low value is found for Al and most clearly for Mg in these stars.
Finally, the Ca abundance for OGLE-TR-113 seems to be particularly low, although the other alpha elements do not present the same tendency.
7 Condensation temperature
The accretion of planetary material has been proposed by several authors to explain the high metal content observed in stars orbited by giant planets (e.g. Gonzalez 1998; Murray et al. 2002). This effect could be particularly important concerning the stars with very short period planets, since planetary migration could increase the quantity of planetesimals falling into the stellar surface (Murray et al. 1998).
Abundance traces of pollution events in the atmospheres of stars with giant planets have indeed been reported in the literature in some particular cases (Israelian et al. 2001; Laws & Gonzalez 2001). Although several observational results have made this hypothesis unlikely (e.g. Pinsonneault et al. 2001; Santos et al. 2003; Fischer & Valenti 2005), even if they did not completely discard it (e.g. Vauclair 2004), it is interesting to explore this possibility in our case, since all the 6 stars in our sample are both metal-rich and orbited by short period giant planets.
If a solar-type stars engulfs a significant amount of planetary like material, we can expect to observe that some elements have been enriched more than others. Such an effect is expected since lower condensation temperature elements will probably evaporate before falling into the star. This idea may be valid, however, only if the infall of material is slow enough, or if the infalling bodies are not too big, so that the low condensation temperature material is able to escape. Having this possibility in mind, several authors have studied the trends of element abundance as a function of the condensation temperature of the elements in stars with giant planets (Smith et al. 2001; Takeda et al. 2001; Sadakane et al. 2002; Ecuvillon et al. 2006a).
Using the chemical abundances listed in Tables 1 through 6 we have derived the slopes of the relation between [X/H] and Tcond for the stars in our sample (Fig. 9). We used the same methodology as in Ecuvillon et al. (2006a), making use the condensation temperatures for the elements listed in Lodders (2003). In our case, these go from 78 K for carbon to 1677 K for aluminum.
The derived Tcond-slopes are all between 2 (for OGLE-TR-111) and 6 dex/100 000 K (for OGLE-TR-132), well within the values obtained for the other stars in the Ecuvillon et al. (2006a) sample. The only exception is OGLE-TR-113, whose Tcond-slope of 33 dex/100 000 K is due to the very high C abundance observed for this star. Excluding the carbon abundances for this star, the slope obtained is only of 5 dex/100 000 K. Unfortunately, for this star the abundance of carbon is based on one single carbon line, and we cannot confirm the observed C abundance. We note, however, that a negative slope indicates a low refractory-to-volatile ratio, contrary to what would be expected if pollution were responsible for any element abundance changes.

In all, we do not find any clear evidence for differential accretion in the 6 planet-host stars analyzed.
8 Concluding remarks
We have derived the abundances of C, O, Na, Mg, Al, Si, S, Ca, Sc, Ti, V, Cr, Mn, Co, Ni, Cu and Zn in the transiting planet-host stars OGLE-TR-10, 56, 111, 113, 132 and TrES-1. Using the available planetary radii and effective temperatures, as well as a model for the interstellar extition, we have also derived the galactic positions of the 6 stars. The results show that OGLE-TR-10 and 56 are more than 1 Kpc inside the solar radius, while the remaining stars have similar galactocentric radius as the Sun, although at a variety of distances.
A comparison of the chemical abundances with the ones found for stars in the solar neighborhood shows that appart from the fact that they are particularly metal-rich, no major differences are found regarding the relative element-over-iron abundances. Given their galactic positions, this result is probably not unexpected for OGLE-TR-111, 113 and TrES-1, but may be particularly interesting for the cases of OGLE-TR-10, 56 and 132.
Using the obtained chemical abundances and the condensation temperatures of the elements, we have then explored the possibility that the 6 stars, all orbited by short period giant planets, may have accreted planetary-like material. The results show no clear evidence for such phenomena, giving stronger support to the idea that the observed metal-content in the stars with giant planets is not due to the accretion of metal-rich, hydrogen poor material.
Acknowledgements.
We would like to thank A. Moitinho, S. Sousa, J. Lepine and E. Amores for the help in deriving the interstellar extinction values. Support from the Fundação para a Ciência e a Tecnologia (Portugal) to N.C.S. in the form of a fellowship (reference SFRH/BPD/8116/2002) and a grant (reference POCI/CTE-AST/56453/2004) is gratefully acknowledged.References
- Allende Prieto et al. (2001) Allende Prieto, C., Lambert, D. L., & Asplund, M. 2001, ApJ, 556, L63
- Alonso et al. (1996) Alonso, A., Arribas, S., & Martinez-Roger, C. 1996, A&A, 313, 873
- Alonso et al. (2004) Alonso, R., Brown, T. M., Torres, G., et al. 2004, ApJ, 613, L153
- Amôres & Lépine (2005) Amôres, E. B. & Lépine, J. R. D. 2005, AJ, 130, 659
- Anders & Grevesse (1989) Anders, E. & Grevesse, N. 1989, Geochimica et Cosmochimica Acta, 53, 197
- Beirão et al. (2005) Beirão, P., Santos, N. C., Israelian, G., & Mayor, M. 2005, ArXiv Astrophysics e-prints
- Bensby et al. (2003) Bensby, T., Feltzing, S., & Lundström, I. 2003, A&A, 410, 527
- Bessell et al. (1998) Bessell, M. S., Castelli, F., & Plez, B. 1998, A&A, 333, 231
- Bodaghee et al. (2003) Bodaghee, A., Santos, N. C., Israelian, G., & Mayor, M. 2003, A&A, 404, 715
- Bouchy et al. (2005a) Bouchy, F., Pont, F., Melo, C., et al. 2005a, A&A, 431, 1105
- Bouchy et al. (2004) Bouchy, F., Pont, F., Santos, N. C., et al. 2004, A&A, 421, L13
- Bouchy et al. (2005b) Bouchy, F., Udry, S., Mayor, M., et al. 2005b, A&A, 444, L15
- Brewer & Carney (2006) Brewer, M.-M. & Carney, B. W. 2006, AJ, 131, 431
- Charbonneau et al. (2000) Charbonneau, D., Brown, T., Latham, D., & Mayor, M. 2000, ApJ, 529, L45
- Ecuvillon et al. (2006a) Ecuvillon, A., Israelian, G., Santos, N. C., Mayor, M., & Gilli, G. 2006a, A&A, 449, 809
- Ecuvillon et al. (2004) Ecuvillon, A., Israelian, G., Santos, N. C., et al. 2004, A&A, 426, 619
- Ecuvillon et al. (2006b) Ecuvillon, A., Israelian, G., Santos, N. C., et al. 2006b, A&A, 445, 633
- Fischer & Valenti (2005) Fischer, D. A. & Valenti, J. 2005, ApJ, 622, 1102
- Flower (1996) Flower, P. J. 1996, ApJ, 469, 355
- Fuhrmann (2004) Fuhrmann, K. 2004, Astronomische Nachrichten, 325, 3
- Fulbright et al. (2005) Fulbright, J. P., McWilliam, A., & Rich, R. M. 2005, American Astronomical Society Meeting Abstracts, 207, 133.04
- Gilli et al. (2006) Gilli, G., Israelian, G., Ecuvillon, A., Santos, N. C., & Mayor, M. 2006, A&A, 449, 723
- Gonzalez (1998) Gonzalez, G. 1998, A&A, 334, 221
- Grebel & Roberts (1995) Grebel, E. K. & Roberts, W. J. 1995, A&AS, 109, 293
- Guillot et al. (2006) Guillot, T., Santos, N. C., Pont, F., et al. 2006, A&A, in press
- Henry et al. (2000) Henry, G. W., Marcy, G. W., Butler, R. P., & Vogt, S. S. 2000, ApJ, 529, L41
- Israelian et al. (2001) Israelian, G., Santos, N. C., Mayor, M., & Rebolo, R. 2001, Nature, 411, 163
- Konacki et al. (2003) Konacki, M., Torres, G., Jha, S., & Sasselov, D. 2003, Nature, 421, 507
- Konacki et al. (2005) Konacki, M., Torres, G., Sasselov, D. D., & Jha, S. 2005, ApJ, 624, 372
- Kurucz (1993) Kurucz, R. 1993, ATLAS9 Stellar Atmosphere Programs and 2 km/s grid. Kurucz CD-ROM No. 13. Cambridge, Mass.: Smithsonian Astrophysical Observatory, 1993., 13
- Kurucz et al. (1984) Kurucz, R. L., Furenlid, I., & Brault, J. T. L. 1984, Solar flux atlas from 296 to 1300 nm (National Solar Observatory Atlas, Sunspot, New Mexico: National Solar Observatory, 1984)
- Lang (1999) Lang, K. R. 1999, Astrophysical formulae (Astrophysical formulae / K.R. Lang. New York : Springer, 1999. (Astronomy and astrophysics library,ISSN0941-7834))
- Laughlin et al. (2005) Laughlin, G., Wolf, A., Vanmunster, T., et al. 2005, ApJ, 621, 1072
- Laws & Gonzalez (2001) Laws, C. & Gonzalez, G. 2001, ApJ, 553, 405
- Lodders (2003) Lodders, K. 2003, ApJ, 591, 1220
- McCullough et al. (2006) McCullough, P. R., Stys, J. E., Valenti, J. A., et al. 2006, ArXiv Astrophysics e-prints
- Melo et al. (2006) Melo, C., Santos, N., Israelian, G., et al. 2006, A&A, submitted
- Murray et al. (1998) Murray, N., Hansen, B., Holman, M., & Tremaine, S. 1998, Science, 279, 69
- Murray et al. (2002) Murray, N., Paskowitz, M., & Holman, M. 2002, ApJ, 565, 608
- Nissen (2004) Nissen, P. E. 2004, in Origin and Evolution of the Elements, ed. A. McWilliam & M. Rauch, 154–+
- Nordström et al. (2004) Nordström, B., Mayor, M., Andersen, J., et al. 2004, A&A, 418, 989
- Pinsonneault et al. (2001) Pinsonneault, M. H., DePoy, D. L., & Coffee, M. 2001, ApJ, 556, L59
- Pont et al. (2004) Pont, F., Bouchy, F., Queloz, D., et al. 2004, A&A, 426, L15
- Sadakane et al. (2002) Sadakane, K., Ohkubo, M., Takeda, Y., et al. 2002, PASJ, 54, 911
- Santos et al. (2004) Santos, N. C., Israelian, G., & Mayor, M. 2004, A&A, 415, 1153
- Santos et al. (2003) Santos, N. C., Israelian, G., Mayor, M., Rebolo, R., & Udry, S. 2003, A&A, 398, 363
- Santos et al. (2006) Santos, N. C., Pont, F., Melo, C., et al. 2006, ArXiv Astrophysics e-prints
- Sato et al. (2005) Sato, B., Fischer, D. A., Henry, G. W., et al. 2005, ApJ, 633, 465
- Schlegel et al. (1998) Schlegel, D. J., Finkbeiner, D. P., & Davis, M. 1998, ApJ, 500, 525
- Smith et al. (2001) Smith, V. V., Cunha, K., & Lazzaro, D. 2001, AJ, 121, 3207
- Sneden (1973) Sneden, C. 1973, Ph.D. Thesis, Univ. of Texas
- Sozzetti et al. (2006) Sozzetti, A., Yong, D., Carney, B. W., et al. 2006, AJ, 131, 2274
- Takeda et al. (2001) Takeda, Y., Sato, B., Kambe, E., et al. 2001, PASJ, 53, 1211
- Udalski et al. (2002) Udalski, A., Paczynski, B., Zebrun, K., et al. 2002, Acta Astronomica, 52, 1
- Vauclair (2004) Vauclair, S. 2004, ApJ, 605, 874