A Spitzer IRS Spectral Atlas of Luminous 8 µm Sources in the Large Magellanic Cloud
Abstract
We present an atlas of Spitzer Space Telescope Infrared Spectrograph (IRS) spectra of highly luminous, compact mid-infrared sources in the Large Magellanic Cloud. Sources were selected on the basis of infrared colors and 8 µm (MSX) fluxes indicative of highly evolved, intermediate- to high-mass stars with current or recent mass loss at large rates. We determine the chemistry of the circumstellar envelope from the mid-IR continuum and spectral features and classify the spectral types of the stars. In the sample of 60 sources, we find 21 Red Supergiants (RSGs), 16 C-rich Asymptotic Giant Branch (AGB) stars, 11 H II regions, 4 likely O-rich AGB stars, 4 Galactic O-rich AGB stars, 2 OH/IR stars, and 2 B[e] supergiants with peculiar IR spectra. We find that the overwhelming majority of the sample AGB stars (with typical IR luminosities L⊙) have C-rich envelopes, while the O-rich objects are predominantly luminous RSGs with LIR L⊙. For both classes of evolved star (C-rich AGB stars and RSGs), we use the near- to mid-infrared spectral energy distributions to determine mean bolometric corrections to the stellar K-band flux densities. For carbon stars, the bolometric corrections depend on the infrared color, whereas for RSGs, the bolometric correction is independent of IR color. Our results reveal that objects previously classified as PNe on the basis of IR colors are in fact compact H II regions with very red IRS spectra that include strong atomic recombination lines and polycyclic aromatic hydrocarbon (PAH) emission features. We demonstrate that the IRS spectral classes in our sample separate clearly in infrared color-color diagrams that use combinations of 2MASS data and synthetic IRAC/MIPS fluxes derived from the IRS spectra. On this basis, we suggest diagnostics to identify and classify, with high confidence levels, IR-luminous evolved stars and compact H II regions in nearby galaxies using Spitzer and near-infrared photometry.
1 INTRODUCTION
While studies in visible light, particularly spectroscopy, have been key to our understanding the nature and evolution of stars during most of their life cycles, the early and late stages of stellar evolution are best studied in the infrared. This is because, during these stages, the stars are embedded in regions of dust and gas. The late stages of stars of intermediate initial mass (1 – 8 M⊙) are characterized by very high luminosities and obscuration by dusty, expanding circumstellar envelopes (see review by van Winckel 2003). Circumstellar dust envelopes absorb photospheric optical and ultraviolet emission and re-radiate it in the mid- to far-infrared (MFIR). Thus evolved intermediate-mass stars are luminous in the infrared (IR) but may be highly obscured at optical wavelengths. Current theories of the later stages of the evolution of mass-losing stars therefore have been informed by IRAS, ISO, and 2MASS studies of intermediate-mass evolved stars in the Milky Way Galaxy and Magellanic Clouds.
Understanding the envelope chemistry of optically-obscured post-main sequence (MS) stars through IR studies is important for our overall view of galaxy evolution, since these stars dominate the rate of return of stellar processed material to the ISM (Jura & Kleinmann, 1989; Barnbaum et al., 1991; Le Bertre et al., 2001). Optical surveys (e.g., Groenewegen 1999 and refs. therein) can miss these objects because they are too faint to be detected. Dusty circumstellar shells in evolved stars are produced as the star loses mass via a combination of pulsations and radiation pressure on dust grains newly formed via the pulsation process. Once accelerated, these grains strip the (predominantly molecular) gas away from the stellar envelope. While on the Asymptotic Giant Branch (AGB), intermediate mass stars undergo dredge-up and surface enrichment in products of nucleosynthesis. The enriched material is thus returned to the ISM via the molecule-rich circumstellar dust shell.
More massive (8 M⊙) stars in the red supergiant (RSG) stage may resemble high mass-loss rate AGB stars, in that they are also surrounded by optically-thick circumstellar dust shells, though such high mass-loss rate RSGs are rare. Highly-obscured, evolved intermediate-mass (AGB) stars with large mass-loss rates likely dominate the rate of return of nuclear processed material to the interstellar medium. However, in our own Galaxy, it can be difficult to distinguish between high mass-loss AGB and RSG stars, due to their highly uncertain distances.
IR spectroscopy is particularly useful in determining the properties of circumstellar dust. The emission and absorption properties of different dust grains have been studied in the laboratory and modeled (e.g., Draine & Li 2001; Li & Draine 2001). IR-bright stars in the Galaxy have been observed with the IRAS LRS and, subsequently, with the spectrometers aboard ISO (see reviews by Waters et al. 1999; Waters & Molster 1999; Barlow 1999, 1997 and references therein) and classified using the dust features revealed in these spectra (e.g., Kraemer et al. 2002). The sensitivity of the Spitzer Infrared Spectrograph111This work is based on observations made with the Spitzer Space Telescope, which is operated by the Jet Propulsion Laboratory, California Institute of Technology under a contract with NASA. The IRS was a collaborative venture between Cornell University and Ball Aerospace Corporation funded by NASA through the Jet Propulsion Laboratory and Ames Research Center. (IRS, Houck et al. 2004) on the Spitzer Space Telescope (Werner et al., 2004) now makes it possible to study the IR spectra of IR-luminous, evolved stars in nearby galaxies.
In the absence of spectroscopy, photometric tools such as color-color diagrams can be used to identify and classify evolved stars. New studies of stellar populations in the Galaxy as well as in nearby external galaxies will rely in particular on photometry obtained with the Spitzer Infrared Array Camera (IRAC, Fazio et al. 2004) and Multiband Imaging Photometer for Spitzer (MIPS, Rieke et al. 2004). Indeed, the point sources detected in IRAC and MIPS imaging of nearby galaxies likely will be dominated by dust-enshrouded post-MS stars. As strong silicate and carbonaceous dust features at 10 µm distinguish C-rich and O-rich envelope chemistries, respectively, the use of IRAC and MIPS colors can, in principal, avoid the ambiguity in assigning stellar classes based on near-infrared (NIR) colors (e.g., Egan, Van Dyk & Price 2001, hereafter EVP01). However, such photometric diagnostics must first be reliably associated with IR spectral properties, which are best determined from IRS spectroscopy.
As previous infrared surveys have demonstrated (e.g., Groenewegen et al. 1995; Groenewegen & Blommaert 1998; Zijlstra et al. 1996; Loup et al. 1997; van Loon et al. 1997, 1998; Trams et al. 1999), the Large Magellanic Cloud (LMC) is an ideal nearby galaxy to study the evolution of mass-losing post-MS stars. Firstly, it contains a large population of IR-luminous, mass-losing objects found at essentially the same distance, thereby alleviating the distance ambiguities that haunt IRAS and ISO samples of mass-losing stars in the Galaxy. This allows the spectral properties of the LMC evolved star population to be directly related to their luminosities, providing important constraints on stellar models. Indeed, the luminosity distribution of carbon stars in the LMC has long been a key test of models of the late stages of stellar evolution in low metallicity environments (e.g., Iben & Renzini 1983). Secondly, the low metallicities and high star formation rates of the LMC mimic those of high-redshift galaxies. In addition, spectra of LMC objects can be used to establish “ground truth” for IR photometric diagnostics.
Due to the proximity of the LMC, individual objects have been detected by previous IR satellites: IRAS and MSX each detected 1800 IR sources in or towards the LMC (Schwering 1989; EVP01). The most sensitive band on MSX, A band ( = 8.3 µm), was approximately four times more sensitive than the IRAS 12 µm band, and permitted the detection of evolved stars with less extreme IR luminosities than those detected by IRAS (EVP01). EVP01 combined the MSX A band flux (in magnitudes) with near-IR (JHK) measurements from the 2MASS survey to form various diagnostic color-color and color-magnitude diagrams for the LMC objects. To classify their nature based upon these IR fluxes, they compared these color-color and color-magnitude diagrams to analogous diagrams constructed for various classes of stars based upon the Wainscoat et al. (1992) “SKY” model of the Galaxy. On this basis, they characterized the stars in specific categories, including red supergiants, early (low mass loss) O-rich and C-rich AGB stars (EVP01 category 5), late (high mass loss) O-rich and C-rich AGB stars (category 6), and PNs and H II regions (category 7). Within these categories, the different types of objects were distinguished somewhat on the basis of colors, although only for the late C-rich and O-rich AGB stars were the objects well distinguished within a category. Note that EVP01 classified 500 of the 1800 objects in their study as foreground Galactic objects. To check the accuracy of this classification scheme for the LMC objects, EVP01 investigated the spectral types of the LMC objects using data in SIMBAD. However, for the bona fide LMC objects, only a small percentage had classifications; these were especially uncommon for categories 6 and 7. Although the limited data do not contradict their classifications, these classifications suffer from limited spectroscopic support. This is not surprising, as the IR-luminous objects detected by MSX do not commend themselves to visible spectroscopy, and the requisite mid-IR spectroscopy has been impractical until only recently. To date, the study by EVP01 stands as the most comprehensive classification of luminous 8 µm sources in the LMC. Therefore it is important to verify and/or correct the EVP01 color classifications.
We have conducted a spectroscopic study with Spitzer IRS (PI: J. Kastner; PID: 3426) of a representative sample of objects selected on the basis of their IR colors and magnitudes to be the most IR-luminous post-MS stars in the LMC. Here we present the atlas of spectra. We then use these spectra as the basis both for understanding the high-luminosity end of the LMC evolved star population and for establishing photometric diagnostics for classifying IR stars. In §2 we describe the sample selection, observations, and data reduction. In §3 we present the spectra and classify them according to continuum and spectral features and bolometric luminosities. In §4 we describe the classes of objects identified and compare the classifications with the types assigned by EVP01. We then use our library of IRS spectra to show how Spitzer/2MASS colors can be used to classify IR-luminous sources in external galaxies reliably and unambiguously. On the basis of our new classifications, we discuss the implications for the late stages of stellar evolution. Detailed analysis of individual spectra and of the spectral classes established in this study will be presented in future papers.
2 SAMPLE AND OBSERVATIONS
The complete sample observed by IRS comprises 62 IR sources, selected on the basis of large 8.3 µm fluxes from the comprehensive catalog of 2MASS/MSX sources compiled by EVP01. The EVP01 sources were classified based on IR colors. These sources have coordinates accurate to . We selected those MSX 8.3 µm (A-band) sources with mJy (A) that were classified by EVP01, on the basis of 2MASS/MSX IR colors, as “late” (i.e. very red) O-rich AGB (‘O’or ‘OH/IR’), “late” C-rich AGB (‘C IR’), red supergiants (‘RSG’), or planetary nebulae (‘PN’). This resulted in a preliminary sample of sources. Of these, % were classified as OH/IR, % as PN, % as RSG, % as O AGB, and % as C IR. We then randomly deselected sources so as to “thin” this preliminary list to 59 targets, distributed so as to include 10 – 15 sources from each of these five evolved star spectral classes defined in the EVP01 2MASS/MSX study. To ensure representation in the sample of the most rapidly mass-losing, and hence highly obscured, objects — which may have not been detected by 2MASS and therefore may have been excluded from the EVP01 sample — we include seven additional IRAS sources. These were sources selected from known or candidate evolved stars (Trams et al., 1999), that satisfied our 8 µm flux criterion, for which 2MASS positions were made available subsequent to publication of the EVP01 MSX LMC catalog, and which were not listed on the Spitzer Reserved Observations Catalog. Of this final sample of 66 sources, four targets (1 EVP01 source and 3 IRAS sources) were not observed, due to conflicts with other Spitzer programs. The 62 observed sample objects are listed in Table 1, where we list 2MASS (J, H, and K) and MSX (A) magnitudes, IR types determined from the IR colors by EVP01, and object types and other star names we obtained from SIMBAD.
The targets were observed by Spitzer using the IRS in staring mode. The short-low (SL) and long-low (LL) modules were used; these modules cover the wavelength ranges 5.2 – 14 µm and 14 – 38 µm, respectively, with resolving powers of 64 – 128. Two nod positions along the slit were observed to facilitate rejection of artifacts in the data. For most objects, four exposures of 30 and 14 seconds for the SL and LL modules, respectively, were obtained at each nod position. A few unusually bright objects were observed with shorter exposure times to avoid saturating the detector. To accurately position each object in the slit, a peak-up procedure was used (IRS or PCRS). Two observations (MSX LMC 769 and 773) were unsuccessful due to peak-up failure; the fields were crowded and the peak-up centered on the wrong object. Thus, this atlas presents spectra of 60 objects.
The raw data were processed through the Spitzer pipeline version S11.0. After pipeline processing, the basic calibrated data (BCDs) were processed using the SMART software222SMART was developed by the IRS Team at Cornell University and is available through the Spitzer Science Center at Caltech. (Higdon et al., 2004). The two-dimensional spectral images (BCDs) of the multiple exposures were median-combined and, in most cases, the off-source images were subtracted to remove the sky background. In the case of four objects, the off order was contaminated and could not be used for sky subtraction. In these cases, the sky was estimated locally, on either side of the extracted aperture.
Spectra were extracted and the fluxes were calibrated using the default point source extraction apertures in SMART. The modules at each nod position were merged and the edges and overlapping regions of the modules were trimmed. The spectra from the two nod positions were then averaged to produce the final spectrum. The Spitzer pipeline produces uncertainty images; however the uncertainty images produced by the S11 pipeline are unreliable. Therefore, we estimated the flux uncertainty in each spectrum based upon the differences between the two nod position spectra at each wavelength. The final uncertainty for each spectrum was assumed to be the median value of the uncertainties at all wavelengths; these generally ranged from 2 – 20 mJy, though 4 objects had median uncertainties 30 mJy. We found that the relative uncertainties (the median value of the uncertainty at each wavelength divided by the flux at that wavelength) were typically 2%, with a maximum of 5%. We note that the wavelength calibration in the S11 pipeline is incorrect (too red) by 0.04 µm for the SL module and also uncertain (by 0.14 µm) for the LL module. These wavelength inaccuracies are not expected to have any effect on the analysis or conclusions of this paper.
3 RESULTS: THE SPECTRA
3.1 SPECTRAL FEATURES
Mass-losing evolved stars are expected to show distinctive IR features, depending on the chemistry of the circumstellar dust (e.g., Draine & Lee 1984). Oxygen-rich dust shows silicate features at 9.7 and 18 µm which appear in emission at low optical depths and absorption at high optical depths (i.e. high mass-loss rates). Carbon-rich stars show a broad SiC dust emission feature at 11.5 µm and a narrow absorption feature at 13.7 µm, due to C2H2 gas in the circumstellar envelope.
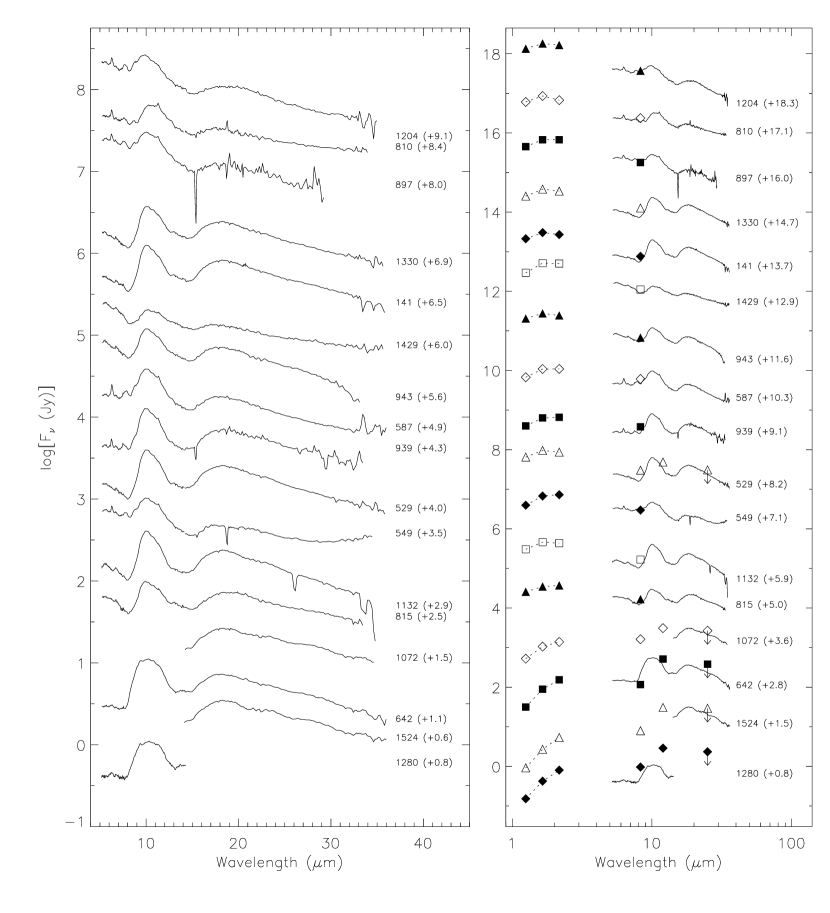
The IRS spectra are presented in Figure 1. The spectra are grouped according to the dominant spectral features: features indicative of a predominance of silicate dust (Fig. 1a); features indicative of a predominance of carbonaceous dust and/or molecules (Fig. 1b); or polycyclic aromatic hydrocarbon (PAH) features and narrow emission lines (Fig. 1c). The O-rich objects are further divided into subgroups (see §3.3). Within each group, the objects are then placed in order of increasing luminosity, which we have calculated (see §3.2). Figure 1 also shows the infrared spectral energy distributions (SEDs) of the sample objects, including the IRS spectra, MSX 8.3 µm fluxes, and 2MASS and IRAS fluxes (obtained from SIMBAD) where available. Two objects (MSX LMC 1072 and 1524) were observed using only the LL modules, as data were already being obtained for Spitzer project PID:1094. A third object (MSX LMC 1280) was observed using only the SL modules, as data were being obtained for program PID:3505.
The largest of the three groups of spectra is that of the oxygen-rich objects. These mostly show the expected strong silicate emission features and have continua that are dominated by photospheric emission at short wavelengths and dust emission at longer wavelengths. The silicate features are generally quite smooth, indicating an amorphous composition for the silicate dust (MSX LMC 1326 is a notable exception, showing peaks indicative of crystalline silicate dust; Kastner et al. 2006). Many of the spectra of the evolved O-rich objects (most of which are RSGs; see §4.1) also show a narrow 6.2 µm emission feature. This is unexpected, since this feature is generally attributed to PAHs, carbon-based molecules which are not expected to be found in the circumstellar environment of an O-rich evolved star. The 2-dimensional spectra show that this feature is commonly seen in emission in the sky (i.e., in the LMC) in the vicinity of these O-rich objects, and that there is some spectral contamination that is not completely canceled out in the sky subtraction process. However, this sky emission is at very low flux density levels, not enough to explain the bright features observed. Extraction of off-source spectra indicates that the 6.2 µm feature can is only detectable on the source, and is not apparent in off-source spectra, with or without sky subtraction. The presence of this 6.2 µm carbon feature, and the suggestion of the 11.3 µm PAH feature, in the spectra of some O-rich objects is a puzzle. The second group of objects, the C-rich sources, show the expected SiC emission and C2H2 absorption features and have continua dominated by dust emission. The broad “30 micron” feature seen in C-rich evolved sources and attributed to MgS is also present in most. There are also a significant number of very red objects that show forbidden emission lines and strong features attributed to PAHs; these make up the third group of sources in our sample. In Figure 2 we present a typical spectrum from each of the three groups, with the primary spectral features indicated.
Spurious features appear in several of the spectra, at wavelengths 15.6, 18.7, 33.5, 34.8, and 36.0 µm. Examination of the 2-dimensional spectral images shows that these are due to background “sky” emission lines originating in diffuse gas in the LMC; the lines appear in off-source as well as on-source spectral images and are unrelated to the program sources. The wavelengths correspond to known [S III], [Si II], and [Ne III] emission lines. These spurious features appear in our spectra of C-rich and O-rich sources in emission or absorption; because this diffuse emission is not uniform across the region covered by the spectrograph slit, it is not always removed properly by our sky subtraction. These features are seen at much stronger levels in emission in the very red emission-line objects, and in these cases they clearly arise from the sources themselves.
3.2 LUMINOSITIES
Infrared luminosities were calculated by integrating the flux over the wavelength range 1 – 100 µm. The IRS spectra were used to determine the flux densities over the wavelength range 5.0 – 36.0 µm. The integrated fluxes over the range 1 – 5 µm were determined using a blackbody scaled to match the 2MASS flux densities, and the flux densities from 36 – 100 µm were estimated using a blackbody weighted by (to approximate optically-thin emission) and scaled to match the IRS spectrum and available IRAS data. An example of this procedure for each of the three groups is shown in Figure 3. A distance to the LMC of 50.1 kpc (distance modulus 18.50 mag; Freedman et al. 2001) was assumed.
The uncertainties in the luminosities are dominated by the uncertainty in the shapes of the spectral energy distribution in the wavelength ranges outside the IRS spectrum. The temperatures of the blackbodies were varied to estimate the uncertainties in the measurement of the luminosities, which were found to be 5 – 10% for the O-rich and C-rich evolved stars. The assumption that the shape of the SED between 2 and 5 µm can be approximated by a blackbody curve was investigated using ISO spectra of Galactic objects and might contribute an additional uncertainty to the luminosities of up to a further 19% (typically 4%). In calculating the luminosities of the mass-losing stars, we note that we have neglected the effects of variability. Long period variables may vary by up to 1 magnitude in the NIR, which results in up to a factor 2.5 uncertainty in the derived luminosities of these objects, assuming that the shape of the 1 – 100 µm SED remains the same as the flux varies. Although not affected by variability, the uncertainties in the measurement of the luminosities of the red emission-line objects are large because most of the emission is from wavelengths longer than the IRS spectral range, where the shape of the spectral energy distribution is poorly constrained. The uncertainties in the luminosities of these sources may be up to a factor of a few. The bolometric luminosity will be dominated by the IR luminosity for most sources. The RSGs are the only stars in the sample for which optical emission might be expected to contribute significantly to the SED; however, we find that the derived bolometric correction for the RSGs has very little dispersion between objects (§4.4), so there can be little contribution shortward of JHK. Luminosities are listed in Table 2. Histograms of the luminosities of the stars in each group are shown in Figure 4.
3.3 CLASSIFICATION OF THE SPECTRA
Several IR spectral classification schemes have been established since the advent of satellite mid-IR spectroscopy. IRAS had a Low-Resolution Spectrometer (LRS) that obtained spectra in the range 823 with a resolution that varied from 40 at the short end to 20 at the long end. The original IRAS LRS atlas contained spectra of 5425 sources (Olnon et al., 1986). These were classified based upon the continuum shape (blue or red) and the presence or absence of certain dominant spectral features (i.e., silicate emission or absorption or C-rich features). Volk & Cohen (1989), Volk et al. (1991), and Kwok, Volk, & Bidelman (1997) extracted spectra of additional objects from the IRAS database to arrive at a total of 11,224 sources. These were classified into nine groups, with a one-letter designation based on the dominant spectral feature(s) and/or the shape of the continuum.
Kraemer et al. (2002) developed a new classification system (hereafter the KSPW system) that they applied to the over 900 objects for which complete spectra were obtained by ISO with the Short Wavelength Spectrometer (SWS). The SWS had a wavelength range of 2.445 m with a resolution of 1000 – 2000. Since our IRS spectra extend to 38 µm and have a resolution of 64 – 120, they are better matched to the ISO spectra, and we will consequently classify our spectra according to the KSPW system.
We compared our IRS spectra to typical ISO spectra in the KSPW spectral classes333ISO spectra of template objects were obtained from http://isc.astro.cornell.edu/ sloan/library/swsatlas/aot1.html.. In the KSPW system, stars are classified according to their continua, with subclasses assigned according to the appearance of specific spectral features. The continuum is characterized by the temperature of the dominant emitter, in particular whether it is photospheric or dust emission. Spectral features include broad features associated with silicate or carbon rich dust emission, complex features thought to be due to PAH emission, and narrow atomic and molecular features. We classified each of our sample objects according to the KSPW system.
We also assigned an “IRS type” to each star in our sample based on the observed spectral features and luminosities (as well as optical information for the two peculiar objects). The various classifications of the sample objects so derived from the IRS spectra are listed in Table 2, along with the original EVP01 type. The new classifications are discussed in the next section.
4 DISCUSSION
4.1 O-RICH STARS
O-rich objects represent the largest group in the sample, with 33/60 objects (55%) having IR features indicative of O-rich dust. The majority of these O-rich spectra (25/33) are dominated by photospheric emission at shorter wavelengths and by dust emission at longer wavelengths (group 2 in the KSPW system). Most of these (22 objects) have strong silicate dust emission features, and hence we classify these objects as belonging to KSPW subgroup 2SEc, while the remaining three are best classified as 2SEa. These 3 objects show weaker, broader 10 µm emission and weaker, more sharply peaked 18-20 µm emission than the 2SEc stars, as well as a 13 µm feature in emission, possibly due to aluminum-rich silicate grains (Sloan et al., 2003). All except one (MSX LMC 1677, discussed below) of the 22 O-rich objects with strong dust features and significant photospheric emission have IR luminosities L⊙, and so we identify them as RSGs. The previous classifications of these objects (EVP01) were either O-rich AGB stars or RSGs (see Table 2).
Examination of the luminosities of the three O-rich stars in subgroup 2SEa and MSX LMC 1677 (subgroup 2SEc) reveals that, if these stars were at the distance of the LMC, they would have luminosities 5.8 L⊙. These luminosities would place them significantly above the distribution of luminosities for the RSGs (Figure 4; these four objects are not included in the histogram). We conclude that these four stars are in fact in the halo of the Milky Way Galaxy. One of the stars, MSX LMC 412 (RS Men), is a known Galactic Cap Mira variable with a heliocentric radial velocity of 140 km s-1 and period of 304 days (Whitelock et al., 1994). These authors derive a distance to this star of 4.75 kpc using the period-luminosity relation to determine the luminosity and inferring the distance from the measured flux. We estimate luminosities for the other three Galactic stars using their K magnitudes and color-period-luminosity relationships determined by Whitelock et al. (1994). Distances of 4.2, 3.3, and 5.1 kpc, for MSX LMC 1150, 1686, and 1677, respectively, were inferred for the three sources using luminosities so derived. Three of the stars are identified by EVP01 as O AGB stars from their blue NIR colors, while one star, MSX LMC 1686, had been misidentified as a C AGB star. The NIR colors of MSX LMC 1686 are consistent with the categories of both O AGB and C AGB (EVP01) and EVP01 note that there is some confusion and overlap between these categories. These Galactic Cap stars will be discussed in detail in a forthcoming paper.
Three, possibly four, of the O-rich stars, MSX LMC 642, 1072, 1524, and 1280, have spectra dominated by warm dust (group 3). We classify these as KSPW subgroup 3SE, i.e., similar to the majority of the O-rich stars (subgroup 2SEc) with strong silicate emission at 10 and 18 µm from optically thin dust emission, but with thermal continuum from an optically thick dust shell. The SED, , peaks around 10 – 15 µm, indicating a strong warm dust contribution, although peaks closer to 2 µm, due to the contribution from the reddened stellar photosphere. The silicate emission features are stronger than the Galactic O-rich AGB stars discussed above. The combined SL+LL spectra of MSX LMC 1072 and 1524, kindly provided by Marckwick-Kemper, confirm the classifications we made based on our LL spectra. The classification of MSX LMC 1280 is based on our SL spectrum, which covers only the 5 – 14 µm wavelength range, and is therefore somewhat tentative. The luminosity of this source was derived by assuming the same spectral shape as MSX LMC 1189, and is highly uncertain. These four O-rich stars with dust-dominated spectra have IR luminosities of 2 – 7 L⊙, placing them very high on the AGB, so we tentatively identify these as luminous O-rich AGB stars. Although the theoretical limit for the luminosity of AGB stars is L⊙, luminosities slightly higher than this may be possible from higher mass (10 M⊙) progenitors at low metallicity (i.e., super-AGB stars Herwig 2005). Our classifications of these objects based upon the mid-IR spectra differ significantly from those of EVP01: One of the 3SE stars (MSX LMC 1072) has EVP01 type PN, but its IRS spectrum clearly lacks the red continuum. It is likely to be a O AGB star, as it only narrowly falls outside of the criteria for identifying O AGB stars in EVP01: H-K = 0.76, 0.01 magnitudes too red. The other stars classified as 3SE have EVP01 type C IR. MSX LMC 1280, 1524, and 642 have 2MASS/MSX colors inconsistent with the EVP01 criteria for O AGB, OH/IR stars and RSGs but their IRS spectra clearly indicate O-rich envelopes.
We find no population of less luminous O-rich AGB stars in the sample. It is possible lower luminosity O-rich objects were excluded from the sample due to our A-band selection criterion ( mJy; §2). Unlike the C-rich AGB stars, the 8 µm flux is a small fraction of the bolometric luminosity for the O-rich AGB stars, therefore lower luminosity O-rich AGB stars are relatively fainter at 8 µm. The 4 Galactic O-rich AGB stars in our sample, for example, would have mJy if they were at the distance of the LMC, and so would have been excluded from our sample. Identifications of O-rich AGB stars fainter than those studied in this work are necessary to confirm the possibility that the lack of lower luminosity O-rich AGB stars in our sample is a selection effect.
Two of the O-rich stars show self-absorbed silicate emission features at 10 µm, indicative of optically thick dust shells. One of the objects, MSX LMC 1182, shows broad silicate emission with strong, narrower central absorption, and has an IR luminosity of 4.7 L⊙, confirming its status as an OH/IR supergiant (Wood et al., 1986; Roche et al., 1993). The spectrum of MSX LMC 1182 is dominated by very cool dust so we classify it as group 5 in the KSPW system, though its exact subclassification is ambiguous. This star is one of the IRAS sources included in our sample to ensure representation of the most highly obscured objects (§2). It was not selected on the basis of a classification by EVP01; it is in the EVP01 sample, but does not have an EVP01 type. The other object, MSX LMC 807, shows less strongly self-absorbed 10 µm emission, and has luminosity 4104 L⊙. We identify this object as a likely OH/IR star on the AGB, in agreement with its EVP01 type, although we note that OH maser detection is required to confirm its formal OH/IR star classification. This spectrum falls into KSPW subclass 3SB, which is associated with AGB and OH/IR stars.
The remaining two O-rich objects, MSX LMC 890 and MSX LMC 1326, show relatively flat continua with strong broad silicate emission at 10 µm and 18 – 20 µm. We assign these objects IRS type “Peculiar”. MSX LMC 890 and MSX LMC 1326 are optically identified as hypergiant B stars R 126 and R 66, respectively, and the IR spectra are best matched by the class 5SE template spectrum, which are generally young stars. The IRS spectra of these stars are likely to be indicative of circumstellar, perhaps circumbinary, disks, and are modeled and discussed in detail by Kastner et al. (2006), who classify them as B[e] hypergiants. MSX LMC 890 and MSX LMC 1326 have EVP01 type PN based on their NIR colors. EVP01 separate PNe from early type stars with surrounding dust (such as these B stars) using the H-K color, as PNe are redder than the younger objects in the Wainscoat et al. (1992) model. They note that their classification may be confused for objects with H-K colors near the boundary, i.e. H-K = 0.75, and other authors have shown that Galactic PNe can have NIR colors considerably bluer than this (Whitelock, 1985; Ramos-Larios & Phillips, 2005). MSX LMC 890 and MSX LMC 1326 are slightly redward of this boundary (H-K = 0.94 and 0.81, respectively), and so were misclassified by EVP01 as PNe when they are instead dusty B stars. It has been noted by Whitelock (1985) that the H-K colors of PNe are in fact not dissimilar from hot stars surrounded by dust, though a J-band excess in PNe due to He line emission produces redder J-K colors which may distinguish these objects from younger stars.
4.2 C-RICH STARS
Sixteen of the 60 sample stars (27%) have spectra typical of warm carbon-rich dust envelopes. The IR luminosities of the C-rich stars are 5 – 2 L⊙, so we identify all 16 C-rich stars as AGB stars. The large number of C-rich AGB stars in the sample stands in stark contrast to the lack of O-rich AGB stars found (§4.1) and has implications for the late stages of stellar evolution (see §4.5). In addition to the silicon carbide emission feature and the narrow C2H2 absorption feature at 13.7 µm, there is a C2H2+ HCN absorption feature at 7.5 µm seen in almost all these spectra. Another broad absorption feature, due to C2H2 and HCN, may be present between 14 – 16 µm (Sloan et al., 1998; Aoki et al., 1999), particularly in MSX LMC 1384. A broad emission bump, peaking at wavelengths 26 µm, is present in 11 objects. This feature, known as the “30 micron” emission feature, is usually attributed to MgS (Goebel & Moseley, 1985). Forrest et al. (1981) detected it initially in the most optically thick Galactic carbon stars and in C-rich PNe. It has subsequently been seen in several carbon-rich PNe and approximately a dozen carbon-rich proto-PNe (Volk et al., 2002). There is evidence from ISO that this broad feature is composed of two features, peaking at 26 µm and 33 µm, and with varying strengths depending upon the evolutionary state of the star (Hrivnak et al., 2000; Volk et al., 2002). Hony et al. (2002) have examined this broad feature in a variety of evolved carbon-rich objects and are able to fit it by using MgS grains of varying temperatures.
Most of the carbon-rich stars (12/16) have spectra that are dominated by warm dust. These are classified as subgroup 3CE. Only three of these 12 have EVP01 type C IR, while one has no EVP01 type (no 2MASS data available) and 8 have EVP01 type OH/IR. These eight stars have very red NIR colors for carbon-rich stars, compared with the Wainscoat et al. (1992) model predictions and EVP01 classifications. Only one star (MSX LMC 218) has H-K and K-A colors close to the boundary for C IR stars, while the other seven have colors too red to be categorized as EVP01 type C IR, C AGB or RSG. Two carbon-rich stars, MSX LMC 1652 and 1592, have spectra dominated by cooler dust; they fall into subgroup 3CR. MSX LMC 1652 has EVP01 type OH/IR, with extremely red NIR colors. MSX LMC 1592 has no 2MASS data so has no EVP01 type. One star, MSX LMC 1400, shows clear SiC features, but matches equally well the 3CE and 3CR templates, so has been classified as ’3C?’. It also has very red NIR colors for a C-rich star and has EVP01 type OH/IR.
The final object classified as a carbon-rich star, MSX LMC 775, shows a nearly featureless spectrum with a narrow peak at 5 – 6 µm and relatively blue continuum. The 13.7 µm C2H2 absorption feature apparent in all other carbon-rich stars in our sample is notably absent. This spectrum is not well matched by any of the naked star (group 1) or stellar photosphere + dust (group 2) ISO template spectra. The spectrum of MCX LMC 775 is very similar in slope to that of MSX LMC 1492, but without the clear 13.7 µm feature. The lack of strong O-rich or C-rich dust features suggests that this object may be an S star, with approximately equal carbon and oxygen abundances (e.g., Jura 1988). However, the IRS spectrum of MSX LMC 775 does not resemble the ISO spectrum of the S star W Aql and shows a hint of a SiC feature at 11.5 µm, which is rare for S stars (Chen & Kwok, 1993), suggesting the emission may be due to optically thick carbon-rich dust. This unusual object may be similar to R Corona Borealis, which typifies a class of stars that have hydrogen-deficient and carbon-rich atmospheres and are highly variable due to periods of dust formation (see review by Clayton 1996). These objects show nearly featureless mid-IR spectra, that are dominated by blackbody continuum (Clayton, 1996; Kraemer et al., 2005). Two such R CrB stars have recently been identified in the Small Magellanic Cloud (Kraemer et al., 2005); these objects show similar Spitzer spectra to MSX LMC 775, although MSX LMC 775 is well-described by a modified blackbody (multiplied by ), rather than a simple blackbody continuum as seen in these two. RCB stars are identified mainly by the absence of hydrogen features in their optical spectra and by variability characterized by dramatic declines in the optical brightness at irregular intervals (Clayton, 1996). Further data, such as optical spectroscopy and an optical light curve, are necessary to confirm if this candidate is indeed an R CrB source or an S star. MSX LMC 775 has EVP01 type C IR.
4.3 RED, EMISSION-LINE OBJECTS
Approximately one fifth of the sample (11 objects) is comprised of very red objects which have a peak in their SED longer than the wavelengths observed by IRS (group 5). These objects are dominated by cool dust and show strong PAH emission features and narrow emission lines. These red, emission-line objects were classified by EVP01 as type PN, which they distinguish from H II regions associated with massive star formation by H-K colors (H-K 0.75). Indeed, the spectra of these objects resemble the ISO spectra of PNe that are classified as 4PU in the KSPW scheme. However, various lines of evidence, discussed below, indicate that these objects are H II regions rather than PNe.
The luminosities of the red objects are rather high, – L⊙. Most of these are too luminous to be the immediate descendents of evolved, intermediate-mass stars (Figure 4), but rather they agree with the luminosities of H II regions powered by massive young O stars. The IR luminosities of many of these objects are somewhat uncertain, as much of the flux is emitted beyond 40 µm, where the shape is the spectral energy distribution is poorly, if at all, constrained (§3.2). The infrared flux densities of the H II regions are, if anything, more likely to be underestimated, due to extended emission falling out of the slit. Thus the luminosities argue against most of these objects being PNe.
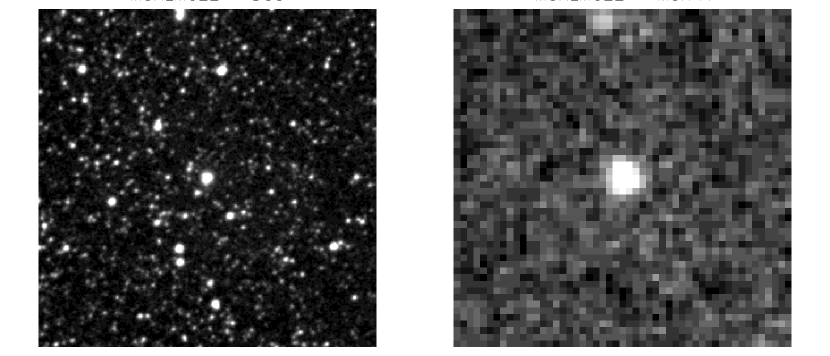
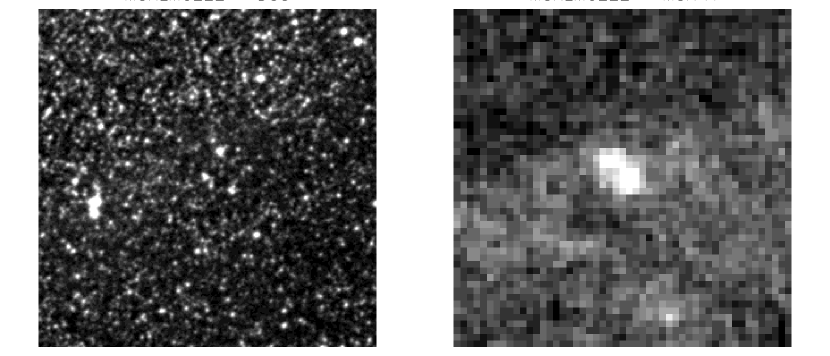
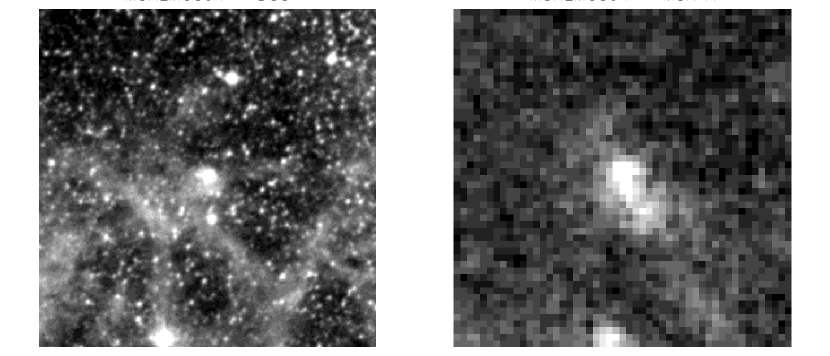
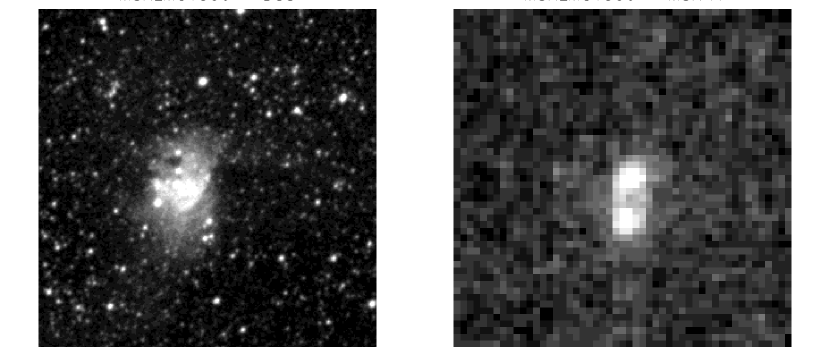
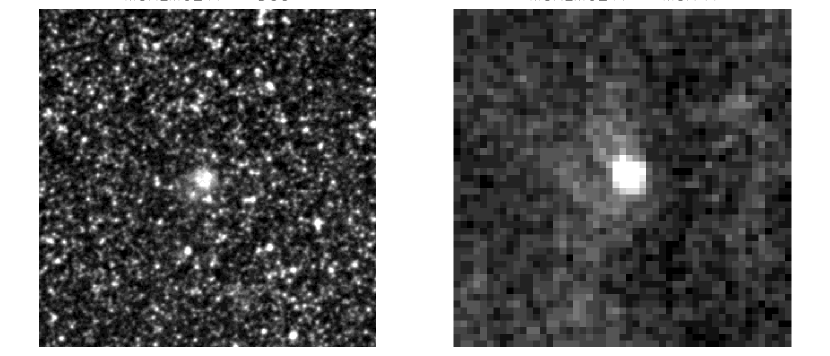
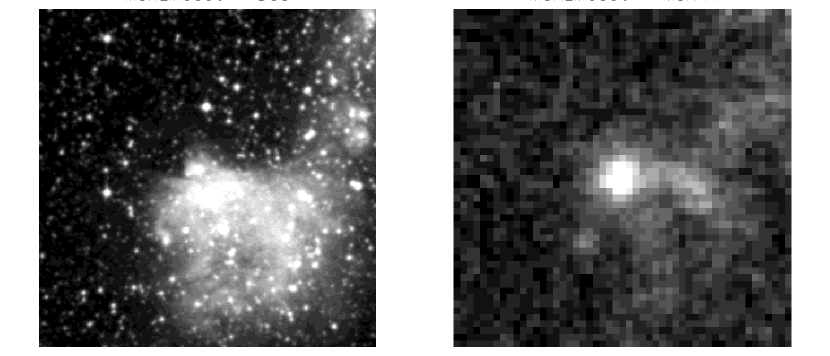
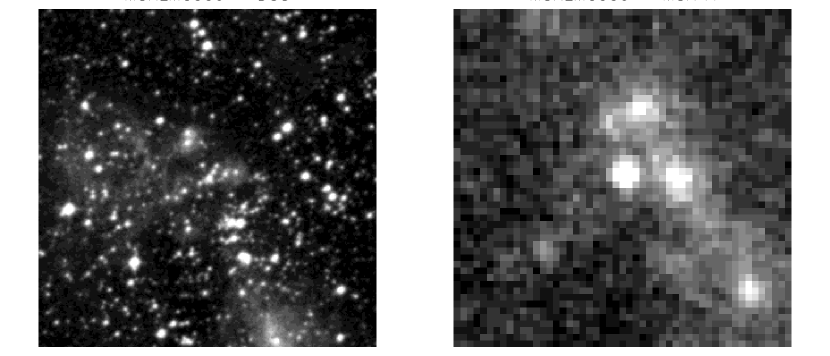
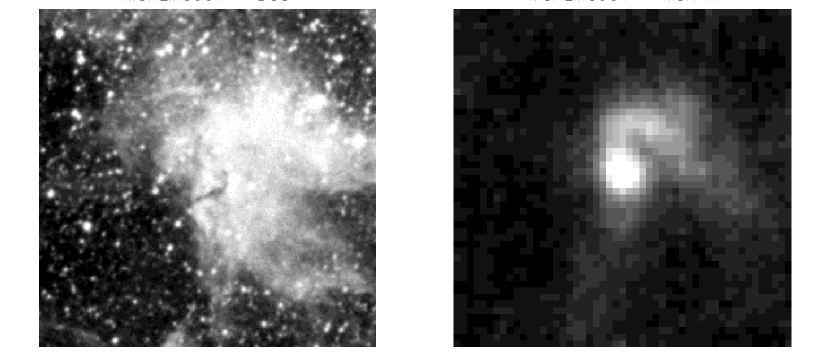
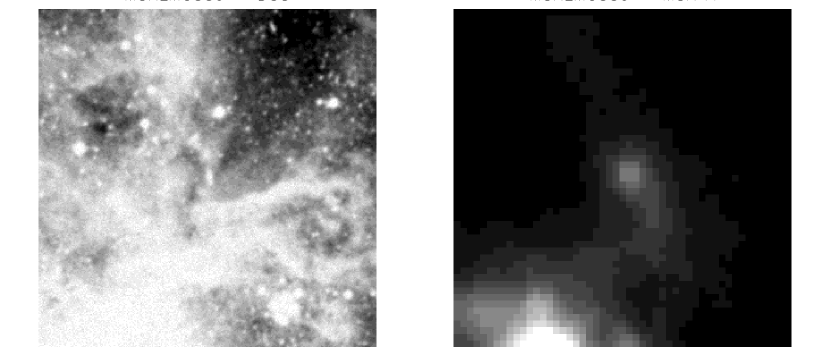
Examination of the optical (Digital Sky Survey) and IR (MSX A band) images reveals widespread nebulosity around these objects, suggesting they are the bright, compact cores of H II regions associated with massive star formation regions, rather than PNe. This is shown in Figure 5. The MSX 8.3 µm images in particular probe the dust and reveal extended nebulous emission, probably dominated by PAH’s. Several of the DSS images also show diffuse emission, possibly dominated by H, while, in contrast, the 2MASS NIR images, which we do not display, generally show only the bright point sources.
The spectra of the red, PAH-dominated objects match KSPW subgroup 5UE (Fig. 6), and show strong atomic fine-structure lines and PAH features. Galactic objects in this class are mostly young objects. In addition, these IRS spectra are lacking many of the high-ionization narrow emission lines common in Galactic PNe (Kraemer et al., 2002) and LMC PNe (Bernard-Salas et al., 2004), such as [Ne V] 24.3 µm and [O IV] 25.9 µm, as well as [Ne VI] 7.65 µm. This is shown in Figure 6. The IRS spectra of the PAH-dominated objects show strong [S III] emission peaks at 18.7 and 33.5 µm and [Ne II] 12.8 µm, emission lines found in both PNe and H II regions (Giveon et al., 2002). The similarity of the continuum shapes of the PN and H II region in Figure 6 suggests that these types of objects will have similar mid-IR (5 – 35 µm) colors and so will be difficult to distinguish photometrically in this wavelength range.
The IRS spectra provide further evidence that the PAH-dominated sources are extended H II regions and not PNe. The discontinuity seen at 14 µm between the spectra formed by the short and long wavelength modules (see Fig. 2c) is attributed to the extended nature of these sources (a similar phenomenon also affects certain ISO spectra of extended sources; see, e.g., Lamers et al. 1996). This “jump” indicates that the spatial extents of the PAH-dominated sources are greater than the width of the SL slit (3.6″), which is smaller than the LL slit (10.5″). A spatial extent of 5″ at 50.1 kpc corresponds to a physical size of 25000 AU (1.2 pc), confirming that these sources are unlikely to be PNe. The red, emission-line sources also appear extended in 2-D spectral images and this is confirmed by fitting Gaussian functions along the spectrum of each source and comparing the FWHM to a similar fit to one of the O-rich point sources (MSX LMC 1150).
In summary, we find that all of the program objects selected as PNe based on their NIR/MSX colors are, in fact, dusty H II regions associated with luminous young O/B stars. Thus the color distinction between these two groups made by EVP01 is not supported. This in fact confirms their caveat that many of their objects classified as PN may be H II regions with enhanced reddening. Revised criteria will need to be developed to distinguish PN from H II regions photometrically, and these will probably need to rely upon wavelengths other than just the near- and mid-IR.
4.4 INFRARED COLOR-COLOR AND COLOR-MAGNITUDE CLASSIFICATIONS OF LMC SOURCES
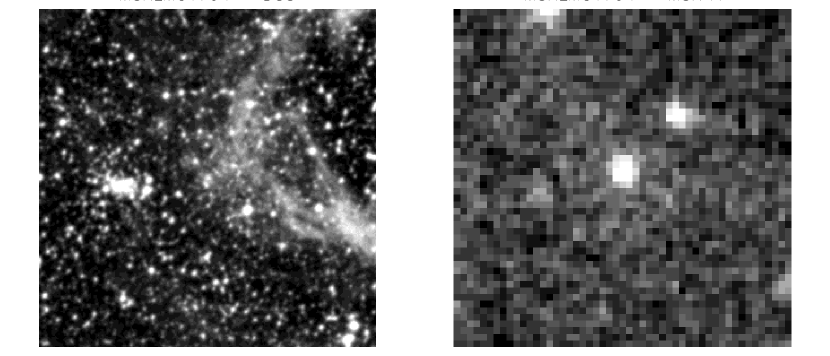
Figure 7 shows IR color-color diagrams for the stars in this study, based upon the 2MASS and MSX photometry. The stars of most of the various IRS spectral types separate quite cleanly into different regions of this diagram, confirming that IR color criteria can be used to classify the spectral types, although this may not be the case for distinguishing PNe and H II regions, and PNe may occupy the region between the AGB stars and the H II regions and make the separation less clean. As previously noted, however, our IRS spectral classifications frequently differ from the original EVP01 classes assigned to these objects. EVP01 indeed mention that the O-rich and C-rich AGB star classifications are rather uncertain due to the similar regions in color space that these objects occupy. Other authors have also shown, both observationally (van Loon et al., 1998; Zijlstra et al., 2006) and theoretically (Groenewegen, 2006), the difficulty of distinguishing O-rich and C-rich evolved stars based on their IR colors. We nevertheless propose modified IR color criteria, based on the locations of objects in Figure 7, subject to the uncertainty due to our sample incompleteness. The isolated locations of the two OH/IR stars in our sample in the color-color diagrams suggests that other EVP01 objects with 2MASS/MSX colors K-A4 and J-K2, but outside the C-rich AGB area, are candidate OH/IR stars. The four objects we classify as O-rich AGB stars lie fairly close to each other on the color-color and color-magnitude diagrams, indicating that objects with K-A = 1 – 3 and J-K = 2 – 3 are candidate O-rich AGB stars in the LMC. Further observations are required to probe the borderline regions where classifications overlap or are uncertain and to identify where PNe in the LMC lie on these diagrams.
Color-magnitude diagrams are also extremely useful in discriminating between spectral types of stars (Figure 8). The Galactic and LMC objects separate clearly, with Galactic objects having brighter apparent magnitudes due to their relatively modest distances. The AGB star luminosity sequence is also evident, with the C-rich objects in the majority and the most IR-luminous AGB stars being O-rich. The most IR-luminous LMC objects in our sample are the RSGs and the lone OH/IR supergiant (MSX LMC 1182), the latter of which is redder due to the thick dust shell presumably surrounding this source. The lone OH/IR AGB star (MSX LMC 807) has a lower IR luminosity, comparable to the C-rich AGB stars. The H II regions, which have J-band magnitudes similar to, but K magnitudes fainter than, the C-rich AGB stars (due to their bluer J-K colors; Fig. 7), display the reddest K-A colors (Fig. 7).
One of the primary goals of this program was to determine reliable relations between Spitzer IRAC and MIPS photometry and IRS spectral types for compact, infrared-luminous objects, especially evolved stars. This will enable the classification and study of evolved stars in other nearby galaxies using Spitzer photometry. Therefore, we also derived IRAC and MIPS flux densities for the objects using the IRS spectra and the spectral response functions of the IRAC 5.8 and 8.0 µm bands and the MIPS 24 µm band. Figure 9 shows the simulated IRAC/MIPS colors of our stars as derived from their IRS spectra. Also plotted on Figure 9 are Galactic stars in each spectral type, as well as PNe, for comparison. The three Galactic PNe plotted overlap with the H II regions and appear to fill the gap between the evolved stars and H II regions. Clearly, observations of LMC PNe are required to determine whether the proposed photometric classifications of evolved stars and H II regions are “contaminated” by PNe. The comparison objects were selected at random from the database of Kraemer et al. (2002) — subject to the constraint that the ISO spectrum had reasonable signal-to-noise ratio — and the synthetic IRAC and MIPS colors were derived from the ISO spectra. The Galactic objects fall in the same regions of the diagram as the LMC stars, indicating that the IRAC/MIPS color-color diagrams are not very sensitive to metallicity. Therefore these diagnostics can be applied to external galaxies without being adversely affected by metallicity differences, at least in the range 0.5 – 1 Z⊙. It is possible to construct a large number of color-color diagrams using the observed 2MASS/MSX photometry and synthetic Spitzer IRAC/MIPS colors. In Figure 10 we present two such color-color diagrams that appear to show the best separation of the object types. Based on these two diagrams, we propose color criteria to classify luminous 8 µm sources in external galaxies (shown as boxes in Fig. 10 and listed in Table 3). Figure 11 shows color-magnitude diagrams derived solely from the synthetic Spitzer flux densities of our sample objects. The figure indicates that such IRAC/MIPS color-magnitude diagrams represent an effective means to distinguish between evolved stars and H II regions in external galaxies, and should easily identify the most luminous, rapidly mass-losing stars (i.e., OH/IR supergiants) in such galaxies.
IR colors may also be useful to infer the luminosity of evolved stars. Using the measured luminosities of the C-rich AGB stars and the RSGs, for which we have a sufficiently large number of objects, we investigated the relation between the luminosity and the NIR (K-band) magnitude. We defined a quasi-“bolometric correction” to be the ratio of the bolometric luminosity to the K-band flux density. For the C-rich AGB stars, this ratio shows a clear trend with the K-A color (Figure 12). This trend can be fitted with an exponential function, of the form , where is the bolometric (IR) luminosity in units of , is the 2MASS K-band flux density in Jy, and (K-A) is the 2 – 8 µm color in magnitudes, derived from the 2MASS and MSX K and A magnitudes. The best fit parameters are , , and . Using this fit to the points shown in Figure 12, the bolometric correction for a source of a given K-A color can be estimated and hence the luminosity derived from the K-band magnitude. The largest error in the luminosity predicted in this way is less than a factor of 2, with most of predicted luminosities within 20% of the measured luminosity.
For the RSGs, there is a unique value of the “bolometric correction” for all K magnitudes (Figure 13). The mean value for all sources is L⊙/Jy. Thus the luminosities of RSGs can be predicted from their K magnitudes with an uncertainty of less than 15%.
These results are potentially very useful in the study of Galactic carbon stars and RSGs, assuming that metallicity does not affect the bolometric correction. The bolometric corrections derived here will enable estimates of luminosities, and hence distances, of stars to be made simply from their IR colors and fluxes.
4.5 IMPLICATIONS FOR LATE STAGES OF STELLAR EVOLUTION
The predominance of C-rich stellar envelopes among the lower-luminosity members of our sample, and a relatively sharp dividing line between C-rich and O-rich infrared-luminous, evolved stars, is apparent in Table 2 and Fig. 4. These results suggest constraints on models of the processes of nuclear burning and dredge-up in intermediate- to high-mass stars and, at the same time, may indicate the importance of the metallicity of the star-forming environment on the ultimate evolutionary endpoints of such stars.
We caution that our IR-luminous LMC sample was selected based on a classification scheme that has proven somewhat unreliable, especially with regard to the distinctions between O-rich and C-rich AGB stars and between PNe and H II regions. This sample therefore may not well represent the IR-luminous, evolved stellar population of the LMC. The flux limit imposed may also have biased the sample against O-rich AGB stars. Nevertheless, the fact that we find % of the AGB stars in our sample are C-rich argues that the low metallicity of the LMC serves to facilitiate carbon star formation, due to the relative ease of inverting the C/O ratio at the stellar surface. At the same time, the apparent upper cutoff in the luminosity of IR-luminous carbon stars in the LMC, L⊙ (Table 2), implies an upper limit of 3.7 M⊙ for the initial mass of carbon star progenitors in the LMC (Marigo et al., 1999), though we note that this depends on assumptions about the mass loss, dredge-up efficiency and envelope burning. The apparent presence of such a carbon star luminosity cutoff, and the fact that the only three AGB stars brighter than this are O-rich, suggests that “hot bottom burning” (see Herwig 2005 and references therein) inhibits carbon star formation in the LMC for initial masses larger than 3.7 M⊙. Furthermore, the fact that all RSGs in the sample are O-rich suggests that the He-burning phase for such massive ( M⊙) stars is short, that the onset of C burning in such stars is rapid, and/or that the envelopes of such stars are sufficiently massive that it is difficult to invert the C/O ratio even given low initial metallicity.
We also note that, for the O-rich evolved stars, all except one (MSX LMC 1072) with LIR L⊙ have spectral shape 2SEc, while all except one (MSX LMC 815) with LIR L⊙ have spectral class 3SE. This transition coincides with the theoretical upper limit on AGB luminosity (Iben & Renzini, 1983), although luminous O-rich stars in a hot bottom burning phase may fall above the classical AGB limit (e.g., Blöcker & Schoenberner 1991) so the luminosity separation of AGB stars and RSGs is uncertain. The two exceptions are the ones closest to this dividing luminosity and it may be that variability is playing a role in confusing the classification of the two objects. Thus is it possible that the IRS spectral shape may provide clues to an object’s luminosity and progenitor mass, which would be particularly useful in cases where the luminosity is otherwise ambiguous.
We caution, however, that the present LMC IRS sample was selected to represent the types of object in the LMC but not their relative numbers, and so is not proportionally representative of the luminous mid-IR population of the LMC. For example, the most luminous sources listed in EVP01 are dominated by objects classified as “OH/IR stars” — which, our IRS survey demonstrates, are predominantly or perhaps exclusively C-rich AGB stars — whereas such objects constituted only % of the sample we have surveyed thus far with IRS. Thus, it is important to revisit the complete sample of luminous 8 m sources in the EVP01 lists, to reclassify these objects according to our revised criteria and, thereby, determine the distribution of envelope spectral types among these stars. This work will be the subject of a future paper. In addition, it is crucial to obtain additional IRS spectra of the most highly obscured yet luminous evolved stars. Such objects would likely appear as MSX and IRAS sources but not as 2MASS sources and, hence, are not necessarily well represented in the present sample. The OH/IR supergiant MSC LMC 1182, along with the two luminous C-rich AGB stars that are also IRAS sources (MSX LMC 1592 and 1652), offer indications of the types of sources we might expect to find among this group.
5 CONCLUSIONS
We have obtained Spitzer low-resolution spectra for a representative sample of 60 luminous 8 µm sources in the LMC. The sources observed were selected to include a variety of evolved, mass-losing stars, based on recently established 2MASS/MSX color criteria. The IRS spectra covered the wavelength range 5 – 35 µm, allowing determination of the envelope chemistry from detailed spectral features, particularly silicate emission features at 10 and 18 µm in O-rich objects and the SiC emission feature at 11 µm and C2H2 absorption feature at 13.7 µm in C-rich objects. We derived IR luminosities from the combined 2MASS and IRS spectral energy distributions of the objects and used these, along with the spectra, to classify the object types. We identify 16 C-rich AGB stars, 4 O-rich AGB stars, 21 RSGs, 11 H II regions, and 2 OH/IR stars (one supergiant and one AGB star). We also find 2 B supergiants that have peculiar IR spectra and 4 O-rich AGB stars that are in fact foreground Galactic Mira variables. We find the vast majority of the AGB stars, with IR luminosities L⊙, have C-rich envelopes, while the O-rich objects are almost all luminous RSGs with LIR. The predominance of C-rich stars along the AGB in the LMC is consistent with the hypothesis that C-rich stars form more easily than O-rich stars in lower metallicity environments. However, all C-rich AGB stars in our sample have LIR L⊙, while all four O-rich AGB stars have LIR L⊙, suggesting a relatively firm upper limit (3.7 M⊙) for the progenitor mass of LMC Carbon stars. The fact that all of the supergiant stars are O-rich, in turn, may indicate that massive supergiants do not have sufficiently long He-burning lifetimes to produce C-rich surfaces, and hence C-rich ejecta, despite the low metallicity of the LMC.
Comparison of the IRS classifications with the NIR color-based types (EVP01) revealed a number of inaccuracies in the 2MASS/MSX classification criteria. All of the sample objects with EVP01 type PN were reclassified, mostly as H II regions. Stars classified as OH/IR stars on the basis of NIR colors are mostly C-rich AGB stars, based on their IRS spectra. The O-rich AGB stars in the sample were reclassified as either RSGs or Galactic O AGB stars, based on their IRS spectra and luminosities. On the basis of these reclassifications, we have developed revised 2MASS/MSX color-color and color-magnitude classification criteria for LMC objects and, by extension, for luminous 8 µm sources in other external galaxies.
For the C-rich AGB and RSG stars, bolometric corrections to the stellar K-band flux densities were derived using the observed IR SEDs. For C-rich AGB stars, the bolometric corrections were found to depend on the K-A color, allowing the bolometric luminosity to be estimated from the K and A-band fluxes with a typical uncertainty of less than 20%, and at most a factor of 2. The bolometric corrections of the RSGs were found to be independent of IR color; for these objects the bolometric luminosities can be predicted from the K-band magnitude with an uncertainty of less than 15%. The derived bolometric corrections could prove very useful for determining the luminosities of carbon stars and RSGs in the Galaxy and other nearby galaxies.
Infrared (IRAC/MIPS/2MASS) colors were determined from the IRS spectra and 2MASS fluxes. We found that the spectral types separate well in various mid-IR color-color diagrams, indicating that Spitzer photometry can be an effective means to infer the spectral class of dust-enshrouded objects in external galaxies. We suggest diagnostics for classifying IR-luminous sources in the Galaxy and nearby galaxies, using Spitzer photometry. These colors may also prove useful in the analysis of Spitzer photometry of unresolved stellar populations in high-redshift galaxies.
References
- Aoki et al. (1999) Aoki, W., Tsuji, T., & Ohnaka, K. 1999, A&A, 350, 945
- Barlow (1997) Barlow, M. J. 1997, Ap&SS, 251, 15
- Barlow (1999) Barlow, M. J. 1999, in IAU Symp. 191: Asymptotic Giant Branch Stars, ed. T. Le Betre, A. Lèbre, & C. Waelkens (San Francisco: ASP), 353
- Barnbaum et al. (1991) Barnbaum, C., Zuckerman, B., & Kastner, J. H. 1991, AJ, 102, 289
- Bernard-Salas et al. (2004) Bernard-Salas, J., Houck, J. R., Morris, P. W., Sloan, G. C., Pottasch, S. R., & Barry, D. J. 2004, ApJS, 154, 271
- Blöcker & Schoenberner (1991) Blöcker, T., & Schoenberner, D. 1991, A&A, 244, L43
- Chen & Kwok (1993) Chen, P. S., & Kwok, S. 1993, ApJ, 416, 769
- Clayton (1996) Clayton, G. C. 1996, PASP, 108, 225
- Draine & Lee (1984) Draine, B. T., & Lee, H. M. 1984, ApJ, 285, 89
- Draine & Li (2001) Draine, B. T., & Li, A. 2001, ApJ, 551, 807
- Egan, Van Dyk & Price (2001) Egan, M. P., Van Dyk, S. D., & Price, S. D. 2001, AJ, 122, 1844
- Fazio et al. (2004) Fazio, G. G., et al. 2004, ApJS, 154, 10
- Forrest et al. (1981) Forrest, W. J., Houck, J. R., & McCarthy, J. F. 1981, ApJ, 248, 195
- Freedman et al. (2001) Freedman, W. L., et al. 2001, ApJ, 553, 47
- Giveon et al. (2002) Giveon, U., Sternberg, A., Lutz, D., Feuchtgruber, H., & Pauldrach, A. W. A. 2002, ApJ, 566, 880
- Goebel & Moseley (1985) Goebel, J. H., & Moseley, S. H. 1985, ApJ, 290, L35
- Groenewegen (2006) Groenewegen, M. A. T. 2006, A&A, 448, 181
- Groenewegen (1999) Groenewegen, M. A. T. 1999, in IAU Symp. 191: Asymptotic Giant Branch Stars, ed. T. Le Betre, A. Lèbre, & C. Waelkens (San Francisco: ASP), 535
- Groenewegen & Blommaert (1998) Groenewegen, M. A. T., & Blommaert, J. A. D. L. 1998, A&A, 332, 25
- Groenewegen et al. (1995) Groenewegen, M. A. T., Smith, C. H., Wood, P. R., Omont, A., & Fujiyoshi, T. 1995, ApJ, 449, L119
- Herwig (2005) Herwig, F. 2005, ARA&A, 43, 435
- Higdon et al. (2004) Higdon, S. J. U. et al. 2004, PASP, 116, 975
- Hony et al. (2002) Hony, S., Waters, L. B. F. M., & Tielens, A. G. G. M. 2002, A&A, 390, 533
- Houck et al. (2004) Houck, J. R., et al. 2004, ApJS, 154, 18
- Hrivnak et al. (2000) Hrivnak, B. J., Volk, K., & Kwok, S. 2000, ApJ, 535, 275
- Iben & Renzini (1983) Iben, I., & Renzini, A. 1983, ARA&A, 21, 271
- Jura (1988) Jura, M. 1988, ApJS, 66, 33
- Jura & Kleinmann (1989) Jura, M., & Kleinmann, S. G. 1989, ApJ, 341, 359
- Kastner et al. (2006) Kastner, J. H., Buchanan, C. L., Sargent, B., & Forrest, W. J. 2006, ApJ, 638, L29
- Kastner et al. (1993) Kastner, J. H., Forveille, T., Zuckerman, B., & Omont, A. 1993, A&A, 275, 163
- Kastner & Weintraub (1998) Kastner, J. H., & Weintraub, D. A. 1998, AJ, 115, 1592
- Kraemer et al. (2002) Kraemer, K. E., Sloan, G. C., Price, S. D., & Walker, H. J. 2002, ApJS, 140, 389
- Kraemer et al. (2005) Kraemer, K. E., Sloan, G. C., Wood, P. R., Price, S. D., & Egan, M. P. 2005, ApJ, 631, L147
- Kwok, Volk, & Bidelman (1997) Kwok, S., Volk, M, & Bidelman, W.P, 1997, ApJS, 112, 557
- Lamers et al. (1996) Lamers, H. J. G. L. M., et al. 1996, A&A, 315, L225
- Le Bertre et al. (2001) Le Bertre, T., Matsuura, M., Winters, J. M., Murakami, H., Yamamura, I., Freund, M., & Tanaka, M. 2001, A&A, 376, 997
- Li & Draine (2001) Li, A., & Draine, B. T. 2001, ApJ, 554, 778
- Loup et al. (1997) Loup, C., Zijlstra, A. A., Waters, L. B. F. M., & Groenewegen, M. A. T. 1997, A&AS, 125, 419
- Marigo et al. (1999) Marigo, P., Girardi, L., & Bressan, A. 1999, A&A, 344, 123
- Olnon et al. (1986) Olnon, F. M., et al. 1986, A&AS, 65, 607
- Ramos-Larios & Phillips (2005) Ramos-Larios, G., & Phillips, J. P. 2005, MNRAS, 357, 732
- Rieke et al. (2004) Rieke, G. H., et al. 2004, ApJS, 154, 25
- Roche et al. (1993) Roche, P. F., Aitken, D. K., & Smith, C. H. 1993, MNRAS, 262, 301
- Schwering (1989) Schwering, P. B. W. 1989, A&AS, 79, 105
- Sloan et al. (2003) Sloan, G. C., Kraemer, K. E., Goebel, J. H., & Price, S. D. 2003, ApJ, 594, 483
- Sloan et al. (1998) Sloan, G. C., Little-Marenin, I. R., & Price, S. D. 1998, AJ, 115, 809
- Trams et al. (1999) Trams, N. R., et al. 1999, A&A, 346, 843
- van Loon et al. (1998) van Loon, J. T., et al. 1998, A&A, 329, 169
- van Loon et al. (1997) van Loon, J. T., Zijlstra, A. A., Whitelock, P. A., Waters, L. B. F. M., Loup, C., & Trams, N. R. 1997, A&A, 325, 585
- van Winckel (2003) van Winckel, H. 2003, ARA&A, 41, 391
- Volk & Cohen (1989) Volk, K. & Cohen, M. 1989, AJ, 98, 931
- Volk et al. (2002) Volk, K., Kwok, S., Hrivnak, B. J., & Szczerba, R. 2002, ApJ, 567, 412
- Volk et al. (1991) Volk, K., Kwok, S., Stencil, R., & Brugel, E. 1991, ApJS, 77, 607
- Wainscoat et al. (1992) Wainscoat, R. J., Cohen, M., Volk, K., Walker, H. J., & Schwartz, D. E. 1992, ApJS, 83, 111
- Waters et al. (1999) Waters, L. B. F. M., et al. 1999, ESA SP-427: The Universe as Seen by ISO, 219
- Waters & Molster (1999) Waters, L. B. F. M., & Molster, F. G. 1999, in IAU Symp. 191: Asymptotic Giant Branch Stars, ed. T. Le Betre, A. Lèbre, & C. Waelkens (San Francisco: ASP), 209
- Werner et al. (2004) Werner, M. W., et al. 2004, ApJS, 154, 1
- Whitelock (1985) Whitelock, P. A. 1985, MNRAS, 213, 59
- Whitelock et al. (1994) Whitelock, P., Menzies, J., Feast, M., Marang, F., Carter, B., Roberts, G., Catchpole, R., & Chapman, J. 1994, MNRAS, 267, 711
- Wood et al. (1986) Wood, P. R., Bessell, M. S., & Whiteoak, J. B. 1986, ApJ, 306, L81
- Zijlstra et al. (1996) Zijlstra, A. A., Loup, C., Waters, L. B. F. M., Whitelock, P. A., van Loon, J. T., & Guglielmo, F. 1996, MNRAS, 279, 32
- Zijlstra et al. (2006) Zijlstra, A. A., et al. 2006, ArXiv Astrophysics e-prints, arXiv:astro-ph/0602531
| MSX | RAaaSource positions are from the 2MASS catalog. | DecaaSource positions are from the 2MASS catalog. | J | H | K | A | EVP01 | SIMBAD | 2MASS | IRAS | Other |
|---|---|---|---|---|---|---|---|---|---|---|---|
| LMC | J2000 | J2000 | (mag) | (mag) | (mag) | (mag) | type | typebbSource types and names from SIMBAD, simbad.u-strasbg.fr/sim-fid.pl. Spectral types are indicated where known, blank indicates that the object is a star of unknown spectral type. V* indicates a variable star, and “Em.” indicates emission. | Name | Name | NamebbSource types and names from SIMBAD, simbad.u-strasbg.fr/sim-fid.pl. Spectral types are indicated where known, blank indicates that the object is a star of unknown spectral type. V* indicates a variable star, and “Em.” indicates emission. |
| No. | |||||||||||
| 22 | 05 04 47.14 | -66 40 30.4 | 14.18 | 13.75 | 12.96 | 6.06 | PN | IR source | J05044715-6640307 | 05047-6644 | |
| 87 | 05 10 19.63 | -69 49 51.2 | 14.60 | 12.73 | 11.07 | 6.42 | OH/IR | J05101962-6949514 | |||
| 95 | 05 10 00.00 | -69 56 09.6 | 13.39 | 11.49 | 10.01 | 6.27 | C IR | J05095999-6956097 | |||
| 141 | 05 05 33.48 | -70 33 46.8 | 8.84 | 7.97 | 7.63 | 6.36 | RSG | M | J05053350-7033469 | [L72] LH 24- 15 | |
| 217 | 05 13 24.67 | -69 10 48.4 | 14.69 | 14.21 | 13.23 | 5.92 | PN | IR source | J05132465-6910480 | 05137-6914 | |
| 218 | 05 13 16.39 | -68 44 10.0 | 13.39 | 11.47 | 9.93 | 6.15 | OH/IR | J05131640-6844099 | |||
| 220 | 05 12 32.06 | -69 15 40.7 | 12.91 | 11.15 | 9.78 | 6.21 | C IR | V* | J05123206-6915404 | DCMC J051232.11-691540.5 | |
| 222 | 05 13 42.48 | -69 35 21.8 | 14.74 | 15.14 | 13.95 | 6.44 | PN | J05134244-6935219 | |||
| 264 | 05 14 49.75 | -67 27 19.8 | 8.62 | 7.75 | 7.39 | 5.85 | RSG | M3Iab: V* | J05144972-6727197 | 05148-6730 | HV 916 |
| 412 | 05 15 41.28 | -73 47 13.9 | 6.59 | 5.71 | 5.26 | 4.57 | O AGB | Me V* | J05154126-7347137 | 05169-7350 | RS Men |
| 438 | 05 25 19.51 | -71 04 02.6 | 16.06 | 13.23 | 10.96 | 6.09 | OH/IR | IR source | J05251951-7104027 | LI-LMC 1028 | |
| 529 | 05 23 43.63 | -65 41 59.6 | 9.00 | 8.10 | 7.74 | 6.24 | RSG | M3/M4 V* | J05234361-6541596 | 05235-6544 | HV 12793 |
| 549 | 05 26 11.38 | -66 12 10.8 | 9.32 | 8.26 | 7.71 | 6.04 | O AGB | Star in cluster | J05261135-6612111 | NGC 1948 WBT 54 | |
| 559 | 05 25 49.25 | -66 15 08.3 | 14.38 | 13.58 | 12.49 | 5.98 | PN | UV source | J05254923-6615087 | [HCB95] LH 52 4978 | |
| 587 | 05 31 04.15 | -69 19 03.3 | 9.12 | 8.12 | 7.65 | 5.64 | O AGB | J05310418-6919030 | |||
| 589 | 05 26 34.80 | -68 51 40.0 | 8.50 | 7.65 | 7.29 | 5.90 | RSG | M2Iab:+… | J05263479-6851400 | [GMP94] 301 | |
| 593 | 05 28 28.87 | -68 07 08.0 | 8.48 | 7.66 | 7.34 | 5.95 | RSG | M0Ia V* | J05282886-6807078 | HV 2561 | |
| 597 | 05 29 42.24 | -68 57 17.3 | 8.00 | 7.24 | 6.96 | 6.21 | RSG | M1Ia | J05294221-6857173 | 05300-6859 | |
| 642 | 05 28 48.14 | -71 02 28.7 | 11.31 | 9.70 | 8.64 | 6.30 | C IR | M8 | J05284817-7102289 | 05294-7104 | |
| 764 | 05 32 52.68 | -69 46 22.8 | 13.92 | 13.76 | 12.84 | 4.93 | PN | IR source | J05325272-6946226 | 05333-6948 | |
| 769 | 05 31 42.41 | -68 34 53.7 | 15.08 | 14.55 | 13.45 | 5.91 | PN | J05314242-6834539 | |||
| 773 | 05 35 41.14 | -69 11 59.6 | 9.58 | 8.55 | 8.06 | 6.07 | O AGB | J05354110-6911596 | |||
| 775 | 05 32 56.18 | -68 12 49.0 | 13.24 | 11.32 | 9.85 | 6.44 | C IR | J05325618-6812487 | |||
| 807 | 05 32 37.15 | -67 06 56.5 | 15.50 | 13.63 | 11.93 | 5.66 | OH/IR | J05323716-6706564 | |||
| 810 | 05 30 20.66 | -66 53 01.7 | 8.78 | 7.92 | 7.72 | 6.21 | RSG | Double star | J05302067-6653018 | CCDM J05303-6653B | |
| 815 | 05 35 14.09 | -67 43 55.6 | 9.49 | 8.68 | 8.14 | 6.37 | O AGB | M4 V* | J05351409-6743558 | HV 1001 | |
| 836 | 05 32 31.99 | -66 27 15.1 | 15.94 | 15.01 | 14.00 | 5.85 | PN | IR source | J05323195-6627154 | 05325-6629 | |
| 839 | 05 31 36.82 | -66 30 07.9 | 8.44 | 7.66 | 7.36 | 6.27 | RSG | J05313681-6630076 | |||
| 870 | 05 35 28.32 | -66 56 02.4 | 8.45 | 7.65 | 7.30 | 6.20 | RSG | M3Iab: | J05352832-6656024 | 05354-6657 | Dachs LMC 2-16 |
| 889 | 05 38 31.63 | -69 02 14.6 | 14.53 | 13.80 | 12.68 | 4.65 | PN | Molecular cloud | J05383167-6902146 | [JGB98] 30 Dor-06 | |
| 890 | 05 36 25.87 | -69 22 55.9 | 10.12 | 9.73 | 8.79 | 4.75 | PN | B:e Em. object | J05362586-6922558 | 05368-6924 | HD 37974 |
| 894 | 05 38 44.71 | -69 24 39.6 | 13.91 | 14.00 | 12.85 | 6.26 | PN | Em. object | J05384470-6924395 | LHA 120-N 158B | |
| 897 | 05 40 43.73 | -69 21 57.9 | 8.87 | 7.96 | 7.49 | 6.29 | O AGB | J05404375-6921581 | |||
| 934 | 05 39 15.86 | -69 30 38.5 | 14.84 | 14.42 | 13.48 | 4.95 | PN | Molecular cloud | J05391587-6930384 | [JGB98] N158-2 | |
| 939 | 05 40 48.48 | -69 33 36.0 | 9.24 | 8.26 | 7.75 | 5.71 | O AGB | Open cluster | J05404850-6933360 | [HS66] 385 | |
| 943 | 05 41 10.63 | -69 38 03.8 | 8.80 | 8.00 | 7.66 | 6.42 | RSG | M0 V* | J05411066-6938040 | ||
| 1007ccAdditional IRAS source included in sample (see §2). | 04 28 30.17 | -69 30 50.0 | 16.29 | 13.83 | 11.87 | 6.66 | OH/IR | 04286-6937 | |||
| 1072 | 04 40 28.51 | -69 55 13.8 | 10.16 | 8.92 | 8.16 | 5.35 | PN | M7.5 | J04402848-6955135 | 04407-7000 | |
| 1120 | 04 47 16.08 | -68 24 25.5 | 14.46 | 12.30 | 10.66 | 6.35 | OH/IR | IR source | J04471609-6824256 | LI-LMC 31 | |
| 1132 | 04 49 22.46 | -69 24 34.6 | 9.11 | 8.18 | 7.78 | 6.17 | O AGB | M V* | J04492246-6924344 | HV 2236 | |
| 1150 | 04 39 23.66 | -73 11 02.8 | 6.92 | 5.99 | 5.52 | 4.70 | O AGB | J04392369-7311028 | |||
| 1182ccAdditional IRAS source included in sample (see §2). | 04 55 10.49 | -68 20 29.8 | 9.25 | 7.74 | 6.85 | 2.43 | M7.5 | J04551048-6820298 | 04553-6825 | ||
| 1189 | 04 55 03.07 | -69 29 12.8 | 8.67 | 7.68 | 7.20 | 5.32 | O AGB | IR source M2 | J04550307-6929127 | 04553-6933 | |
| 1204 | 04 55 16.03 | -69 19 12.0 | 8.55 | 7.74 | 7.37 | 6.35 | RSG | Em.-line star M | J04551604-6919120 | [BE74] 164 | |
| 1280 | 05 00 19.03 | -67 07 58.1 | 12.03 | 10.44 | 9.28 | 6.44 | C IR | M9 | J05001899-6707580 | 05003-6712 | |
| 1282 | 05 01 0.86 | -67 35 23.6 | 17.24 | 14.51 | 12.18 | 6.43 | OH/IR | J05010087-6735236 | |||
| 1306 | 04 52 58.80 | -68 02 56.8 | 15.85 | 15.45 | 14.15 | 6.34 | PN | Em. object | J04525878-6802569 | LHA 120-S 5 | |
| 1326 | 04 56 47.04 | -69 50 24.7 | 10.05 | 9.65 | 8.84 | 4.85 | PN | Em.-line star B8Ia | J04564705-6950247 | 04571-6954 | HD 268835 |
| 1328 | 04 57 43.30 | -70 08 50.3 | 8.42 | 7.62 | 7.32 | 5.60 | RSG | M4 V* | J04574331-7008503 | 04581-7013 | HV 2255 |
| 1330 | 04 55 21.65 | -69 47 16.8 | 8.87 | 7.95 | 7.61 | 6.03 | RSG | M | J04552165-6947167 | [M2002] LMC 24410 | |
| 1384 | 05 43 36.05 | -70 10 35.0 | 16.37 | 13.53 | 11.44 | 6.37 | OH/IR | V* | J05433602-7010351 | ||
| 1400 | 05 40 20.62 | -66 14 44.2 | 16.60 | 13.91 | 11.77 | 6.02 | OH/IR | J05402057-6614442 | |||
| 1429 | 05 44 13.70 | -66 16 44.8 | 9.01 | 7.92 | 7.48 | 6.48 | O AGB | M0.5 V* | J05441373-6616445 | HV 2834 | |
| 1488 | 05 50 6.72 | -71 46 03.0 | 15.14 | 12.91 | 11.04 | 6.50 | OH/IR | IR source | J05500676-7146026 | 05508-7146 | |
| 1492 | 05 49 8.83 | -71 32 07.1 | 12.29 | 10.66 | 9.49 | 6.46 | C IR | J05490888-7132069 | |||
| 1524 | 05 55 21.05 | -70 00 03.2 | 11.97 | 10.32 | 9.11 | 6.04 | C IR | J05552103-7000030 | 05558-7000 | ||
| 1592ccAdditional IRAS source included in sample (see §2). | 05 56 38.76 | -67 53 34.4 | 5.81 | Carbon star | 05568-6753 | ||||||
| 1652 | 06 02 31.03 | -67 12 46.8 | 17.85 | 15.64 | 12.99 | 6.14 | OH/IR | Carbon star | J06023105-6712469 | 06025-6712 | |
| 1677 | 06 01 27.82 | -65 05 23.3 | 6.81 | 5.88 | 5.15 | 3.05 | O AGB | IR source | J06012780-6505231 | 06013-6505 | |
| 1686 | 06 06 47.81 | -66 48 12.6 | 6.33 | 5.43 | 4.84 | 3.58 | C AGB | J06064779-6648125 | |||
| 1794 | 05 40 43.99 | -69 25 54.5 | 15.89 | 15.36 | 14.23 | 6.44 | PN | J05404401-6925546 | |||
| 04374-6831ccAdditional IRAS source included in sample (see §2).,ddThis object was not detected by MSX, so is designated by its IRAS name. IRAS flux densities for this object are (12 µm): 0.199 Jy; (25 µm): 0.25 Jy. | 04 37 22.73 | -68 25 03.3 | 04374-6831 |
| MSX | Envelope | IRS | LIR | KSPW | EVP01 |
|---|---|---|---|---|---|
| Name | chemistry | type | L⊙ | class | type |
| [1] | [2] | [3] | [4] | [5] | [6] |
| 1280aaFor these objects, local sky subtraction was used.,bbOnly SL module spectra were obtained for this object. The luminosity was calculated using MSX LMC 1189 as a template for the spectral shape, so is highly uncertain. | O-rich | O AGB | 1.7 : | 3SE | C IR |
| 1524 | O-rich | O AGB | 4.1 | 3SE | C IR |
| 642 | O-rich | O AGB | 4.2 | 3SE | C IR |
| 1072 | O-rich | O AGB | 6.5 | 3SE | PN |
| 815 | O-rich | RSG | 5.5 | 2SEc | O AGB |
| 1132 | O-rich | RSG | 7.7 | 2SEc | O AGB |
| 549 | O-rich | RSG | 7.9 | 2SEc | O AGB |
| 529 | O-rich | RSG | 7.9 | 2SEc | RSG |
| 939aaFor these objects, local sky subtraction was used. | O-rich | RSG | 8.1 | 2SEc | O AGB |
| 587 | O-rich | RSG | 8.5 | 2SEc | O AGB |
| 943 | O-rich | RSG | 8.7 | 2SEc | RSG |
| 1429 | O-rich | RSG | 9.1 | 2SEc | O AGB |
| 141 | O-rich | RSG | 9.2 | 2SEc | RSG |
| 1330 | O-rich | RSG | 9.3 | 2SEc | RSG |
| 897aaFor these objects, local sky subtraction was used. | O-rich | RSG | 9.4 | 2SEc | O AGB |
| 810ccThis object exhibits extended emission due to a nearby or companion object (resolved in SL but not LL spectral images). Slit losses result in a large flux jump between the SL and LL modules, so the SL spectra were scaled by a factor of 1.86 to match the LL2 spectrum; the luminosity is therefore very uncertain. | O-rich | RSG | 9.4 : | 2SEc | RSG |
| 1204 | O-rich | RSG | 1.0 | 2SEc | RSG |
| 264 | O-rich | RSG | 1.1 | 2SEc | RSG |
| 839 | O-rich | RSG | 1.2 | 2SEc | RSG |
| 593 | O-rich | RSG | 1.2 | 2SEc | RSG |
| 870 | O-rich | RSG | 1.3 | 2SEc | RSG |
| 589aaFor these objects, local sky subtraction was used. | O-rich | RSG | 1.3 | 2SEc | RSG |
| 1328 | O-rich | RSG | 1.3 | 2SEc | RSG |
| 1189 | O-rich | RSG | 1.3 | 2SEc | O AGB |
| 597 | O-rich | RSG | 1.6 | 2SEc | RSG |
| 1150ddThe luminosities for these Milky Way O AGB stars were calculated using the following assumed distances: MSX LMC 1150 4.2 kpc, MSX LMC 1686 3.3 kpc, MSX LMC 412 4.6 kpc, and MSX LMC 1677 5.1 kpc. These distances were estimated using the K-band distance modulus with absolute K-band magnitudes derived using the color-period-luminosity relations for Mira variables (Whitelock et al., 1994). | O-rich | MW O AGB | 4.0 | 2SEa | O AGB |
| 1686ddThe luminosities for these Milky Way O AGB stars were calculated using the following assumed distances: MSX LMC 1150 4.2 kpc, MSX LMC 1686 3.3 kpc, MSX LMC 412 4.6 kpc, and MSX LMC 1677 5.1 kpc. These distances were estimated using the K-band distance modulus with absolute K-band magnitudes derived using the color-period-luminosity relations for Mira variables (Whitelock et al., 1994). | O-rich | MW O AGB | 4.6 | 2SEa | C AGB |
| 412ddThe luminosities for these Milky Way O AGB stars were calculated using the following assumed distances: MSX LMC 1150 4.2 kpc, MSX LMC 1686 3.3 kpc, MSX LMC 412 4.6 kpc, and MSX LMC 1677 5.1 kpc. These distances were estimated using the K-band distance modulus with absolute K-band magnitudes derived using the color-period-luminosity relations for Mira variables (Whitelock et al., 1994). | O-rich | MW O AGB | 6.0 | 2SEa | O AGB |
| 1677ddThe luminosities for these Milky Way O AGB stars were calculated using the following assumed distances: MSX LMC 1150 4.2 kpc, MSX LMC 1686 3.3 kpc, MSX LMC 412 4.6 kpc, and MSX LMC 1677 5.1 kpc. These distances were estimated using the K-band distance modulus with absolute K-band magnitudes derived using the color-period-luminosity relations for Mira variables (Whitelock et al., 1994). | O-rich | MW O AGB | 9.7 | 2SEc | O AGB |
| 807ffA second source fell partially in the slit for several modules and nod positions of this observation. The extraction aperture used for this object was defined manually, using a tapering column of the default SMART widths to ensure accurate flux calibration. | O-rich | OH/IR | 4.0 | 3SB | OH/IR |
| 1182 | O-rich | OH/IR SG | 4.7 | 5? | - |
| 1326eeThe luminosities for these two objects were taken from Kastner et al. (2006). LIR obtained from the flux density integrated over the wavelength range 2.2 – 35 µm only. | O-rich | Peculiar | 5.5 | 5? | PN |
| 890eeThe luminosities for these two objects were taken from Kastner et al. (2006). LIR obtained from the flux density integrated over the wavelength range 2.2 – 35 µm only. | O-rich | Peculiar | 7.1 | 5? | PN |
| 1384 | C-rich | C AGB | 5.8 | 3CE | OH/IR |
| 1400 | C-rich | C AGB | 7.1 | 3C? | OH/IR |
| 1007ggFor the SL1 module of this spectrum, only the second slit position was used in the final spectrum, as the flux density of the SL1 spectrum in the first nod position did not match the rest of the modules and nod positions. | C-rich | C AGB | 8.2 | 3CE | OH/IR |
| 04374-6831hhThis object was not detected by MSX, so is designated by its IRAS name. | C-rich | C AGB | 1.0 | 3CE | - |
| 1488 | C-rich | C AGB | 1.1 | 3CE | OH/IR |
| 438 | C-rich | C AGB | 1.1 | 3CE | OH/IR |
| 87 | C-rich | C AGB | 1.1 | 3CE | OH/IR |
| 1120 | C-rich | C AGB | 1.1 | 3CE | OH/IR |
| 1652 | C-rich | C AGB | 1.2 | 3CR | OH/IR |
| 218 | C-rich | C AGB | 1.3 | 3CE | OH/IR |
| 95 | C-rich | C AGB | 1.4 | 3CE | C IR |
| 1282 | C-rich | C AGB | 1.5 | 3CE | OH/IR |
| 220 | C-rich | C AGB | 1.6 | 3CE | C IR |
| 1592 | C-rich | C AGB | 1.6 | 3CR | - |
| 1492 | C-rich | C AGB | 1.9 | 3CE | C IR |
| 775 | C-rich | C AGB | 1.9 | C? | C IR |
| 1794 | PAH | Hii | 1.7 | 5UE | PN |
| 222 | PAH | Hii | 3.8 | 5UE | PN |
| 1306 | PAH | Hii | 4.3 | 5UE | PN |
| 894 | PAH | Hii | 5.6 | 5UE | PN |
| 22 | PAH | Hii | 6.8 | 5UE | PN |
| 836 | PAH | Hii | 7.7 | 5UE | PN |
| 217 | PAH | Hii | 8.1 | 5UE | PN |
| 559 | PAH | Hii | 2.0 | 5UE | PN |
| 934 | PAH | Hii | 2.5 | 5UE | PN |
| 764 | PAH | Hii | 2.7 | 5UE | PN |
| 889 | PAH | Hii | 4.0 | 5UE | PN |
| 769iiThese two objects were not observed due to peak-up failure. | PN | ||||
| 773iiThese two objects were not observed due to peak-up failure. | O AGB |
Note. — Columns: [1] MSX/IRAS name; [2] the dominant chemistry of the dust envelope, determined by the IR spectral features; [3] our classification of the likely type of object, based on the IRS spectral features, luminosity and all other available information; [4] the IR (1 – 100 µm) luminosity derived as described in §3.2. Uncertain luminosities are indicated by a colon; [5] the spectral class of the object in the scheme of Kraemer et al. (2002); [6] the type of the object determined from the NIR colors by EVP01.
| Class | Color-color diagnostics | |||
|---|---|---|---|---|
| H-[5.8] | [8.0]-[24] | K-[5.8] | H-K | |
| [1] | [2] | [3] | [4] | [5] |
| RSG | -2.5 – -1.0 | [ +3.0] – [ +4.5] | [] – [] | 0.2 – 0.6 |
| O AGBaaThese criteria are based on the colors of only four objects and thus are very uncertain. | -0.5 – 1.2 | 3.5 – 4.0 | -1.6 – 0.0 | 0.7 – 1.3 |
| MW O AGB | -2.3 – 0.0 | [ +2.2] – [ +2.7] | [] – [] | 0.4 – 0.75 |
| C AGB | 0.5 – 6.0 | [ +0.5] – [ +2.5] | [] – [] | 1.1 – 2.7 |
| H II | 2.0 – 4.5 | 4.5 – 8.0 | 0.2 –3.0 | 0.7 – 1.5 |
Note. — Columns: [1] Type of IR object; [2]-[3] Color diagnostics for classifying objects based on Spitzer and 2MASS colors.