Disc-Jet coupling in the LMXB 4U 1636–53 from INTEGRAL
††thanks: INTEGRAL is an ESA project with instruments
and science data centre funded by ESA member states
(especially the PI countries: Denmark, France, Germany, Italy, Switzerland, Spain),
Czech Republic and Poland, and with the participation of Russia and the USA.
observation
Abstract
We report on the spectral analysis results of the neutron star, atoll type, low mass X-ray Binary 4U 1636–53 observed by INTEGRAL and BeppoSAX satellites. Spectral behavior in three different epochs corresponding to three different spectral states has been deeply investigated. Two data set spectra show a continuum well described by one or two soft blackbody plus a Comptonized components with changes in the Comptonizing electrons and black body temperature and the accretion rates, which are typical of the spectral transitions from high to low state. In one occasion INTEGRAL spectrum shows, for first time in this source, a hard tail dominating the emission above 30 keV. The total spectrum is fitted as the sum of a Comptonized component similar to soft state and a power-law component (), indicating the presence of a non thermal electron distribution of velocities. In this case, a comparison with hard tails detected in soft states from neutron stars systems and some black hole binaries suggests that a similar mechanism could originate these components in both cases.
Subject headings:
accretion, accretion disks – gamma rays: observations – radiation mechanisms: non-thermal – stars: individual: 4U 1636–53 – stars: neutron – X-rays: binaries1. Introduction
4U 1636–53 is a neutron star low mass X-ray binary (LMXB) classified as a atoll source (Hasinger & van der Klis 1989), with an orbital period of 3.8 hr derived from the optical variability of its companion V801 Arae (Pedersen, van Paradijs & Lewin 1984) and at distance of 3.7–6.5 kpc (Fujimoto et al. 1988, Smale & Lochner 1992, Augusteijn et al. 1998).
While the X-ray burst properties and timing signatures have been analyzed extensively (see Jonker et al. 2005, Belloni et al. 2005 and references therein) the spectral characteristics have been studied only at low energy with Einstein , EXOSAT , Temna and ASCA . In general, the spectrum was acceptably fitted by a Comptonization model plus a black body component. A coronal temperature of 2.3-2.6 keV, an optical depth of 13, and a soft black body temperature of 0.55 keV were the best fit parameter for the Einstein data (Christian and Swank 1997). EXOSAT data reveal two different source intensity: for the maximum intensity the coronal temperature was keV and the optical depth , while for the minimum intensity the temperature was keV and the optical depth . White et al. (1988) found the coronal temperature to be 1.8 keV and the optical depth to be 16.7. A model consisting of a black body, a multi-color disk and a broad Fe line, was used by Asai et al. (1998) to fit the ASCA data, confirming previous Temna results (Waki et al. 1984). We report here a broad band spectral analysis performed on data from BeppoSAX and INTEGRAL satellites, which allowed us to better constrain the spectral parameters and to detect the presence of a high energy tail dominating the spectrum above keV. A similar feature has been observed in other LMXBs namely GX 17+2 (Di Salvo et al. 2000), GX 349+2 (Di Salvo et al. 2001), Sco X-1 (D’Amico et al. 2001), 4U 1608-522 (Zhang et al. 1996), XB 1254-690 (Iaria et al. 2001), Cir X-1 (Iaria et al. 2002) and 4U 0614+091 (Piraino et al. 1999).
2. Observations and Data Analysis
Table 1 summarizes the log of INTEGRAL and BeppoSAX observations of 4U 1636–53 .
BeppoSAX observed the source on three occasions: February and March 1998 and
February 2000.
LECS, MECS and PDS event files and spectra,
available from the ASI Scientific Data Center,
were generated by means of the Supervised Standard Science Analysis
Fiore et al. (1999).
Both LECS and MECS spectra were accumulated in circular regions
of 8’ radius.
The PDS spectra were obtained
with the background rejection method based on fixed rise time thresholds.
Publicly available matrices were used for all the instruments.
The cross-calibration constant
values were taken in agreement with the indications given in Fiore et al. 1999.
Fits are performed in the following energy band: 0.5–3.5 keV for LECS, 1.5–10.0
keV for MECS and 15–70 keV for PDS.
The analyzed INTEGRAL (Winkler et al. 2003) data set consists of all observations in which
4U 1636-53 was
within the high-energy detectors field of view.
Observations are organized into uninterrupted 2000 s long science pointing, windows
(scw):
light curves and spectra are extracted for each individual scw.
Wideband spectra (from 5 to 150 keV) of the source are obtained using data from the
two high-energy
instruments JEM-X (Lund et al., 2003) and IBIS (Ubertini et al., 2003).
Data were processed using the Off-line Scientific Analysis
(OSA version 5.1)
software released by the INTEGRAL Scientific Data Centre.
While IBIS provide a very large FOV (), JEM-X has
a narrower FOV (), thus providing only a partial overlap with the high-energy
detectors.
Data from the Fully Coded field of view only for both instrument have been used.
The angular resolution of IBIS instrument is 12 arcmin,
any source at a
distance larger than the instrument angular resolution do not contribute at all
to the observed source spectrum and flux (Ubertini et al. 2003)
due to the coded mask intrinsic characteristics.
3. Spectral Analysis Results
| BeppoSAX Journal | |||||||
|---|---|---|---|---|---|---|---|
| Start Date | Exposure time | Count s-1 | |||||
| LECS | MECS | PDS | LECS | MECS | PDS | ||
| ksec | ksec | ksec | [0.4-3 keV] | [1.5-10 keV] | [20-60 keV] | ||
| epoch (a) | 1998-02-24 | 13 | 39 | 17 | a | ||
| epoch (b) | 1998-03-01 | 6 | 14 | 7 | b | ||
| epoch (c) | 2000-02-15 | 12 | 37 | 19 | b | ||
| INTEGRAL Journal | |||||||
| Start Date | Exposure time | Count s-1 | |||||
| JEM-X | IBIS | JEM-X | IBIS | ||||
| ksec | ksec | [5-15keV] | [20-150 keV] | ||||
| epoch | 2003-03-04 | 36 | 594 | ||||
| epoch | 2003-03-04 | 16 | 117 | ||||
a MECS count rates refer to MECS2 and MECS3 units.
b MECS count rates refer to only MECS2 unit.
The whole
data set was carefully fitted with several physical models,
while trying to keep the number of free parameters as low as possible.
Each time a new component was added to the model, a F-test was performed. We
assumed that a F probability
larger than implies a significative improvement of the fit.
The uncertainties are at confidence level for one
parameter of interest ().
When spectra are from more than one detector,
we allow the relative normalization to be free with respect to the
MECS and IBIS data, for BeppoSAX and INTEGRAL respectively.
XSPEC v. 11.3.1. has been used.
Spectral behavior has been studied separately in three epochs consisting of the following data:
epoch: all three BeppoSAX observations available from February 1998 to February 2000. During these periods the source was always in a soft/high state.
epoch: JEM-X and IBIS data available from 52644 MJD to 53644 MJD with count rate in the 20–40 keV energy band. For the chosen period the source was in a hard/low state.
epoch: JEM-X and IBIS data available from 52644 MJD to 53644 MJD with count rate in the 20–40 keV energy band. This epoch does not corrspond to either the soft or the hard state and and here we call it peculiar state as will be explained in detail later on.
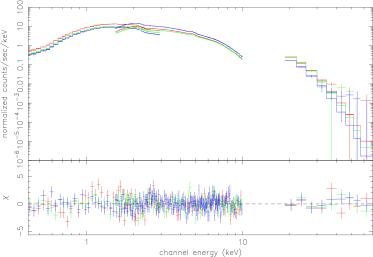
The most simple model which provides a good fit to each BeppoSAX spectrum in the energy band 0.5–70 keV consist of a thermal Comptonized component modeled in XSPEC by COMPTT (a spherical geometry was assumed) plus a soft component which we modeled with two temperature blackbody. The simplest model consisting of multicolor DISKBB (Makishima et al. 1986) plus a COMPTT component do not give a good fit, with a for each observations. The black body and thermal Comptonized component parameters were left free in order to determine the blackbody temperature , the electron temperature , the optical depth and seed photon temperature . Results from these fits are reported in Table 2. Figure 1 shows three BeppoSAX spectra and the residuals with respect to the corresponding best fits. The column density NH towards the source was left free and its value measured by the LECS and MECS instrument is always close to the galactic column density (, estimated from the 21 cm measurement of Dickey & Lockman 1990). The seed photon temperature is always = keV, and all parameters did not significantly vary from one observation to another.
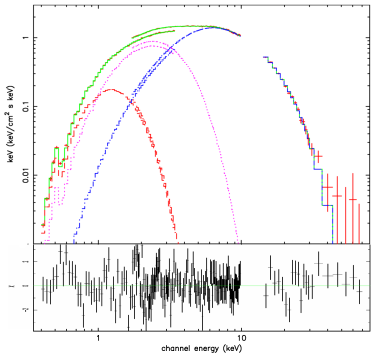
In order to achieve the highest signal to noise ratio we build the BeppoSAX average spectrum arranging all three observations. This procedure can, in principle, be risky since the source can change its spectrum from one observation to another. However in our case, the previous analysis showed no significant shape changes for the three observations. We then can take advantage of the high quality of the average spectrum up to about 70 keV. We fit the average BeppoSAX spectrum with the model used for the single observations. NH has been fixed to the value for the galactic column density. Spectral fit results are given in Table 3, the average spectrum is shown in Fig. 2.
| BeppoSAX spectra | ||||||||
| NH | TBB1 | TBB2 | Te | /d.o.f | ||||
| km | km | |||||||
| 190/124 | ||||||||
| 132/122 | ||||||||
| 133/122 | ||||||||
The source was in the soft/high state
with an un-absorbed luminosity of erg s-1, assuming a distance of 5.9 kpc (Cornelisse et al. 2003).
As in the case of the Einstein observation (Christian and Swank 1997),
thermal Comptonization of the
optically thick plasma corona with a quite low electron temperature
is dominating.
The most simple model which provides a good fit to the INTEGRAL hard state
consist of a thermal Comptonized component modeled in XSPEC by
COMPTT (Titarchuk 1994)
(a spherical geometry was assumed) plus
a soft component which we modeled by a single temperature blackbody.
Because of the very good low energy BeppoSAX coverage, we used
the average value of input soft photon temperature and column density
( and ) measured by the
BeppoSAX observations.
During this period, the source has a
luminosity of erg s-1,
lower than the one in the soft state,
in agreement with the usual ranking of the luminosity
in atoll sources
(e.g., Hasinger & van der Klis 1989; van der Klis 2000; Gierliński & Done 2002).
The electron temperature is now substantially higher than in the soft state,
keV, and the Comptonization component extends well above keV.
| BeppoSAX average high/soft state spectrum | ||||||||
|---|---|---|---|---|---|---|---|---|
| TBB1 | TBB2 | Te | /d.o.f | |||||
| km | km | |||||||
| 235/190 | ||||||||
| INTEGRAL low/hard state spectrum | ||||||||
| TBB2 | Te | /d.o.f | ||||||
| km | ||||||||
| 1.3 fixed | 57/59 | |||||||
| INTEGRAL peculiar state spectrum | ||||||||
| Te | /d.o.f | |||||||
| 1.3 fixed | 72/57 | |||||||
The same model was been applied to the
INTEGRAL data set but resulted in a poor fit with
a and clear residuals above 60 keV.
Adding a power law improves the fit significantly
(
becomes ).
A simple model with the single temperature blackbody and power law
do not fit our data ().
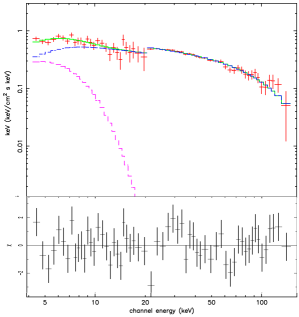
The disk component becomes negligible and it is not necessary to best fit the data.
Spectral fit
results are given in Table 3, and spectra are shown in Fig. 3
.
In this peculiar state,
the spectrum is also compatible with a power-law and multiple blackbody (Makishima et al. 1986)
instead of Comptonization halo;
nevertheless the temperature is extremely high and perhaps unphysical.
Since the spectral parameters in the peculiar state are similar
to those in the soft/high BeppoSAX state, a possible interpretation of this state is
that 4U 1636–53 was in a similar soft/high state
as during the BeppoSAX observations,
but with a new overlapped component at high energies simultaneously present.
The un-absorbed luminosity is erg s-1.
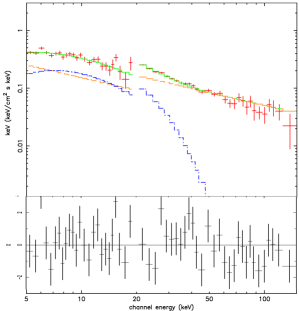
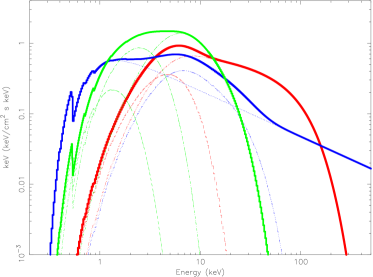
Comparison between the models in the three different
spectral states are shown in Fig. 4.
Spectral state transitions are evident, with the hard INTEGRAL state
extended up well above 100 keV and,
in the peculiar state, a steep power-law
component detected with high statistical significance up to 100 keV.
4. Discussion and Conclusions
According to our present understanding, the black-body component in the soft states could originate at both the neutron star surface and the surface of an optically-thick accretion disk. In our observations the two black body components seems to originate from two different parts of the disk, corrisponding to two different temperature. The high optical thickness of the plasma rules out the black body component as originates from the neutron star cap regions. Anyway, independently from the optical thickness of the plasma, it is very improbable to have emission from the polar caps of the neutron star for this source. Infact the magnetic field of the LMXBs is Gauss implying that the accretion onto the neutron star is not magnetically dominated and the matter accretes onto the whole NS surface. The Comptonization component may arise from a corona above the disk and/or between the disk and the neutron star surface. In the hard states, accretion probably assumes the form of a truncated outer accretion disk and a hot inner flow, joining the disk and the stellar surface as previously reported by Barret & Olive (2002) for LMXB 4U 1705-44. The spectral transitions are generally, but not necessarily, coupled with changes in luminosity, indicating they are driven by variability of the accretion rate or change of the geometry of the system as for Black Hole hard/soft transition at constant luminosity (Belloni et al. 2005). For 4U 1636–53 the accretion rate is lower in the hard state than in the soft state: for an accretion efficiency of (corresponding, e.g., to and km ) and using our model luminosities, , we get yr-1 and yr-1. Transitions are apparently accompanied by changing in the geometry of the flow, and in the relative contribution of the blackbody-like and Comptonization components. In the peculiar state the accretion rate becames very high ( yr-1), but this value can be influenced by the steep power law that dominates the energy spectrum at low energies. The emission is best described by Comptonization from a complex electron distribution due to a low temperature (keV) thermal electron distribution together with non-thermal power-law electrons. This two-component electron distribution could arise from non-thermal electron acceleration regions powered by magnetic reconnections above a disc. Low-energy electrons cool preferentially by Coulomb collisions leading to a thermal distribution while the high-energy electrons cool by Compton scattering, preserving a non-thermal distribution (Coppi 1999). Alternatively, the thermal and non-thermal electrons could be spatially distinct, e.g. magnetic reconnection above the disc can produce a non-thermal electron distribution, while overheating of the inner disc produces the thermal Comptonization (Kubota et al. 2001).
LMXBs exhibit hard X-ray states which are very similar to the Black Hole Candidates ones and investigating the possible disc-jet coupling is very interesting and still matter of discussion. The power-law component could be produced by Componization by synchrotron emission in the jet (Bosch-Ramon et al. 2005, Fender 2004) as proposed for others LMXBs: the power law component in Cir X-1 is explained by Iaria et al. (2002) as jet emission that has been resolved using radio interferometry by Fender & Kuulkers (2001); a significant correlation between radio and X-ray flux has been detected for 4U 1728-34 (Migliari et al. 2003), indicating a clear signature of disc-jet coupling. In our source, this hypothesis is strengthened by radio detection: Sydney University Molonglo Sky Survey catalog gives a flux of 7.5 mJy at 843 GHz (Mauch et al. 2003). Assuming a radio spectral index of -0.5 to estimate the flux density at 5 GHz based on other observations, we found a radio loudness (as defined in Fender & Kuulkers 2001) in the range 1.1-2.2 Jy/Crab, where is the radio flux density at 5 GHz and is the peak X-ray flux measured in the soft band (), even though the two data set are not simultaneous. The radio loudness value is consistent with the one for Cir X-1 (Fender & Kuulkers 2001) and it is very high respect to other LMXBs and quite similar to that of Back Hole Candidates. These founding are in favour of the jet hypothesis as origin of the power-law observed for 4U 1636–53 similarly to GX 5-1, Cir X-1 and GX 17+2 being all of them associated with variable radio sources (Fender & Hendry 2000, and reference therein).
Simultaneous high energy and radio observations during spectral transition are crucial to disentangle the power law emission in the LMXBs containing a neutron star.
Finally, Laurent & Titarchuk (1999) suggest the detection of a power-law component at high energy to be a signature of presence black hole in an X-ray binary system. Our data are supporting result on GX 17+2 by Di Salvo et al. (2000), clearly showing this criterion proposed to distinguish black hole versus neutron star binaries is inadequate.
References
- Asai et al. (1998) Asai, K., Dotani, T., Mitsuda, K., Inone, H., Tanaka, Y., Lewin, W. H. G., 1998, IAUS, 188, 354
- Augusteijn et al. (1998) Augusteijn, T., van der Hooft, F., de Jong, J. A., van Kerkwijk, M. H., van Paradijs, J., 1998, A&A 332, 561
- Barret & Olive (2002) Barret, D., & Olive, J. F. 2002, ApJ, 576, 391
- Belloni et al. (2005) Belloni T., Mendez M. & Homan J., 2005, A&A, 437, 209
- Bosch-Ramon et al. (2005) Bosch-Ramon, V., Romero, G. E. and Paredes, J. M., 2005, A&A, 429, 267
- Christian & Swank (1997) Christian D. J. & Swank J. H., 1997, ApJ, 109, 177
- (7) Coppi P. S., 1999, in ASP Conf. Ser. 161, High Energy Processes in Accreting Black Holes, ed. J. Poutanen & R. Svensson (San Francisco: ASP), 375
- Cornelisse et al. (2003) Cornelisse, R. et al., 2003, A&A, 405, 1033
- D’Amico et al. (2001) D’Amico, F., Heindl, W.A., Rothschild, R.E., Gruber, D.E., 2001, ApJ, 547, 147
- (10) Dickey & Lockman, 1990, Ann. Rev. Astron. Astrophys. 28, 2
- Di Salvo et al. (2000) Di Salvo, T., et al., 2000, ApJ, 544, 119
- Di Salvo et al. (2001) Di Salvo, T., Robba, N. R., Iaria, R., Stella, L., Burderi, L., Israel, G. L., 2001, ApJ, 554, 49
- Fender & Hendry (2000) Fender, R. P. & Hendry M. A., 2000, MNRAS, 317, 1
- (14) Fender, R. P. & Kuulkers, E., 2001, MNRAS, 324, 923
- (15) Fender, R. P., 2004, Compact Stellar X-Ray Sources’, eds. W.H.G. Lewin and M. van der Klis, Cambridge University. astro-ph/0303339
- Fiore et al. (1999) Fiore, F., Guainazzi, M., & Grandi, P. 1999, Cookbook for BeppoSAX NFI Spectral Analysis (www.asdc.asi.it/bepposax/software/cookbook)
- Fujimoto et al. (1988) Fujimoto, M. Y., Sztajno, M., Lewin, W. H. G., van Paradijs, J., 1988, A&A, 199, 9
- Gierliński & Done (2002) Gierliński, M., & Done, C., 2002, MNRAS, 337, 1373
- Hasinger & van der Klis (1989) Hasinger, G., & van der Klis, M. 1989, A&A, 225, 79
- Jonker et al. (2005) Jonker P. G., Mendez M., van der Klis M., 2005, MNRAS, 360, 921
- Kubota et al. (2001) Kubota A., Makishima K., Ebisawa K., 2001, ApJ, 560, L147
- Iaria et al. (2001) Iaria, R., Di Salvo, T., Burderi, L., Robba, N. R., 2001, ApJ, 548, 883
- Iaria et al. (2002) Iaria, R., Di Salvo, T., Robba, N. R., Burderi, L., 2002, ApJ, 567, 503
- Laurent & Titarchuk (1999) Laurent, P. & Titarchuk, L., 1999, ApJ, 511, 289
- Lund et al. (2003) Lund, N., et al., 2003, A&A, 411, L231
- (26) Makishima, K., Maejima, Y., Mitsuda, K., Bradt, H. V., Remillard, R. A., Tuohy, I. R., Hoshi, R., Nakagawa, M., 1986, ApJ, 308, 635
- (27) Mauch, T., Murphy, T., Buttery, H. J., Curran, J., Hunstead, R. W., Piestrzynski, B., Robertson, J. G., Sadler, E. M., 2003, MNRAS, 342, 1117
- (28) Migliari, S., Fender, R. P., Rupen, M., Jonker, P. G., Klein-Wolt, M., Hjellming, R. M., van der Klis, M., 2003, MNRAS, 342, 67
- Pedersen et al. (1984) Pedersen, H. van Paradijs, J. Lewin, W. H. G. 1984, IAUC, 3952, 3
- Piraino et al. (1999) Piraino, S., Santangelo, A., Ford, E. C., Kaaret, P., 1999, A&A, 349, 77
- Smale & Lochner (1992) Smale, Alan P., & Lochner, James C., 1992, ApJ, 395, 582
- Titarchuk (1994) Titarchuk, L. 1994, ApJ, 434, 570
- Ubertini et al. (2003) Ubertini, R., Lebrun, F., di Cocco, G. et al. 2003, A&A, 411, 131
- Vacca et al. (1997) Vacca, W. D., Sztajno, M., Lewin, W. H. G., Truemper, J., van Paradijs, J., Smith, A. 1987, A&A, 172, 143
- van der Klis (2000) van der Klis, M., 2000, ARA&A, 38, 717
- Waki et al. (1984) Waki, I., et al., 1984, PASJ, 36, 819
- White et al. (1988) White N. E., Stella L. & Parmar A. N. 1988, ApJ, 324, 363
- Winkler et al. (2003) Winkler, C., Gehrels, N., Schönfelder, V., Roques, J.-P., Strong, A. W., Wunderer, C., Ubertini, P. , 2003, A&A, 411, 349
- Zhang et al. (1996) Zhang, S. N., et al., 1996, A&A, 120, 279