The superimposed photospheric and stellar wind variability of the O-type supergiant Cam
Abstract
Aims. This study seeks to provide empirical constraints on the different physical components that can act to yield temporal variability in predominantly or partially wind-formed optical lines of luminous OB stars, and thus potentially affect the reliable determination of fundamental parameters, including mass-loss rates via clumped winds.
Methods. Using time-series spectroscopy from epochs spread over 4 years, we present a case study of the O9.5 supergiant Cam. We demonstrate that the HeI 5876 (23P0–33D) line is an important diagnostic for photospheric and wind variability in this star. The actions of large radial velocity shifts (up to 30 km s-1) in the photospheric absorption lines can also affect the morphology of the Hαline profile, which is commonly used for measuring mass-loss rates in massive stars.
Results. We identify a 0.36-day period in subtle absorption profile changes in HeI 5876 , which likely betrays photospheric structure, perhaps due to low-order non-radial pulsations. This signal persist over 2 months, but it is not present 2 years later (November 2004); it is also not seen in the stellar wind components of the line profiles. Using a pure Hαline-synthesis code we interpret maximum changes in the red-ward and peak emission of Cam in terms of mass-loss rate differences in the range 5.1 10-6 to 6.5 10-6 M⊙ yr-1. However, the models generally fail to reproduce the morphology of blueward (possibly absorptive) regions of the profiles.
Conclusions. The optical line profiles of Cam are affected by (i) deep-seated fluctuations close to, or at, the photosphere, (ii) atmospheric velocity gradients, and (iii) large-scale stellar wind structure. This study provides new empirical perspectives on accurate line-synthesis modelling of stellar wind signatures in massive luminous stars.
Key Words.:
stars: early-type – stars: mass-loss – stars: individual: Cam1 Introduction
Through their powerful stellar winds, high ionizing fluxes, and ultimate demise as supernovae, massive stars have a profound effect on the dynamical and chemical evolution of our own and other galaxies. The hot star winds are driven by line scattering of radiation, and the extent of the mass-loss is a major factor in the evolution of these stars; it can for instance influence whether the end-state is a neutron star or a black hole (e.g. Heger et al, 2003). Therefore it is important that the nature of these outflows is well understood, and in particular the mass-loss rates are reliably determined.
One of the most serious obstacles in this path arises from detailed optical and ultraviolet observations that reveal widespread line profile variability, implying clumped structure in the winds (see Prinja, Massa & Fullerton, 2002; Markova et al., 2004; Morel et al., 2004, plus references within). The developing picture of massive star winds as a clumped medium is further supported by recent model atmosphere calculations; e.g. Bouret et al. (2005) need to include substantial clumping factors in their models to match key wind features in the spectra of O-type stars, implying significant downward revisions in the canonical mass-loss rates. Clumping may be a consequence of the inherent instability of the radiation driving mechanism of the wind, or of the creation of coherent structures arising from photospheric disturbances, or both. In either case, wind clumping is inextricably linked to the fundamental physical problem of radiation driven winds.
Our objective in the study presented here is to exploit detailed time-series optical observations of the late-O supergiant Cam (HD 30614) to provide empirical constraints for ab initio model atmosphere codes that are commonly used to synthesise spectra in order to derive fundamental stellar and wind parameters (e.g Hillier et al 1998, CMFGEN,Pauldrach et al. 2001, WMbasic, Puls et al. 2005, FASTWIND). Our approach is to constrain the components that contribute to changes evident in diagnostic wind and photospheric lines. We seek to ‘decompose’ the variability patterns and assess in particular the degree to which fluctuations in the wind-formed features are due to ‘contamination’ by photospheric and deep-seated atmospheric activity. This is particularly critical in late O and early B stars, where the Hα emission may be weak; see e.g. the imprints of photospheric signals seen in the Balmer lines of Ori (Prinja et al., 2004, B0 Ia,). Our study of Cam is also designed to probe causal links between photospheric disturbances and spatial wind structure.
The target Cam is previously known to exhibit line-profile variability in Hα (e.g. Ebbets (1982); Fullerton (1990); Kaper et al (1997)) as well as in some other absorption lines in the optical spectrum (Fullerton, Gies & Bolton, 1996; Markova, 2002). Whist its UV resonance lines are strong and saturated, Lamers et al. (1988) reported on weak low-velocity fluctuations and changes in the soft blue wings of saturated (‘black’) absorption troughs. Some fundamental parameters of Cam are listed in Table 1.
| Parameter | Value | Reference |
|---|---|---|
| Spectral Type | O9.5 Ia | Walborn (1973) |
| 29000 | Repolust et al. (2004) | |
| 32.5 | Repolust et al. (2004) | |
| sin() | 115 km s-1 | Penny (1996) |
| 20 | Schaller et al. (1992) | |
| 1550 km s-1 | Haser (1995) | |
| 14.3 days |

2 Observations
Our investigations are based on three datasets; (i) time-series of primarily He I 5875.67 obtained during January, February and March 2002, (ii) time-series of Hα, HeI 6678 and HeI 5876 obtained during November 2004, and (iii) comparisons of (i) and (ii) to Hαobservations secured in 1999 and described by Markova (2002). A summary log of the observations of Cam is given in Table 2.
The majority of the 2002 data were obtained using the Coudé spectrograph of the 2-m telescope at the National Astronomical Observatory, NAO (Bulgaria) equipped with a PHOTOMETRICS CCD (10241024, 24). 111This detector was characterized by an read-out noise 3.3 electrons per pixel (2.7 ADU with 1.21 electrons per ADU) The spectrograph was used in two different configurations producing spectra with a reciprocal dispersion of 0.2 Å pixel-1 (effective resolution R=15 000) and of 0.1 Å pixel-1 (effective resolution R=30 000) over a wavelength range of respectively, 200 and 100 Å . The typical signal-to-noise of the individual spectra, adjacent to HeI 5876 , ranges between 100 to 500.
The 2002 time-series from NAO is complemented by observations obtained between 21 to 23 January, 2002 from the 0.9-m telescope at Catania Observatory (CO, Sicily). The setup employed an Echelle spectrograph and a SITe CCD detector, to yield a spectral resolution R 20 000 and a typical signal-to-noise of 130.
The 2004 time-series (Table 2) were also secured at the NAO 2-m telescope employing the Coudé spectrograph to cover wavelength regions including HeI 5876 , Hα and HeI 6678 . The effective spectral resolution of these data is 15 000 with signal-to-noise (adjacent to HeI 5876 ) between 300 to 400.
The data from both observatories were reduced in a homogeneous manner, with standard procedures for bias subtraction, flat-fielding and wavelength calibration. The line profiles of Cam were subsequently normalised by fitting a low-order polynomial through selected continuum windows. Finally, the telluric water vapour lines were removed by dividing individual spectra with a scaled model telluric spectrum (e.g. Markova & Valchev, 2000). Note that the internal stability of the velocity scale in the extracted spectra (specified by the standard deviation in velocity of the IS NaI D line at 5889.95) is less then 1 km s-1for both the NAO and CO data sets. Throughout the paper we have corrected to the stellar rest frame for a radial velocity of 6 km s-1 (e.g. Hoffleit & Jaschek, 1982).
The intensive HeI 5876 time-series of 114 spectra obtained between 21 to 27 January 2002 is therefore our primary dataset for probing short-term modulated or periodic line profile variability.
| Observatory | UT Date | HJD 2 450 000 + | No. of |
|---|---|---|---|
| spectra | |||
| Catania 0.9m | 2002 Jan. 21,22,23 | 2296.4002298.577 | 50 |
| NAO 2m | 2002 Jan. 25,26,27 | 2300.2402301.396 | 64 |
| NAO 2m | 2002 Feb. 25,26 | 2331.2462332.486 | 36 |
| NAO 2m | 2002 March 2,3 | 2336.2202337.433 | 30 |
| NAO 2m | 2004 Nov. 26,27,28 | 3336.3673338.654 | 29 |
3 Variability characteristics
With the possible exception of Hα, the optical spectrum of Cam is typical for its late O spectral class, with (mostly) symmetrical He I absorption lines, very weak metal lines (e.g. C IV 5801, 5811), and weak He II 4686 (absorption). We are confident that ours is a case study of a ‘normal’ late O-type supergiant and focus in this section on the temporal behaviour of HeI 5876 and Hα.

3.1 HeI 5876 (23P0–33D)
This is an important diagnostic line, since the lower level of the transition can become substantially populated in the spectra of massive stars, which then effectively becomes the ground state and the line may reveal P Cygni-like signatures.
The night-to-night variations are contrasted against shorter time-scale (hourly) changes in Fig. 1. Even though HeI 5876 is predominately a photospheric line in Cam, the night-to-night mean profiles in Fig. 1 (upper-left panel) reveal evidence of a variable stellar wind component, with absorptive changes in the blue-wing which contrast with the less extended, mostly ‘stable’ red-wing and a weak emission. The data indicate that the deep-seated inner wind region ( 2 R⋆) of the star is not steady This night-to-night variability is accompanied by more rapid and subtle changes (down to 2-3% of the continuum level) in the core absorption. This behaviour is seen in intensive (hourly) time-series captured during individual nights (Fig. 1; lower-left panel)
To quantify the significance level of the line profile variability as a function of velocity, we have determined the Temporal Variance Spectrum (TVS) according to the methods of Fullerton, Gies & Bolton (1996). The results are shown in Fig. 2 (left-hand panel). The night-to-night stellar wind variation in HeI 5876 extends over 500 to +200 km s-1(i.e. 0.3 to +0.13 ). The hourly core absorption changes are essentially symmetric about rest velocity and constrained within the boundary marked by sin()thus suggesting the presence of photospheric activity in the star.
3.2 Hα
The corresponding results for Hαare shown in the right-hand panels of Figs. 1 and 2. The mean Hαprofile (e.g. Fig. 2) consists of a well-developed P Cygni-like core superimposed on broad emission wings. In O-type supergiants of same spectral type, Hα Profiles with similar morphology to Cam are indicative of relatively high wind density connected to a higher mass-loss rate (e.g. Markova et al 2005). The well developed Hα profile observed here may (in part) reflect the Ia luminosity class, and perhaps also the presence of clumps in the outflow.
From Figs 1 and 2 it is also obvious that the emission peak of Hα in Cam is red-shifted, typically occurring at +100 km s-1. Red-shifted emission has also been observed in UV resonance lines of O-type stars, as well as in Hα. These two phenomena, though similar on a first glance, seem to have different interpretations. While in the former case the red-shifted emission can be explained in terms of “micro-turbulence effects” with of the order of 0.01(Hamann, 1980), in the later case it likely results from the interaction between the red-wing of the Stark-broadened photospheric profile and wind emission of certain strength, namely 13.6 222 is the “mean wind density”calculated at a typical location of 1.4 (Markova et al, 2005). Indeed, with its “mean wind density”, , =13.64, Cam is just above this limit and thus consistent with the interpretation suggested by Markova et al.
The TVS for Hα means (Fig. 2) extends almost symmetrically in velocity space (blue and red limits at about 600 km s-1, i.e. 0.39) with blueward amplitudes (with respect to the rest wavelength) slightly stronger then the red-ward ones. As can be seen from a comparison to Figure 1, the observed blue-to-red asymmetry in the strength of the TVS amplitudes is more likely due to absorptive blue-ward Hαfeatures, perhaps caused by wind structure localised along the line-of-sight to the stellar disk. In contrast, the overall emission profile is produced by gas occupying a greater volume than the gas responsible for (episodic) absorption features.
Generally the Hα profile of Cam is not substantially variable on time-scales. However, an exceptional case is shown in Fig. 1 (lower-right panel), where localised systematic changes are clearly evident over 10 hours. These intriguing variations are tightly constrained within sin() (see Fig. 2). Such a behaviour has previously been documented by Markova (2002) and we discuss it further in Sect. 3.3.2.
In a given epoch, over nightly time-scales the total Hα equivalent width may vary by up to 10%; however, differences of 3040 % are also noted between line profiles secured in different years (see Sect. 4).
3.3 Photospheric activity
3.3.1 The 2002 time series
It is clear from Figs. 1 and 2 that the temporal stellar wind activity in Cam dominates the overall variance levels of HeI 5876 and Hα. Since the wind changes occur over time-scales of days, we are still able to pursue the effects of shorter time-scale photospheric variability in these lines (particularly in HeI 5876 ). To emphasis the photospheric changes, the individual line profiles were normalised by the corresponding nightly mean profile, to ‘remove’ the larger amplitude night-to-night changes, and time-series analyses was then carried out on the quotient spectra.
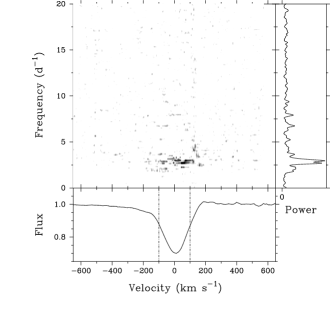
The most suitable dataset for a search for short-period systematic variability is the intensive HeI 5876 time-series obtained from Catania and the Bulgarian NAO between 21 to 27 January, 2002, totalling 114 spectra (Table 2; note that Hαwas not observed during this setup). We carried out a periodogram analysis of these data, using the CLEAN algorithm (Roberts et al., 1987) to deconvolve the features of the window function from the discrete Fourier transform. The two-dimensional grey-scale representation of the periodogram for He I is shown in Fig. 3 (for a gain=0.5 and 100 iterations; lower values of gain or greater iterations yield essentially the same power spectrum). Though the power across the absorption core is slightly dis-jointed, the results indicate a (dominant) primary frequency of 2.78 days-1, corresponding to a period of 0.36 days. (Note this period is consistent with the modulations reported by Markova (2002) in data for HeI 6678 secured in late 1998 and early 1999.) We are very confident that 0.36-d period is not directly connected to the sampling window of each night, where the length of the nightly runs in 2002 is between 0.12 to 0.27 days (Table 2). Note, that a Fourier analysis of the original He I data (i.e. not residual with respect to the nightly mean) reveals essentially the same modulation signal as in Fig. 3, but does not show any significant power on this (or any other) period in the more blue-ward region dominated by night-to-night wind variability, i.e. over 100 to 500 km s-1.
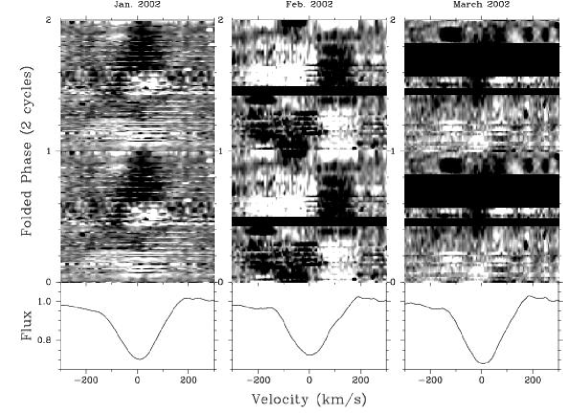
Grey-scale images of the phase versus velocity behaviour of the individual residual He I spectra on the 0.36-d period are shown in Fig. 4. The left-hand panel show the coherent behaviour during our primary (January 2002) time-series. The sparser datasets secured in February 2002 and March 2002 (Table 2) are not suitable for a reliable Fourier analysis, but they do provide some indication that systematic modulations persist for several weeks over comparable timescales, though not with the same phase relationship.
The data from January 2002 reveal some indication for progressive changes across the absorption profile, though the acceleration of the pseudo-absorption (emission) feature is not substantial. There is evidence for characteristic ‘blue-to-red’ motion (see Fig. 5), accommodated within the projected rotation velocity (115 km s-1). We estimate a prograde feature travelling across the line centre with (dV/d) 80 km s-1/cycle (Fig. 5). This behaviour would be consistent with a low-order sectorial non-radial pulsation mode. These time-series of Cam are however not extensive enough, nor sufficiently high signal-to-noise, to attempt more detailed modelling to determine pulsational parameters.
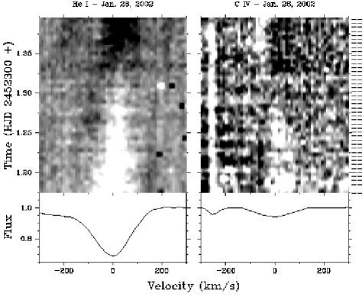
The wavelength range of the Bulgarian NAO data of January 2002 includes the very weak photospheric metal lines of C IV 5801, 5812. Unfortunately, the intensity of these lines is rather small but we are confident that they are also temporally active. The C IV 5801 data for 26 January, 2002 covering 5.3 hours is shown as a grey-scale (‘dynamic’) representation in Fig. 5, together with the corresponding HeI 5876 line profiles. The subtle prograde travelling pattern identified above in He I is tentatively mimicked in C IV, which supports an interpretation in terms of photospheric velocity fields; though confirmation of this result clearly requires much higher signal-to-noise time-series data.
3.3.2 The 2004 time series
Interestingly, the 0.36-d period derived from the 2002 data of Cam is not present in the observations secured during November 2004. The line profile changes are generally weaker in 2004 and the Fourier analysis does not reveal any significant frequencies in HeI 5876 , Hα or HeI 6678 . However, whilst the time-series of 26 and 28 November, 2004 are almost steady, a different episodic property is evident during 27 November, 2004. In contrast to the weak fluctuations within the absorption trough seen in 2002 (Figs. 4 and 5), a systematic velocity shift occurs in the absorption components of the He I lines during this night; this behaviour is shown in Fig. 6.

The central velocity (and wings) of HeI 6678 shifts by up to 30 km s-1 during the night, while the motion of HeI 5876 has a peak shift of 15 km s-1 (but in a corresponding manner). Interestingly, these changes in absorption velocity are accompanied by relatively strong changes in the Hα emission flux, which are centred at rest velocity and occur within sin() (see Fig. 6). The Hα flux is a maximum in this region when the He I absorption lines have their greatest blue-ward motion.
We stress that the behaviour documented in Fig. 6 is isolated to November 27, 2004, it was not witnessed for example during 2002 or during the remaining nights in 2004. This behaviour (also shown here in Fig. 1) is empirically very different from the broader changes due to stellar wind variability that grossly affect the blue and red wings of Hα and might in principle be due either to variations in radial velocity of the underlying photospheric profiles or to localised changes in density stratification in the innermost part of the wind.
To test the first possibility we employed the approximate method developed by Puls et al. (1996) (see also Markova et al., 2004, and applications in Sect. 4) to calculate a pair of ‘representative’ Hα model profiles: One with a normal TLUSTY (= 30 000K, = 3.2) photospheric profile and the other with the same TLUSTY input but now shifted in radial velocity by 30 km s-1 (cf. HeI 6678 in Fig. 6). The corresponding model Hα profiles are shown in Fig. 7, demonstrating some correspondence to the observed Hα changes shown in Fig. 6. The effect of shifting the core Hα photospheric absorption blue-wards is (naturally) to reveal more of the central Hα emission.
It seems therefore possible that the photospheric lines of Cam are affected by large-amplitude radial velocity shifts. It is unknown whether this characteristic is periodic over a much longer time-scale, but the phenomenon was only seen once in our 2002 and 2004 data sets. The radial velocity motion is differential, such that the extent of the velocity shifts is different for lines formed at varying depths in the atmosphere. This likely reflects a velocity gradient in the atmosphere, though the physical origin of this deep-seated disturbance is not known.
On the other hand, the Hα variability pattern illustrated in the lower right panel of Fig. 1 seems to be quite similar to the ones observed by Markova on Dec. 31, 1998 and on Jan 6, 1999 (Markova, 2002, see Fig.4 ). In addition, the radial velocity behaviour of the HeI 6678 line during those two nights in 1998 and 1999 was similar to that shown in Fig 6, i.e. the increase in the Hα emission flux localised within sin() was accompanied by a shift to the blue in the radial velocity of the line. The time resolution of the 1998-1999 data set was very low (3 spectra per night only) and thus prevents a more detailed comparison of the phenomena to the 2004 event. Nevertheless, the empirical similarity of the Nov. 27, 2004 variations and those observed on Dec. 31, 1989 supports a common physical origin, perhaps in terms of large-scale perturbations in the inner-most wind regions, as suggested by Markova (2002).
4 Stellar wind characteristics
It is well known that the stellar winds of OB stars are highly variable. Evidence for wind structure is seen in modulated UV and optical lines (e.g. Kaper et al 1996; de Jong et al 2001; Prinja et al. 2004; Markova et al 2005), excess flux at infrared and millimetre wavelengths (Runacres & Blomme, 1996), and detection of X-rays (e.g. Chlebowski et al, 1989; Cassinelli et al, 2001). Cam is no exception in this respect as already demonstrated in Figs. 1 and 2 (see also references in Sect. 1).
The HeI 5876 line of Cam offers a weak diagnostic of variable wind conditions via fluctuations in the blue-ward absorption wing (Fig. 1); unfortunately we only have corresponding Hαdata for the November 2004 run. Excluding the exceptional behaviour seen on 27 November, 2004 (Sect. 3.1), a maximum increase in Hα equivalent width between 100 to 600 km s-1of 0.4Å is accompanied by a 0.05Å absorption enhancement in He I. We do not find any evidence for periodic or modulated stellar wind changes over hourly time-scales. Our data set is not suitable for an assessment of temporal behaviour on stellar rotational time-scales.
We focus in this section instead on the large-scale, epoch-to-epoch changes evident in Hα, which are, of course, superimposed on the more subtle photospheric and deep atmospheric structure described in Sect. 3. Our goal here is to explore extreme Hα morphologies in Cam that provide challenges for line-synthesis modelling and likely reflect variable density distributions in the inner-wind regions.
The overall Hαline profile shape can vary substantially over yearly time-scales. A particular example is shown in Fig. 8 (upper panel) where we compare line profiles from November 2004 and January 1999. The 30% change in equivalent width is mostly around line centre and toward the red-ward emission wing. To fit the two profiles we employed again the approximate method of Puls et al. (1996), modified by Markova et al. (2004), to account for the effects of line-blocking and blanketing. We find that the observed red-wing and peak are reasonably well matched for fixed terminal velocity = 1550 km s-1, velocity law index = 1.05 and varying the mass-loss rate () between 6.5 10-6 yr-1to 5.1 10-6yr-1. The model with the lowered emission flux cannot however reproduce the blue-ward regions of the line profile from 1999, since it under-predicts the emission in this region.
The lower panel in Fig. 8 shows a markedly different temporal characteristic in the Hα profile of Cam. These two spectra were taken 4 days apart in January 1999, and they exhibit broadly similar red-ward emission and peak fluxes. However, in this case the blue-ward regions of the profile are highly variable between 50 to 450 km s-1 (i.e. well beyond the domain of He II 6560.2). Whilst models with differing between 6.2 10-6 yr-1 and 5.9 10-6 yr-1 ( = 1550, = 1.05) can broadly match the red-wing, they once again cannot reproduce the differing morphologies of the blue-ward regions.
We note therefore that though the variable red-ward Hαwings allow some constraint on and , the blue-ward fluctuations pose a more serious discrepancy for spherically symmetric stellar wind models with smooth density stratification.
5 Discussion
We have demonstrated in this study that the primarily, or partially, wind-formed spectral lines of the late O supergiant Cam can exhibit variability that arises in different physical regimes of the star. This ‘contamination’ of wind signatures by variable non-wind components is directly relevant to line-synthesis modelling, particularly in the context of revising mass-loss rates due to the presence of small- and large-scale structure in the outflows. In particular, we have found that the temporal behaviour of Cam’s optical spectrum is characterised by at least three different variability patters:
-
i)
systematic changes in the photospheric lines, with some evidence that the behaviour may be linked to surface velocity fields due to non-radial pulsations,
-
ii)
short time-scale ( hourly) perturbations that differentially shift the radial velocity of He I lines, and potentially give rise to localised changes in Hαemission,
-
iii)
a variable stellar wind, which may be parameterised typically in terms of a 5% change in mass-loss rate over several days, but very occasionally this difference can rise to 30%. The red-ward emission changes are accompanied by more enigmatic blue-ward changes that may result from absorption effects linked to localised density structures in the outflow.


Hot massive stars are expected to be subject to photospheric instabilities and/or pulsations. During the last decade the search for non-radial pulsations in OB stars has been largely motivated by the need to test the hypothesis of the “photospheric connection” which aims at linking the cyclic variability observed in the winds of these stars to processes in the stellar photosphere. The task however turned out to be observationally very demanding and as a result only a limited number of OB stars are currently flagged as confirmed or suspected pulsators (e.g. Fullerton, Gies & Bolton, 1996; Reid & Howarth, 1996; de Jong et al, 2001; Kaufer et al, 2006).
The results derived in this study raise the possibility that the supergiant Cam might also be a non-radial pulsator. Radial velocity variations in optical absorption lines of Cam have been reported previously by Zeinalov & Musaev (1986) and Musaev & Snezhko (1988) who argued that these variations are likely periodic with a possible cycle length of 1.35, 1.54 or 2.93 days (with no preference to any of them). However, our analysis of the 2002 and 2004 time-series did not support any of these periods but instead revealed a new one of 0.36 days, which may be interpreted in terms of prograde low-order non-radial pulsational behaviour. The 8–9 hour modulation may persist over two months in 2002, albeit with different phase shifts. This signal is not evident in data collected more than 2 years later (November 2004); it is also not seen in the stellar wind components of the line profiles. The interpretation of the 0.36-day variation in terms of photospheric velocity fields is also supported by weak fluctuations in the shallow photospheric lines of C IV 5801, 5812.
Apart from the 0.36-day periodic variation detected between Jan- March 2002, our observations also documented occasional large-amplitude (of about 15 to 30 km s-1) differential radial velocity shifts in HeI 5876 and HeI 6678 absorption lines, accompanied by an increase in the Hαemission flux centred at and localised within sin().
Large-amplitude differential velocity shifts have been discovered by Prinja et al. (2004) in the optical absorption lines of Ori (B0 Ia) and they are also present in the photospheric lines of Cepheid stars. However in both these cases the velocity shifts are regular and periodic while those seen in Cam occurred over at least several hours, during a specific night in 2004, with no recurrence during the other nights of the run. This phenomenon can be interpreted either in terms of large-amplitude changes in photospheric velocity fields or as the result of deep-seated, large-scale wind structure that occasionally modulates the density distribution in the innermost part of the wind.
Discrete Absorption Components moving from red to blue across the unsaturated UV resonance lines are the characteristic signature of large scale structure in O star winds. Unfortunately the UV resonance lines of Cam are saturated and do not provide any detailed information on variable wind features (Kaper et al, 1997). We have re-examined the time-series of Cam from February 1991 and December 1994. Whilst there is subtle evidence for low velocity fluctuations in Si IV 1400 (and Si III 1207), the clearest variability is in the soft blue wings of the saturated UV lines. For example, during the 1991 observing run of 5 days, additional absorption is evident in the blue wing of Si IV beyond (= 1550 km s-1) out to 1700 km s-1. This enhancement persists for 24 hours and does not recur during the following 4 days. This finding is at least consistent with the notion based earlier on optical observations, that large scale structure may develop in the wind of Cam; the present study suggests however that these structures are somewhat unstable and thus do not give rise to longer-term periodic phenomena in the wind.
The possibility that the wind of Cam is not smooth but structured has got additional support by the recent results derived by Fullerton, Massa & Prinja (2006) and Puls et al. (2006). In particular, Fullerton, Massa & Prinja (2006) have modelled the P V lines of Cam using the SEI method to derive products of mass-loss rate and ionization fraction. Adopting mass-loss rates derived from radio observations, they find resulting ionization fractions, q(P4+), = 710-3 for Cam. In the case of Cam the low ion fraction is highly discrepant with results from NLTE stellar atmosphere models which predict that the P V ion fraction should be dominant and thus close to unity at these effective temperatures. The discrepancy is thought to indicate that the wind is highly clumped and has very small volume filling factors.
Further evidence in support of the clumped structure of Cam wind has been derived by Puls et al. (2006). By means of a simultaneous model analysis of Hα, IR and radio data these authors showed that the wind of Cam likely has a clumping factor in the innermost region ( between 1.05 333The wind below 1.05was assumed to be unclumped in agreement with results from hydrodynamical simulations which showed that the line-driven instability needs some time to grow before significant structure is formed. and 2), being a factor of 2.6 larger than in the outermost wind (beyond 50). Using the Hαemission wings as a tracer of wind clumping in the intermediate wind (between 2 and 15), Puls et al. furthermore found that the clumping factor in this region is similar or fractionally larger than in the inner wind.
Interestingly, the properties of the TVS of Hα(derived in the present study and by Markova (2002)) also seem to be consistent with results obtained via line-profile simulations including wind clumps (Markova et al, 2005). In particular, the velocity limits as well as the established asymmetry of the TVS are both consistent with a model including ’broken shells” (i.e. clumps), uniformly distributed over the wind volume, with density contrast of 0.35 (model series BS21 in (Markova et al, 2005)) where is the stationary density. Thus, it may be that Hαnight-to-night variability observed in Cam is at least partially connected with presence of small-scale structure (clumps, blobs) in the innermost part of the wind.
Overall, there is now substantial observational evidence which suggests that the wind of Cam is not smooth but structured over, both, large and small spatial scales. In view of this possibility it is therefore not surprising that we failed to reproduce the observed set of Hαprofiles (Sec. 4) by means of model calculations. Indeed, the approximate method of Puls et al. (1996) employed here, as well as most of the state-of-art model atmosphere codes, rely on the assumption of a globally stationary wind with a smooth density /velocity stratification, coupled to a ‘stable’ photospheric line contribution, and are therefore incapable in principle of describing the observed blue-ward (absorptive) behaviour of Hαin Cam and of any other star with a substantially structured wind.
Acknowledgements.
This study was in part supported by funds from the National Scientific Foundation to the Bulgarian Ministry of Education and Science (F-1407/2004). We are also grateful to Bulgarian Academy of Sciences and the Royal Society (UK) for a collaborative research grant. NM acknowledges the financial support of the Bulgarian Academy of Sciences and PPARC. NM is also grateful to her colleague Sabotinov (BAS) for his understanding and moral support during this study.References
- Bouret et al. (2005) Bouret, J.C., Lanz, T., & Hillier, D.J. 2005, A&A, 438, 301
- Cassinelli et al (2001) Cassinelli, J.P., Miller, N.A., Waldron, W.L., MacFarlane, J.J., & Cohen, D.H. 2001, ApJ, 554, L55
- Chlebowski et al (1989) Chlebowski, T., Harnden, F.R.J., & Sciortino, S. 1989, ApJ, 341, 427
- de Jong et al (2001) de Jong, J.A., et al. 2001, A&A, 368, 601
- Ebbets (1982) Ebbets, D. 1982, ApJS 48, 399
- Fullerton (1990) Fullerton, A.W. 1990, Ph.D. thesis, Univ. Toronto
- Fullerton, Gies & Bolton (1996) Fullerton, A. W., Gies, D.R & Bolton, C.T. 1996, ApJS 103, 475
- Fullerton, Massa & Prinja (2006) Fullerton, A.W., Massa, D., & Prinja, R.K. 2006, ApJ, 637, 1025
- Hamann (1980) Hamann, W.-R. 1980, A&A 84, 342
- Haser (1995) Haser, S.M. 1995, PhD thesis, Univ Munich
- Heger et al (2003) Heger A., et al. 2003, ApJ, 591, 288
- Hillier et al (1998) Hillier, D.J., Miller, D.L., 1998, ApJ, 496
- Hoffleit & Jaschek (1982) Hoffleit, D. & Jaschek, C. 1982, The Bright Star Catalogue, New Haven: Yale University Observatory (4th edition)
- Kaper et al (1996) Kaper, L., Henrichs, H.F., Nichols, J.S., Snoek, L.C., Volten, H., & Zwarthoed, G.A.A. 1996, A&AS, 116, 257
- Kaper et al (1997) Kaper, L., et al. 1997, A&A, 327, 281
- Kaufer et al (2006) Kaufer, A., Stahl, O., Prinja, R.K., & Witherick, D., 2006, A&A, 447, 325
- Lamers et al. (1988) Lamers, H.J.G.L.M., Snow, Th., de Jager, C., & Langerwere, A. 1988, ApJ, 325, 342
- Markova & Valchev (2000) Markova, N., & Valchev, T. 2000, A&A, 363, 995
- Markova (2002) Markova, N. 2002, A&A, 385, 479
- Markova et al. (2004) Markova, N., Puls, J., Repolust, T., & Markov, H. 2004, A&A, 413, 693
- Markova et al (2005) Markova, N., Puls, J., Scuderi, S., & Markov, H. 2005, A&A, 440, 1133
- Morel et al. (2004) Morel, T., Marchenko, S.V., Pati, A.K., Kuppuswamy, K., Carini, M.T., Wood, E., Zimmerman, R. 2004, A&A, 215, 45
- Musaev & Snezhko (1988) Musaev, F.A. & Snezhko, L.I. 1988 SvAL, 14, 68
- Pauldrach et al. (2001) Pauldrach, A.W.A., Hoffmann, T.L., & Lennon, M. 2001, A&A, 375, 161
- Penny (1996) Penny, L.R. 1996, ApJ, 463, 737
- Prinja, Massa & Fullerton (2002) Prinja, R.K., Massa, D., & Fullerton, A.W. 2002, A&A, 388, 587
- Prinja et al. (2004) Prinja, R.K., Rivinius, Th., Stahl, O., Kaufer, A., Foing, B. H., Cami, J., & Orlando, S. 2004, A&A, 418, 727
- Puls et al. (1996) Puls, J. et al. 1996, A&A, 305, 171
- Puls et al. (2005) Puls, J., Urbaneja, M. A., Venero, R., Repolust, T., Springmann, U., Jokuthy, A., & Mokiem, M. R. 2005, A&A, 435, 669
- Puls et al. (2006) Puls, J., Markova, N., Scuderi, S., et al., 2006, A&A, submitted
- Reid & Howarth (1996) Reid, A.H.N., & Howarth, I.D. 1996, A&A, 311, 616
- Repolust et al. (2004) Repolust, T., Puls, J., & Herrero, A., 2004, A&A, 415, 349
- Roberts et al. (1987) Roberts, D.H., Lehár, J., & Dreher, J.W. 1987, AJ, 93, 968
- Runacres & Blomme (1996) Runacres, M.C., & Blomme, R. 1996, A&A, 309, 544
- Schaller et al. (1992) Schaller, G., Schaerer, D., Meynet, G., & Maeder, A. 1992, A&AS, 96, 269
- Zeinalov & Musaev (1986) Zeinalov,S.K & Musaev, F.A. 1986 SvAl 12, 125
- Walborn (1973) Walborn, N.R. 1973, AJ, 78, 1067