AL 3 (BH 261): a new globular cluster in the Galaxy
Abstract
AL 3 (BH 261), previously classified as a faint open cluster candidate, is shown to be a new globular cluster in the Milky Way, by means of B, V and I Color-Magnitude Diagrams. The main feature of AL 3 is a prominent blue extended Horizontal Branch. Its Color-Magnitude Diagrams match those of the intermediate metallicity cluster M 5. The cluster is projected in a rich bulge field, also contaminated by the disk main sequence. The globular cluster is located in the Galactic bulge at a distance from the Sun d⊙ = 6.00.5 kpc. The reddening is E(B-V)=0.360.03 and the metallicity is estimated to be [Fe/H] -1.30.25. AL 3 is probably one of the least massive globular clusters of the Galaxy.
1 Introduction
New globular clusters have been discovered or identified in the Galaxy in the last years. Recall Lyngå 7 (Ortolani et al. 1993; Tavarez & Friel 1995), Pyxis (Weinberger 1995; Da Costa 1995; Irwin et al. 1995; Sarajedini & Geisler 1996) and IC 1257 (Harris et al. 1997). The 2MASS survey has provided the two new globulars 2MASS-GC01 and 2MASS-GC02 (Hurt et al. 2000). Ortolani et al. (2000) identified ESO 280-SC06 as a halo globular cluster projected on the disk and previously classified as an open cluster. Kobulnicky et al. (2005) discovered GLIMPSE-C01 from inspection of Spitzer Space Telescope images. Carraro (2005) identified Whiting 1 (Whiting et al. 2002) as a young globular cluster in the halo. Finally, Willman et al. (2005) reported the discovery of SDSS J1049+5103, appearing to be a globular cluster or a dwarf galaxy in the outer halo.
Harris (1996) catalog of globular clusters (http://www.physics.mcmaster.ca/Globular.html), as updated in February 2003, contains 150 objects. Adding the three new objects from 2005, the number of galactic globular clusters amounts to 153.
AL 3 was discovered by Andrews & Lindsay (1967) and was also cataloged as BH 261 by van den Bergh & Hagen (1975). It also appears in the ESO/Uppsala catalogue (Lauberts 1982) as ESO 456-SC78. Its angular size was estimated to be 1.5’. The cluster was recently observed by Carraro et al. (2005) using CCD images of 4.1’4.1’, centered on the object, but they concluded from Color-Magnitude Diagrams (CMDS) that no cluster was present.
In the present study we show it to be the 154th globular cluster in the Galaxy. We measured the cluster center by means of DSS/XDSS images and found that it is located at J2000 = 18h14m06.6s, = 28o, with Galactic coordinates l = 3.36o, b = 5.27o. In Sect. 2 the observations and reductions are described. In Sect. 3 Color Magnitude Diagrams (CMD) are presented and parameters are derived. Concluding remarks are given in Sect. 4.
2 Observations
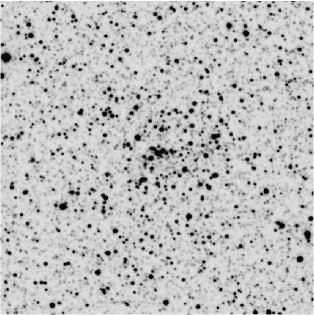
AL 3 was observed on 2000 March 6 with the 1.54m Danish telescope at ESO (La Silla). A Loral/Lesser CCD detector C1W7 with 20522052 pixels, of pixel size 15 m was used. A pixel corresponds to on the sky, and the full field of the camera is . Images in B (3 min.), V (1 and 3 min.) and I (10 and 40 sec.) were obtained, under a seeing of 1.2”. In Fig. 1 is shown a 3 min exposure of AL 3 for a field extraction of 3.3’3.3’ (510510 pixels). The image suggests a small concentration of stars (24”12”) surrounded by a halo of fainter stars. The overall appearance is similar to that of the bulge globular cluster NGC 6540 (Bica et al. 1994), but somewhat fainter.
Daophot II (Stetson 1987) was used to extract the instrumental magnitudes. For calibrations we used Landolt (1983, 1992) standard stars. The calibration equations are: = 26.46 + 0.01 () + ; = 26.40 + 0.1 () + ; = 24.61 - 0.01 () + , for 10 sec. and 15 sec. respectively, at 1.25 airmasses. Zero point errors are dominated by the transfer from aperture to Daophot PSF fitting magnitudes and CCD shutter time uncertainties. Atmospheric extinction errors are smaller since AL3 and standards were observed at comparable airmasses. Transfer errors arise from noise in the stellar profile growth curve due to crowding (1 star per 70 pixels). This contaminates stellar wings even for the brightest and relatively isolated stars. We investigate 3 methods: (i) Statistical reconstruction of the growth curve in small radius bins for the best 100 stars per band. (ii) Analysis of a few relatively isolated bright stars subtracting contaminating stars (CS) with the PSF. (iii) Growth curve analysis using models (Diego 1985). Method (i) gives the smallest errors (0.02 to 0.03 mag.), while in method (ii) subtraction residuals increase noise in the star wings. This is caused by possible underestimates of the sky around the CSs or to PSF deviations for faint stars and steeper profiles. Method (ii) should be free of statistical errors. It agrees with method (iii) within a few hundredths of mag. for Lorentzian profiles. Gaussian profiles show 5The CCD shutter time uncertainties (0.3 sec) related to short exposures done for standard stars, lead to an additional 3% error, which is propagated to the calibrations of the long exposure cluster frames. The final magnitude zero point uncertainty is estimated to be 0.05 mag. The atmospheric extinction was corrected with the La Silla standard coefficients.
3 Color Magnitude Diagrams
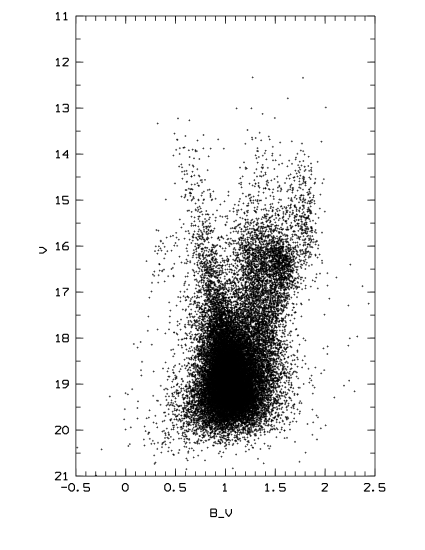
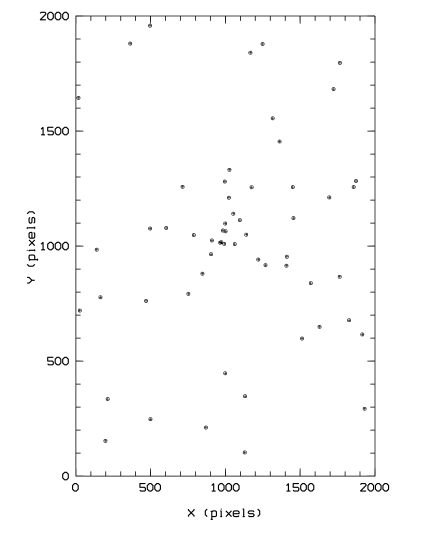
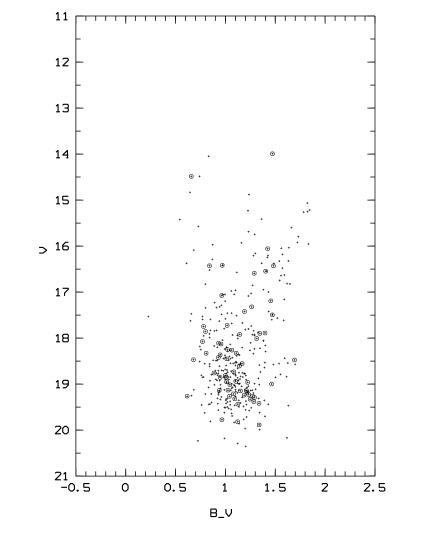
Fig. 2 shows the vs. CMD of the full field. It is a typical bulge CMD similar to that of Baade’s Window (e.g. Terndrup 1988). The prominent features are a bulge red Horizontal Branch (HB) at V 16.5, 1.5, a metal-rich Red Giant Branch (RGB) with a turnover such as in NGC 6553 (Ortolani et al. 1990), a disk blue main sequence, and a blue extended HB with an overdensity at V=16, =0.4. In Fig. 3 we show the spatial distribution across the whole field of the stars in a box encompassing the blue HB in the CMD. The blue HB stars are centrally concentrated revealing a globular cluster. We study the stellar density profile derived from the BHB stars of Fig. 3, which are relatively free of contamination. The limiting radius (where the density profile mergers the background) is rlim=3.4 0.4 . The tidal radius must be larger since some BHB stars reach the field borders (Fig. 3). Low statistics precludes a King profile fit and deeper images using field decontaminated TO and MS stars would be necessary to explore the possibility of post-core collapse. From the observed density profile we estimate a half-density radius rhd=1 -1.5 .
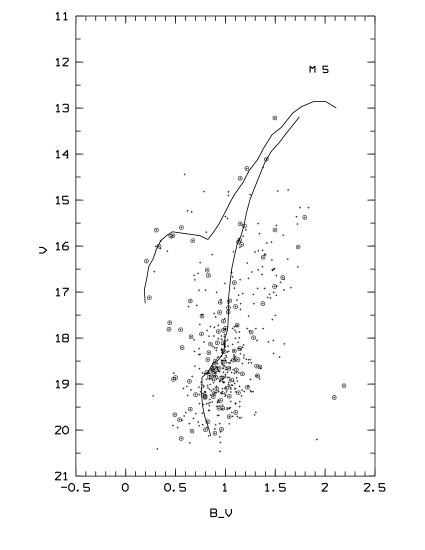
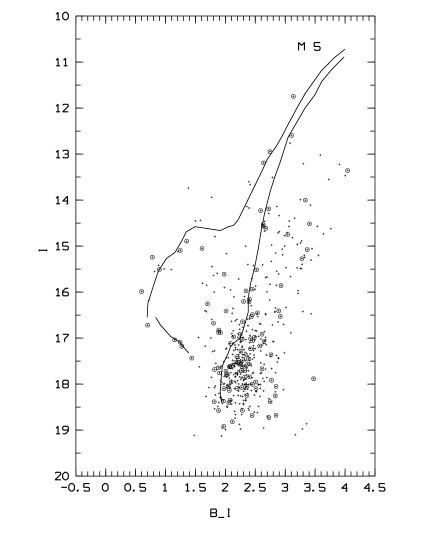
Fig. 4 shows a V vs. CMD for a cluster extraction of r120 pixels (r47”) and overimposed a more central one with r53 pixels (r21”), of the same order of the core seen in Fig. 1. A few giants are present, which is typical of Palomar clusters, and the turnoff (TO) seems to be reached near the photometry limit. Coordinates of the giants are available under request. As comparison the mean locus of M5 ([Fe/H]=-1.27, Harris 1996) is superimposed. This mean locus was obtained from data taken in the same observing run, and it is very similar to that of Sandquist et al. (1996). The CMD of a globular cluster is clearly seen for AL 3, with a blue Horizontal Branch, a few giants, and a populated subgiant branch. The overall fit of M5 mean locus indicates that AL 3 has a similar metallicity of [Fe/H]=-1.30.25.
In Fig. 5 the V vs. offset field at 4’ north corresponding to an extraction of r120 pixels (r47”) and overimposed a more central one with r53 pixels (r21”), is shown. It shows two small area samplings dominated by the bulge population. A comparison of Figs. 3 and 4, shows that the evolutionary sequences are very different. For r53 pixels (r21”), we have 64 stars in the field, and 108 in the cluster area, showing about a 4 excess. In the r120 pixels (r47”), we have 364 stars in the field, and 491 in the cluster area, showing about a 7 excess. We conclude that undoubtedly we are dealing with a star cluster. V vs. CMDs for cluster and field indicate essentially the same features and conclusions.
Intermediate metallicity bulge globular clusters that are relatively depleted in giants, with blue extended HBs are in general related to post-core collapse structure (Fusi Pecci et al. 1993; Trager et al. 1995). Examples are NGC 6522 (Barbuy et al. 1994; Terndrup et al. 1998), NGC 6540 (Bica et al. 1994), HP 1 (Barbuy et al. 2006; Ortolani et al. 1997) and NGC 6558 (Rich et al. 1998). AL 3 appears to be one more such cluster.
Fig. 6 shows I vs. for the same extractions as in Fig. 4, where again the M5 mean locus is superimposed. The blue stragglers stars (BSS) sequence of M5 is also shown, indicating that some BSS are present in AL 3. The good fit of the BSS locus between AL 3 and M5 suggests a comparable age for the clusters. Despite not having a clear turn-off (TO) locus, the locus of BSS is a prolongation of the main sequence, providing information on the TO location.
3.1 Reddening and distance for AL 3
The fit of M5 sequences to those of AL 3 in Fig. 4 gives VHB = 15.70.2 for the brightest part of the BHB. The color of the RGB at the HB level is = 1.160.05. The difference with respect to the fit with M5 is (B-V) = 0.33, so that the reddening of AL 3 is E(B-V)=0.36 considering E(BV) = 0.03 for M5 (Harris 1996). Adopting R = 3.1 we obtain AV = 1.12, and using M = 0.7 suitable for the cluster metallicity (Buonanno et al. 1989), there results (m-M)o = 13.9, and the distance to the Sun d⊙ = 6.00.5 kpc for AL 3. Assuming the distance of the Sun to the Galaxy center to be R⊙ = 8.0 kpc (Reid 1993), the Galactocentric coordinates are X = -2.0 kpc (X 0 is on the other side of the Galaxy), Y = 0.35 kpc and Z = 0.55 kpc. The distance from the Galactic center is RGC = 2.1 kpc, thus AL 3 is an inner bulge cluster, and should be incorporated to the sample of Barbuy et al. (1998), both in terms of angular and radius separation from the center. Bica et al. (2006) derived a distance of the Sun to the Galaxy center of R⊙ = 7.2 kpc, using globular clusters. In this case, X = -2.0 kpc, Y = 0.35 kpc and Z = 0.55 kpc, and RGC = 1.2 kpc, and AL 3 is even closer to the center.
We estimated the cluster observed integrated magnitude in the V 60 sec. image, by flux integration within r 120” and subtraction of the background measured around the cluster in a factor 6 larger area. The sky background error is 5%, while the average cluster flux is only 10% above the background. We derived Vt=11.0 0.4 and with reddening and distance values as above we obtained MV=-4.00.45 for AL 3. Comparing to Harris s (1996) compilation we conclude that AL 3 is among the intrisically faintest globular clusters, only somewhat more luminous than AM 4, Pal 1, E3 and Pal 13.
4 Concluding remarks
We identified the object AL 3 discovered by Andrews & Lindsay (1967) as a new globular cluster in the Galaxy. Since the discovery of Djorgovski 1, and identification of ESO 456-SC38 and NGC 6540 (Djorgovski 1987), AL 3 is the next inner bulge globular cluster identified. We find a metallicity of [Fe/H] -1.30.25. It is located in the inner bulge, at a distance d⊙ = 60.5 kpc. It appears to be another bulge intermediate metallicity globular cluster, with a blue extended Horizontal Branch, and a depleted red giant branch (Rich et al. 1998). AL 3 Color-Magnitude Diagrams suggest that the cluster may have about 10 giants, similar to Palomar 13 (Siegel et al. 2001), and somewhat more massive than AM 4 which has no giants and a mass less than 1000 M⊙ (Inman & Carney 1987). We are dealing with one of the least massive globular clusters, similar to several Palomar clusters. The contrast in metallicity between AL 3 and the bulge made possible the identification of the cluster, a metal rich globular cluster in the same conditions would be indistinguishable from the bulge population. Other faint globular clusters may still be found in the bulge. AL 3, as a new intermediate metallicity globular cluster located in the bulge, is another interesting target for abundance determinations and chemical enrichment studies of the Galaxy.
References
- (1) Andrews, A.D., Lindsay, E.M. 1967, IrAJ, 8, 126
- (2) Barbuy, B., Ortolani, S., Bica, E. 1994, A&A, 285, 871
- (3) Barbuy, B., Zoccali, M., Ortolani, S. et al. 2006, A&A, 449, 349
- (4) Bica, E., Ortolani, S., Barbuy, B. 1994, A&A, 283, 67
- (5) Bica, E., Bonatto, C., Barbuy, B., Ortolani, S. 2006, A&A, 450, 105
- (6) Buonanno, R., Corsi, C.E., Fusi Pecci, F. 1989, A&A, 216, 80
- (7) Carraro, G. 2005, ApJ, 621, L61
- (8) Carraro, G., Janes, K.A., Eastman, J.D. 2005, MNRAS, 364, 179
- (9) Da Costa, G.S. 1995, PASP, 107, 937
- (10) Diego, F. 1985, PASP, 97, 1209
- (11) Djorgovski, S. 1987, ApJ, 317, L13
- (12) Fusi Pecci, F., Ferraro, F.R., Bellazzini, M. et al. 1993, AJ, 105, 1145
- (13) Harris W.E., 1996, AJ 112, 1487 (H96)
- (14) Harris W.E., Phelps R.L., Madore B.F., et al. 1997, AJ 113, 688
- (15) Hurt R.L., Jarrett T.H., Kirkpatrick J.D. et al., 2000, AJ, 120, 1876
- (16) Inman, R.T., Carney, B.W. 1987, AJ, 83, 1166
- (17) Irwin M.J., Demers S., Kunkel W.E., 1995, ApJ 453, L21
- (18) Kobulnicky, H.A., Monson, A.J., Bickalew, B.A. et al. 2005, AJ, 129, 239
- (19) Landolt A.U., 1983, AJ 88, 439
- (20) Landolt, A.U., 1992, AJ 104, 340
- (21) Lauberts, A. 1982, ESO/Uppsala Survey of ESO(B) Atlas, ESO, Garching
- (22) Ortolani, S., Barbuy, B. Bica, E. 1990, A&A, 236, 362
- (23) Ortolani, S., Bica, E., Barbuy, B. 1993, A&A , 273, 415
- (24) Ortolani, S., Bica, E., Barbuy, B. 1997, MNRAS, 284, 692
- (25) Ortolani, S., Bica, E., Barbuy, B. 2000, A&A, 361, L57
- (26) Reid, M., 1993, ARA&A 31, 345
- (27) Rich, R.M., Ortolani, S., Bica, E., Barbuy, B. 1998, AJ, 116, 1295
- (28) Sandquist, E., Bolte, M., Stetson, P.B. et al. 1996, ApJ, 470, 910
- (29) Sarajedini A., Geisler D. 1996, AJ 112, 2013
- (30) Siegel, M.H., Majewski, S.R., Cudworth, K.M., Takamiya, M. 2001, AJ, 121, 935
- (31) Stetson, P. B. 1987, PASP, 99, 191
- (32) Tavarez M., Friel E.D., 1995, AJ 110, 223
- (33) Trager, S., King, I.R., Djorgovski, S. 1995, AJ, 109, 218
- (34) Terndrup, D.M. 1988, AJ, 96, 884
- (35) Terndrup, D.M., Popowski, P., Gould, A. et al. 1998, AJ, 115, 1476
- (36) van den Bergh, S., Hagen, G.L. 1975, AJ, 80, 11
- (37) Weinberger R. 1995, PASP 107, 58
- (38) Whiting, A.B., Hau, G.K.T., Irwin, M. 2002, ApJS, 141, 123
- (39) Willman, B., Blanton, M.R., West, A.A. et al. 2005, AJ, 129, 2692