FUSE Observations of HD 5980: The Wind Structure of the Eruptor111Based on observations made with the NASA-CNES-CSA Far Ultraviolet Spectroscopic Explorer. FUSE is operated for NASA by the Johns Hopkins University under NASA Contract NAS5-32985.
Abstract
HD 5980 is a unique system containing one massive star (star A) that is apparently entering the luminous blue variable phase, and an eclipsing companion (star B) that may have already evolved beyond this phase to become a Wolf-Rayet star. In this paper we present the results from FUSE observations obtained in 1999, 2000, and 2002 and one far-UV observation obtained by ORFEUS/BEFS in 1993 shortly before the first eruption of HD 5980. The eight phase-resolved spectra obtained by FUSE in 2002 are analyzed in the context of a wind-eclipse model. This analysis shows that the wind of the eruptor obeyed a very fast velocity law in 2002, which is consistent with the line-driving mechanism. Large amplitude line-profile variations on the orbital period are shown to be due to the eclipse of star B by the wind of star A, although the eclipse due to gas flowing in the direction of star B is absent. This can only be explained if the wind of star A is not spherically symmetric, or if the eclipsed line radiation is “filled-in” by emission originating from somewhere else in the system, e.g., in the wind-wind collision region. Except for a slightly lower wind speed, the ORFEUS/BEFS spectrum is very similar to the spectrum obtained by FUSE at the same orbital phase: there is no indication of the impending eruption. However, the trend for decreasing wind velocity suggests the occurrence of the “bi-stability” mechanism, which in turn implies that the restructuring of the circumbinary environment caused by the transition from “fast, rarefied wind” to “slow, dense wind” was observed as the eruptive event. The underlying mechanism responsible for the long-term decrease in wind velocity that precipitated this change remains an open issue.
1 Introduction
HD 5980 (Sk 78, AV 229) is the most luminous eclipsing binary system in the Small Magellanic Cloud (SMC) and a member of the young stellar cluster NGC 346. It is an ideal object for studying interacting winds and the evolution of very massive stars in binaries. The system achieved notoriety in 1994, when its primary star (hereafter star A; M50 ) was discovered to be undergoing an eruptive event of a yet-undetermined nature. Although the system had been monitored since the early 1980s, the sudden brightening by 2 magnitudes in late 1993 went unrecorded except for the visual estimates of A. Jones (Bateson & Jones, 1993). An intensive ultraviolet (UV) monitoring campaign was initiated in mid-1994, and this database provides a unique record of the declining phase of the outburst. However, the most intriguing question that HD 5980 raises involves the mechanism responsible for the eruption. We know that between 1987 and 1995 its UV spectrum went successively through all the “late” nitrogen Wolf-Rayet (WR) classes – WN6 WN7 WN8 WN11 WN6 – while also exhibiting significant changes in wind velocity and visual brightness; see Koenigsberger (2004) for a general review. Although some of the characteristics of the eruption are similar to those observed in Luminous Blue Variables (LBVs), both its extraordinary luminosity ( ) and its increase in luminosity during eruption ( ; Drissen et al., 2001) place it in a category currently shared only with Carinae.
The second component of the eclipsing system (hereafter star B; M28 ) also appears to be a WR star. It has been difficult to isolate its spectral characteristics from the combined spectrum; see Koenigsberger (2004) for a discussion of this issue, which is further complicated by the possibility that some emission at line frequencies arises in a wind-wind colliding region (Moffat et al., 1998). If star B is indeed a WNE star, then it is the evolved remnant of the originally more massive star of the binary system, and is therefore a good pre-supernova candidate. Alternately, it could simply be a less massive star whose outer layers have been significantly modified by a mass-transfer process, which has led to the current state of star A.
The spectrum of HD 5980 indicates the presence of a third star. It can be seen in the continuum (Breysacher & Perrier, 1991), in the optical spectra obtained in the 1980s (Niemela, 1988), and in the “stationary” UV photospheric lines that are visible in HST/STIS spectra (Koenigsberger et al., 2002). This component (hereafter star C) is likely to be an O4–6 supergiant that could be gravitationally bound to the star Astar B pair with a very long orbital period. Thus, it might be responsible for the instability of the system (Koenigsberger et al., 1994). Alternately, star C could simply be a line-of-sight object whose light contaminates the spectrum of the HD 5980 system. The presence of this third star complicates the interpretation of an already complicated system. However, because the evolution of massive stars plays such an important role in many astrophysical phenomena, it is important to understand the mechanisms responsible for the peculiar behavior of HD 5980.
In this paper, we analyze a set of phase-resolved spectroscopic observations of HD 5980 obtained with the Far Ultraviolet Spectroscopic Explorer (FUSE) satellite. These data were obtained over an interval spanning many orbital cycles, but include a subset of 8 observations taken over 6 orbits, which permit orbital changes in the structure of the wind of star A to be assessed. In addition, we use an archival spectrum obtained by ORFEUS shortly before HD 5980 erupted. This fortuitous observation constrains the time scale for the development of the instability leading to the eruptions. Our analysis is organized as follows. In §2, we describe the observational material. The FUSE light curve is presented in §3, while the far-UV spectrum of HD 5980 and its orbital variability are discussed in §4. In §5 we analyze the orbital variations in terms of a wind-eclipse model, and discuss the implications. Additional discussion and our conclusions are presented in §6.
2 Observations and Data Analysis
2.1 Observational Material
HD 5980 has been observed several times with FUSE, though only those observations obtained during program P223 (PI: D. Massa) provide phase-resolved coverage. Program P223 produced 8 observations that are well distributed in orbital phase, which were obtained over an interval of 116 days (i.e., 6 consecutive orbital cycles) in 2002. Spectra from program P223 were supplemented by two snapshots of HD 5980, one of which was obtained as an early-release observation (observation X0240202; PI: J. B. Hutchings), while the other was obtained as part of a PI-Team program to investigate the interstellar medium (observation P1030101; PI: K. R. Sembach).
Table 1 provides details of the FUSE observations of HD 5980. Successive columns list the name of the data set; the heliocentric Julian date (HJD) at the beginning of the integration; the total integration time; the orbital phase at the start of the observation, which was computed from the ephemeris of Sterken & Breysacher (1997); the mean flux and the standard deviation in a fiducial continuum band; and the implied signal-to-noise ratio. All the FUSE spectra of HD 5980 were obtained through the large (LWRS) aperture. Observation X0240202 was obtained in histogram (HIST) mode; all the others were obtained in time-tag (TTAG) mode.
In addition to the FUSE spectra of HD 5980, a spectrum obtained on 1993 September 17 by the Berkeley Extreme and Far-UV Spectrometer (BEFS) on-board ORFEUS was retrieved from the Multimission Archive at the Space Telescope Science Institute (MAST222The archiving of non-HST data at MAST is supported by the NASA Office of Space Science via grant NAG5-7584 and by other grants and contracts. STScI is operated by the Association of Universities for Research in Astronomy, Inc., under NASA contract NAS5-26555.). Details of this observation are also listed in Table 1. This spectrum was obtained only 51 days before the eruption of HD 5980 began, and is the only UV spectrum that records the characteristics of the system at this crucial time. An additional stroke of luck is that the ORFEUS/BEFS spectrum was obtained at , i.e., just after primary eclipse, when star A is “in front” of its companion. Hence the P Cygni absorption components in this spectrum reflect the wind conditions of the eruptor (star A). However, the ORFEUS/BEFS spectrum has poorer wavelength resolution and signal-to-noise (S/N) than the FUSE spectra. The spectrum obtained from MAST was not processed further, although a wavelength shift of approximately km s-1 was applied in order to align interstellar features with their counterparts in the FUSE spectra.
Finally, as described below, our analysis of HD 5980 was supplemented by FUSE spectra of two other stars in the SMC: Sk 80 (AV 232; O7 Iaf; see Crowther et al., 2002) and Sk 108 (AV 332; WN4:O6.5 I:; see Mallouris, 2003). These observations were obtained in TTAG mode through the LWRS (Sk 80) or MDRS (Sk 108) aperture. Additional details for these observations are also provided in Table 1.
2.2 Processing of FUSE Spectra
The instruments on-board the FUSE satellite consist of four aligned, prime-focus telescopes and Rowland circle spectrographs (Moos et al., 2000; Sahnow et al., 2000). Two of these ”channels” are coated with LiF to provide high efficiency longward of 1000 Å, while the other two are fabricated from SiC to give high throughput between the Lyman limit and 1100 Å. The spectra are recorded by two photon-counting detectors, each of which consists of two segments. Thus, a FUSE observation produces 8 independent spectra, which are labelled by their channel (LiF1, LiF2, SiC1, SiC2) and their detector segment (A or B). Except for a small region near 1100 Å, the entire FUSE waveband is redundantly covered by 2–4 of these spectra.
The FUSE spectra were uniformly extracted and calibrated with the standard reduction pipeline (CalFUSE version 2.4.1). Subsequent processing steps combined the 8 individual spectra from a given observation into a single spectrum. Since the different spectra have inherently different quality (due to the different effective areas of each channel) and suffer from instrument artifacts to differing degrees (e.g., thermally induced channel misalignment), these manipulations were conducted interactively in three steps.
First, residual zero-point shifts in the wavelength scales for the different spectra were removed by comparing the observed positions of H2 lines formed in the interstellar medium of the Galaxy with the laboratory wavelengths listed by Jenkins & Peimbert (1997). The corrections derived in this way were applied to each spectrum individually. The corrections for data from the SiC channels were always smaller than 0.25 Å, while for LiF data they were in general smaller than 0.03 Å. The overlapping regions of spectra from different channels and detector segments were checked carefully to ensure that the resultant wavelength scales were consistent. When necessary, the spectra were trimmed to minimize the effect of nonlinearities in the wavelength scale due to residual distortion near the edges of detector segments.
Second, the aligned spectra were inspected visually. In general, only the highest quality data for any particular wavelength interval were retained for the merged spectrum. Gaps in wavelength coverage were filled with data of poorer quality only when necessary. LiF2A spectra were favored over LiF1B spectra for coverage longward of 1100 Å because the flux calibration of LiF1B spectra is severely compromised by an optical artifact known as “the worm” (Sahnow, 2003).
Third, the aligned, trimmed, and hand-selected spectra from the various channels and detector segments were combined by using the IRAF333IRAF is distributed by the National Optical Astronomy Observatories, which are operated by the Association of Universities for Research in Astronomy, Inc., under cooperative agreement with the National Science Foundation. routine scombine. The spectra contributing to the final, combined data product were assigned equal weights (w 1) except for SiC1A spectra, which were given w0.25 because of their poorer quality. Finally, the data were rebinned to a constant wavelength step of 0.05 Å.
Seven of the eight P223 observations of HD 5980 were combined to produce a global mean reference spectrum for the P223 data set. This average spectrum has S/N 40 per data sample in the continuum near 1000 Å. Observation P2230103 (0.124) was excluded because detector 1 was not operating at full voltage for the entire exposure, so that spectra extracted from it (i.e., LiF1A, LiF1B, SiC1A, SiC1B) were anomalously noisy.
2.3 Far-UV Continuum Fluxes
Continuum placement in spectra of WR stars is very uncertain for all UV wavelengths due to the number and breadth of emission and P Cygni wind profiles. Shortward of 1000 Å, the problem is aggravated by the large number of interstellar absorption lines, particularly from H2, and by the confluence of the Lyman series of atomic H. In addition, the spectrum of HD 5980 contains absorption from a velocity system associated with the foreground supernova remnant SNR00577226.444In the 1200–1800 Å spectral range, the velocity system of the SNR is at km s-1 and km s-1, and includes lines for ions ranging from O I to C IV (Koenigsberger et al., 2001). The same system has been detected in FUSE spectra of the O VI resonance doublet (Hoopes et al., 2001; Danforth et al., 2003).
Despite these complications, we identified several spectral bands that allow the continuum level to be defined reliably: e.g., 1010–1020 Å and 1055–1060 Å. In particular, the wavelength interval 1059.6–1060.6 Å is free from interstellar and photospheric lines. We used the average value of the flux over this interval, which we denote by , to characterize continuum variations of HD 5980 in the far-UV. The values of , along with the root-mean-square scatter over the continuum band [()], and the corresponding S/N ratio are provided in Table 1.
3 Far-Ultraviolet Light Curve of HD 5980
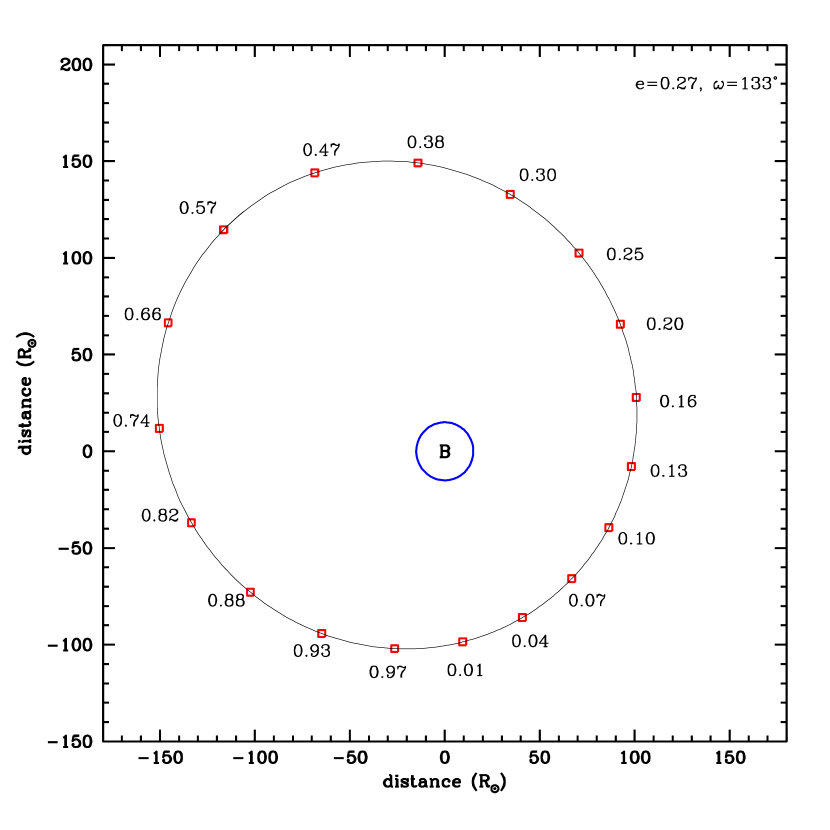
The orbital period of HD 5980 is 19.26540.0002 (Sterken & Breysacher, 1997). As indicated in Figure 1 (taken from Koenigsberger 2004), orbital phase is defined by the minimum of the primary eclipse; i.e., when star A eclipses star B. Owing to the substantial eccentricity of the orbit ( according to Breysacher & Perrier, 1991; Moffat et al., 1998; Kaufer et al., 2002, respectively), the secondary eclipse occurs at . The radius of star A prior to eruption (R ) and the radius of star B (R ) were determined by Breysacher & Perrier (1991) from analysis of the visual light curve. Since the orbital inclination is (Breysacher & Perrier, 1991), the visual continuum eclipse at 0.0 is total. However, the current radius of star A is uncertain. In 1994 December, Koenigsberger et al. (1998a) determined it to be R . An analysis of the contemporary light curve is needed to confirm the expectation that the radius of star A has been decreasing systematically over the intervening years.
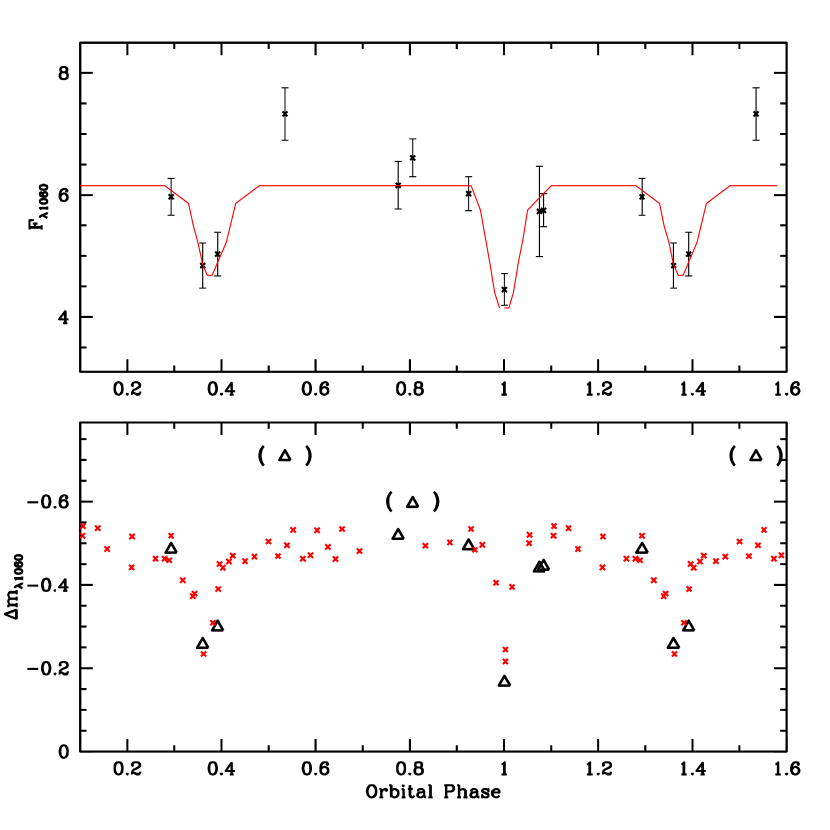
Our FUSE observations permit a far-UV light curve to be derived, which covers both eclipses. The top panel of Figure 2 plots from Table 1 as a function of orbital phase. The curve superposed on the data illustrates the predicted eclipse depths from the model described in §5. The bottom panel of Fig. 2 shows the differential magnitude of HD 5980 with respect to Sk 108 (large triangles), and also indicates the visual light curve determined by Breysacher & Perrier (1980, crosses). Although the number of far-UV data points is limited, there is generally good agreement between the far-UV and optical light curves, except for the FUSE data obtained in 1999 and 2000 (indicated by parentheses). Evidently the system was systematically brighter in these early observations compared with 2002, presumably because it was still declining from the maximum brightness attained during its 1994 eruption. The depths of the optical and far-UV eclipses at are similar, while at the far-UV eclipse seems to be deeper than the optical eclipse. However, given the large optical photometric variations detected on timescales of 6 hours, little more can be concluded from this single point at 0.
The ORFEUS/BEFS measurement of the far-UV continuum flux is the point in Fig. 2 at . Although it has the largest uncertainty of any of the measurements, its mean value agrees very well with that obtained at nearly the same orbital phase from FUSE spectrum P2230102. This agreement of pre- and post-outburst measurements separated by 8.9 years (168 orbital cycles) is very interesting, since it suggests that HD 5980 has returned to its pre-outburst state. In this context, it is interesting to note that even though the ORFEUS/BEFS spectrum was obtained shortly before the start of the eruption, the FUV continuum fluxes did not presage dramatic changes.
4 Far-UV Spectrum and Variability
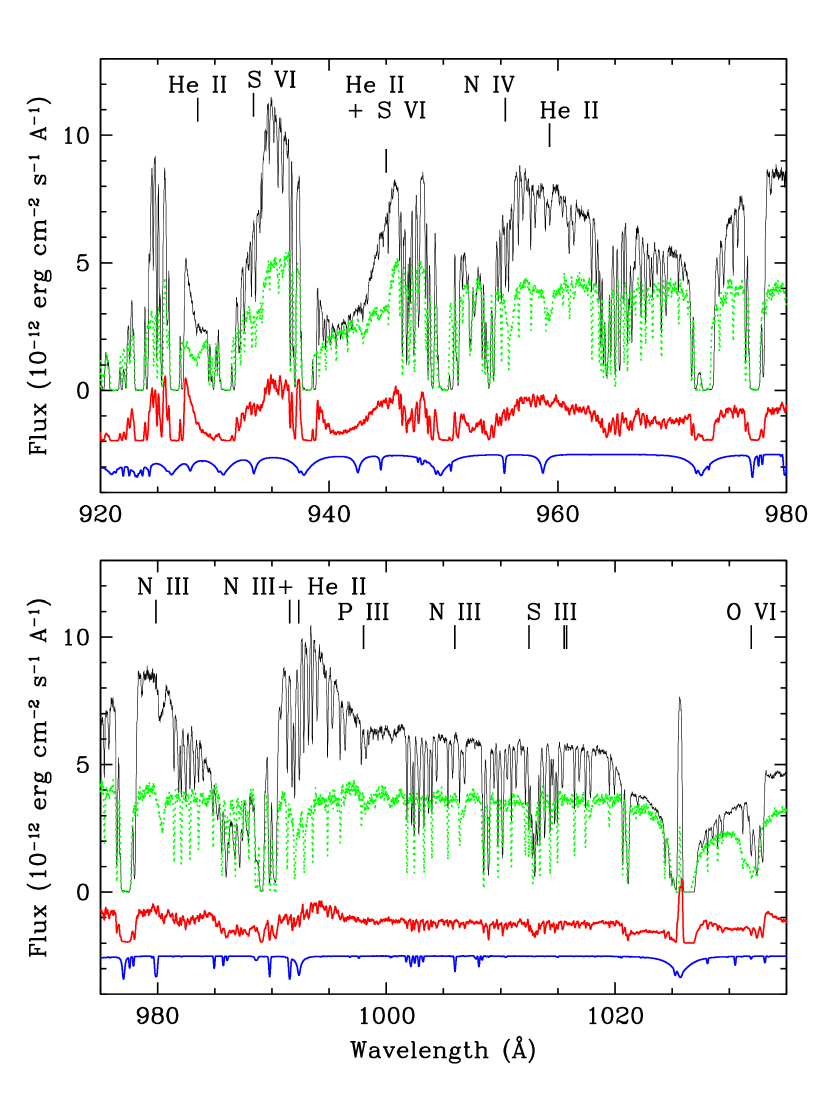
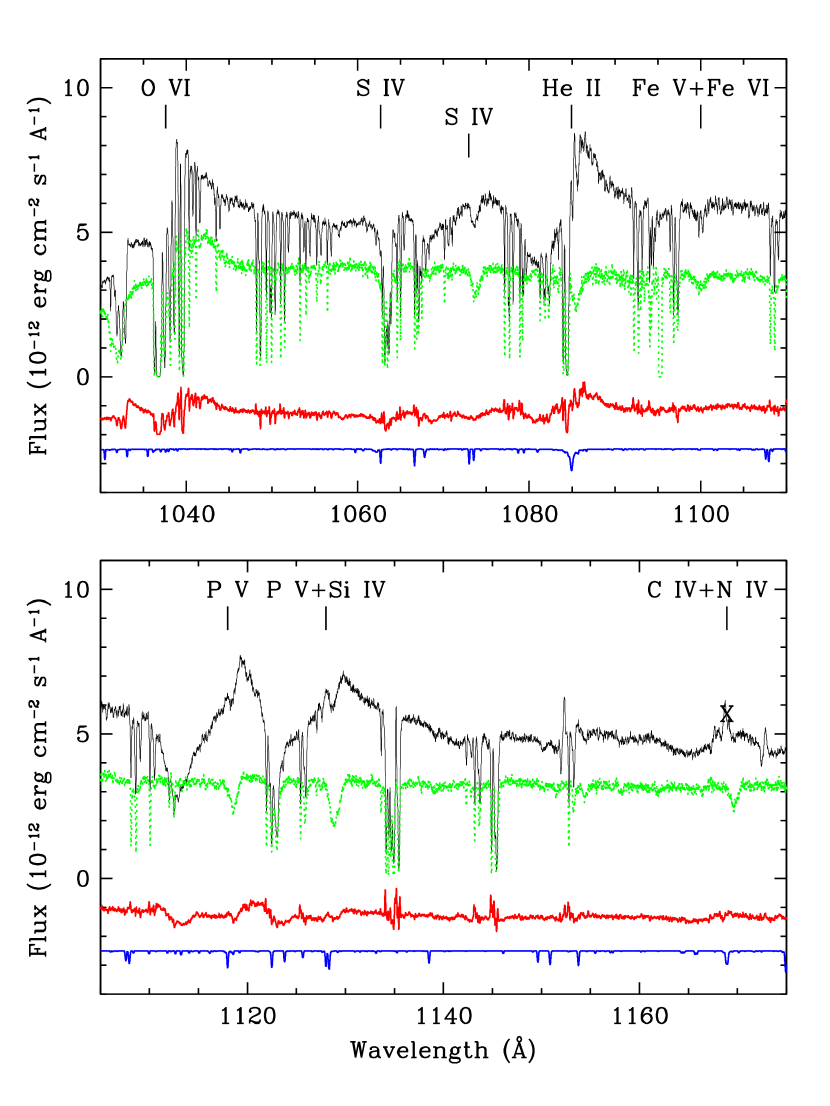
The average FUSE spectrum of HD 5980 is illustrated in Figures 3 and 4, where it is also compared with the spectrum of Sk 108 (dotted lines). Sk 108 is an ideal template for the analysis of HD 5980 because: 1) it is also in the SMC and is thus similarly affected by reddening; and 2) it consists of a WN4 star and an O6.5-supergiant (Foellmi et al., 2003), and should resemble the combined spectrum of star B star C. A striking difference between these objects is the number and intensity of emission lines in the far-UV spectrum of HD 5980. While the FUSE spectrum of Sk 108 has strong emission only in the O VI resonance doublet, the spectrum of HD 5980 exhibits emission features due to S VI, N IV, N III, He II, O VI, S IV, P V, and C IV.
Assuming that the combined spectrum of star B star C resembles the spectrum of Sk 108, then the source of the strong emission lines in HD 5980 must be star A and, possibly, the wind-wind collision (WWC) region. At longer UV wavelengths (1200 – 1700 Å), most emission lines are also dominated by star A (Koenigsberger, 2004), although star B appears to contribute significantly to the P Cygni features at N V 1240, C IV 1550, and He II 1640. One feature that is associated exclusively with star A (and, possibly, the WWC region) is the semi-forbidden N IV] 1486 line, which displays extremely large line-profile variations. These variations are usually interpreted in terms of a non-spherically symmetric line-emitting region.
In the FUSE wavelength region, the P V 1117, 1128 doublet presents a similar opportunity for isolating emission arising only in star A, with the advantage that these resonance lines produce strong P Cygni absorption components. For O-type stars, the intensity of the P V doublet is correlated with the stellar luminosity (Walborn et al., 2002), and the great strength of these lines in the spectrum of HD 5980 is consistent with the large luminosity derived for star A (Koenigsberger et al. (1998b, )).
We used the standard deviation of 7 of the 8 spectra obtained in 2002 to quantify the spectral variability of HD 5980. As shown in Figs. 3 and 4, the largest values of this dispersion coincide with the positions of strong emission lines. At most other wavelengths, the time variations have a base level of erg/s/cm2/Å, which reflects the continuum variations due to the eclipses but also includes cycle-to-cycle fluctuations. Smaller variations occur only at wavelengths that coincide with saturated absorption lines; e.g., the strong absorptions due to interstellar Lyman at 1025 Å.
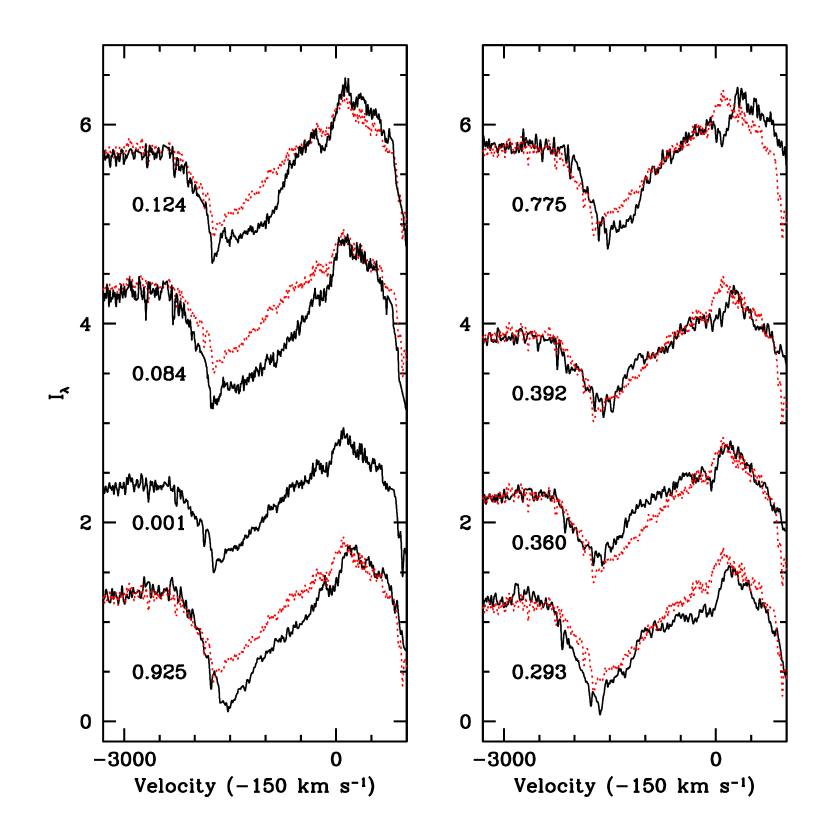
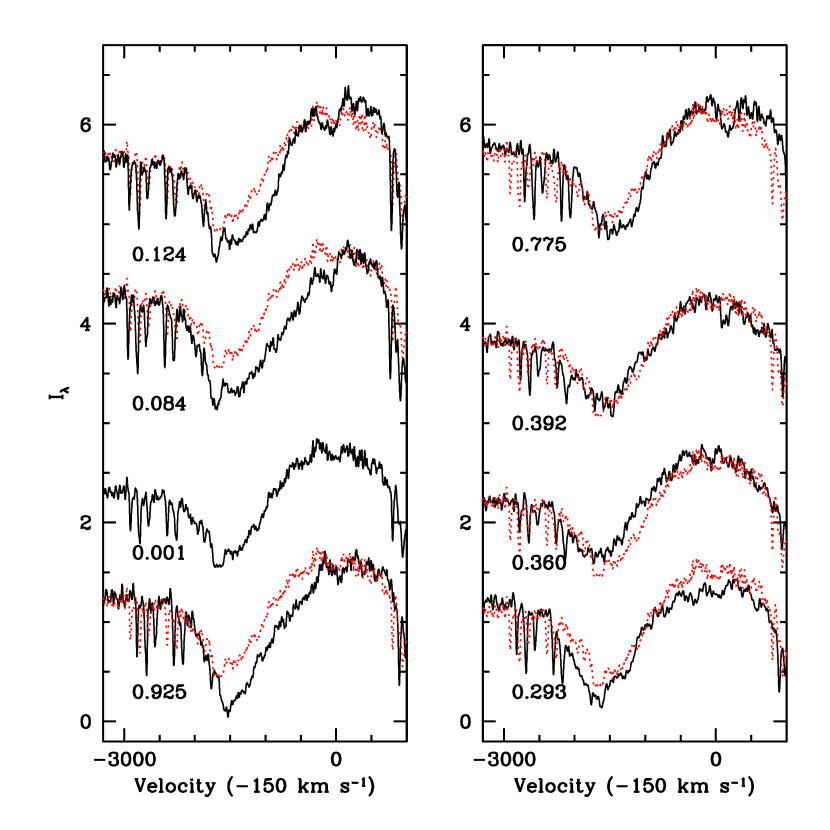
The P V 1117 line is only moderately affected by blending with other stellar and interstellar lines, and can thus be used to study line-profile variability in more detail. Figure 5 illustrates the orbital variations of P V 1117 for the eight FUSE spectra obtained in 2002. In this montage, the spectrum obtained near primary eclipse (P2230101; ) is used as a template against which variations in the other profiles are compared. In order to make this comparison meaningful, two systematic effects were allowed for. First, the profiles were shifted in velocity so that they represent the emission in the frame of reference of star A. The radial velocity curve of Niemela et al. (1997) was used to remove the orbital motion of star A. Second, the profiles were re-normalized with respect to the sum of the combined continua of star A star B. This was accomplished by removing the light of star C, which was assumed to contribute approximately 33% of the total continuum in the far-UV, as it does in the visual region of the spectrum (Breysacher & Perrier, 1980). By taking the observed continuum level at phases 0.124 and 0.775 as representative of the sum of all three continua, the contribution from star C was estimated to be erg/s/cm2/Å in the vicinity of the P V doublet. This value was subtracted from each of the spectra in turn. Finally, the 8 P V profiles were renormalized by dividing by the out-of-eclipse continuum level of star A star B ( erg/s/cm2/Å).
Fig. 5 indicates that the primary cause of line-profile variability in P V is the appearance of strongly enhanced absorption (with respect to ) in the P Cygni profile when star A is “in front” of star B. Conversely, when star A is eclipsed by star B at , the low-velocity part of the P Cygni absorption trough is weakened compared with primary eclipse. This clear pattern of behavior can be attributed to wind and stellar eclipses, as demonstrated by the model discussed in the next section.
5 Predicted Line Profile Variations from Eclipses
P Cygni profiles in the spectrum of a hot star are produced in an extended and rapidly expanding stellar wind. Variability in these lines can be used to diagnose: a) the presence of eclipses; b) aspherical geometry of the wind due, e.g., to collisions with the outflow from a companion star; and c) structural changes in the density, velocity, or ionization conditions in the wind. Eclipses and wind-wind collisions produce periodic variability on orbital timescales. Wind eclipses, in particular, may be used to derive information about the geometry and structure of the stellar winds of the components of an early-type binary system (Münch, 1950; Willis et al., 1979; Koenigsberger, 1990; Auer & Koenigsberger, 1994).
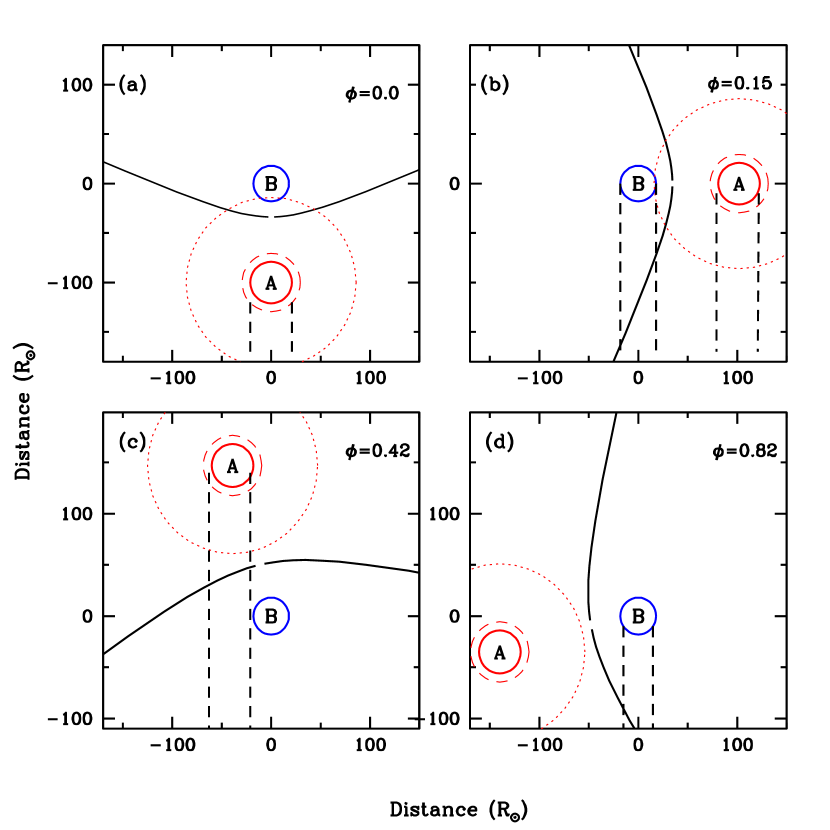
Figure 6 provides a representation of the star A star B binary system at four orbital phases, under the assumption that both stars possess stellar winds. The geometry of the shock cone produced by the collision of these outflows is approximated with the formalism developed by Cantó et al. (1996), with stellar wind velocities estimated by Koenigsberger (2004), (star A) 2000 km s-1, (star B) 2600 km s-1 and estimates for the mass-loss rates of , . These mass-loss rates should be taken as representative values only, since the only reliable determination was made shortly after the eruption in 1994 (Koenigsberger et al., 1998b; Drissen et al., 2001) and may be larger than during quiescent times. Furthermore, the wind velocity has varied significantly since the 1980s. We assume that the wind of star A consists of an inner region extending out to a distance , within which the atmosphere accelerates and approaches the maximum wind speed, . In Fig. 6, RA is represented by the circle traced by long dashes. Beyond , the wind expands at the constant speed . The wind that flows in the direction of the companion undergoes a highly supersonic shock when it encounters the companion’s outflow, which brakes the radial component of its motion and forces it to move along the working surface of the shocks. The kinematic properties of the shock surface are determined by the conservation of momentum in the hydrodynamical system; see, e.g., Cantó et al. (1996).
Fig. 6 illustrates that continuum radiation from star A or star B can traverse several physically distinct regions before leaving the system. Consider, e.g., the elongation illustrated in Fig. 6(b). Starting from star B, the short, dashed lines parallel to the line-of-sight cross in succession the wind of star B, the shock cone surface, and finally the wind of star A before reaching a distant observer located at the bottom of the figure. All these regions have velocity components in the direction of the observer, and therefore all contribute to the shape of the line profile at negative velocities, i.e., to the morphology of the absorption trough of a P Cygni profile from the binary system. Hence, while the emission component of the P Cygni profile contains contributions from large volumes of wind material, the contribution to the absorption trough is confined to the wind contained in the columns of material projected onto the stellar disks.
The discussion of wind-profile variability can be simplified if we choose a P Cygni line that is formed in the wind of star A but not in the wind of star B. We argued above that the WN4:O6.5 I: binary system Sk 108 should be a good template for the combined spectrum of star B and star C, since star B is believed to be a WNE star. Sk 108 lacks P Cygni emission due to P V and thus we assume that the entire P Cygni feature of P V in HD 5980 is attributable to star A. In this case, we expect to observe the intrinsic P Cygni absorption component of star A at orbital phase 0.00, when it fully eclipses its companion. At orbital phases immediately before and after 0.00, the continuum radiation of star B must traverse regions of the wind of star A to reach the observer. This is the “wind eclipse”. Because the wind of star A has velocity components in the direction of star B as well as in the direction of the observer, the wind eclipse causes an enhancement of the P Cygni absorption component and a reduction in the intensity of the emission component. The latter is due to absorption at positive velocities from the wind that is expanding toward star B. At 0.36, when star B eclipses star A, the P Cygni absorption component should be significantly reduced, since the column of wind material from star A where this absorption is produced is occulted by star B.
5.1 Model Calculation
These concepts can be quantified by computing synthetic line profiles with a simple radiative transfer code that includes the effects of continuum and wind eclipses (Auer & Koenigsberger, 1994; Flores et al., 2001). This program treats the radiative transfer using the Sobolev approximation only where this approximation is valid, and performs the exact integration of the radiative transfer equation in wind regions where the velocity gradient is too small to satisfy the Sobolev criterion. For simplicity, the model assumes spherically symmetric line-forming regions and neglects both wind-wind collision effects and scattering processes. The model profiles thus provide baseline information on the eclipse effects alone. Discrepancies between the observed and predicted line profile variations can be used to assess the importance of other phenomena not incorporated in the model (e.g., the wind of star B; wind-wind collisions; or an aspherical wind geometry).
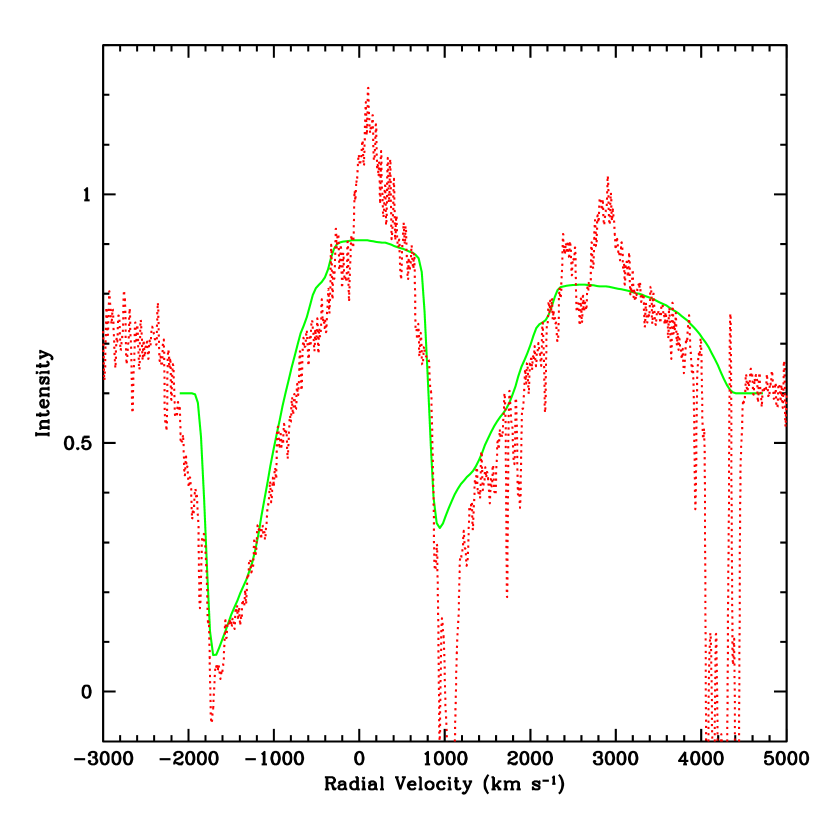
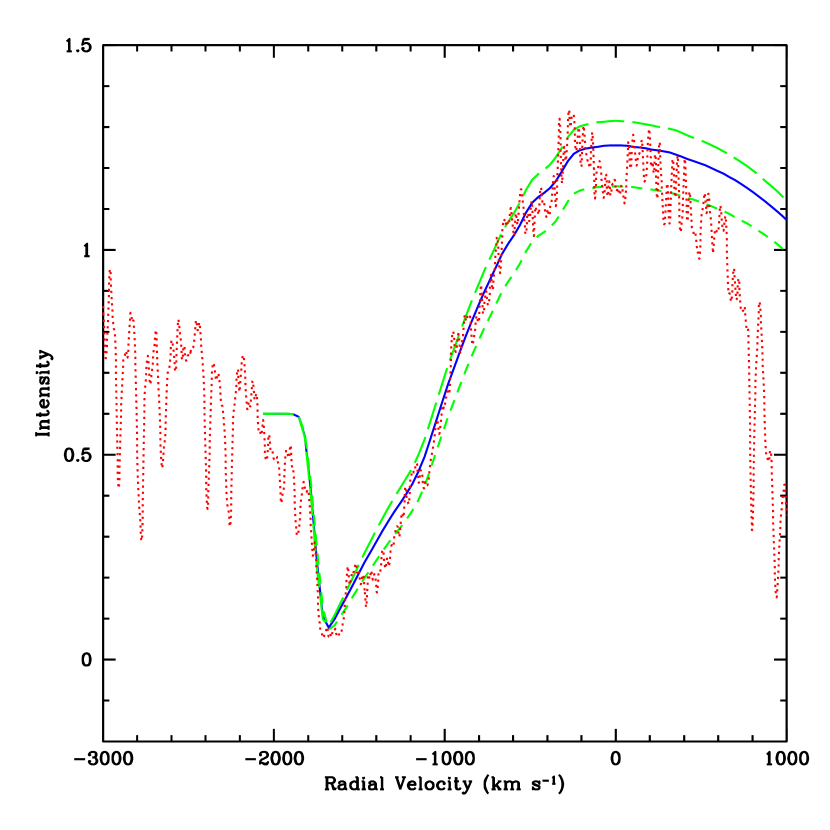
As before, we assume that the wind obeys a linear velocity law out to a distance , beyond which the velocity has the constant value .555All distances are expressed in units of the radius of star A, RA. All velocities are in units of the “turbulent velocity”, . In addition, we assume that the ionization structure is such that P V is present to a distance . The computer program allows for the possibility of a radial dependence of the ionization structure through the parameter , which is given by , where (r) is the opacity. Through a trial-and-error process, the free parameters of the model were adjusted until the general features of the P V 1117 line profile at 0.001 were reproduced. Emphasis was placed on trying to match the shape of the P Cygni absorption component. This was achieved with the set of input parameters labeled “Mp01-1” in Table 2. Figure 7 compares the synthetic line profile computed with these parameters for (solid line) with the observed profile.
A satisfactory match between the synthetic and observed P V P Cygni profile of star A could only be achieved with a very fast wind velocity law. Table 2 shows that the terminal speed, , of model Mp01-1 is achieved within RA. The consequences of varying are illustrated in the profiles plotted at the bottom of Fig. 7: a slower velocity (corresponding to RA) produces a P Cygni absorption trough that is too deep at low velocities (short dashes), while a faster velocity law (corresponding to RA) produces too little low-velocity absorption (long dashes). Since rapid acceleration (i.e., a “fast” velocity law) is a key feature of winds driven by radiation pressure in spectral lines, these results suggest that the current wind of star A is driven by this mechanism.
For a fixed opacity structure, the maximum extent of the line-emitting region, , determines the intensity of the line profile, since a larger volume contains a larger number of line-emitting ions. The consequences of varying are illustrated by the profiles in the upper section of Fig. 7. Since the long- and short-dashed curves bracket the plausible range of fits to the observed profile, we conclude that 3.3 RA 4.5 RA for the region emitting P V 1117 radiation.
The value of the terminal wind speed, 1750 km s-1, constrains the product . However, small values of produce very sharp and deep absorption at , contrary to what is observed. Instead, we find that values of of 70–80 km s-1 (which corresponds to 5% of ) are required to match the soft blue edge of the absorption trough. As a result, the “edge” velocity (i.e., the velocity where the blue edge of the absorption trough meets the continuum) is significantly faster than . This is a characteristic of strong P Cygni absorption troughs in O-type stars in general (Prinja et al., 1990). The occurrence of soft blue absorption edges is generally attributed to the presence of additional velocity dispersion in the wind, which is frequently characterized as “turbulence”. However, despite its widespread occurrence, the origin of this velocity dispersion is not known.
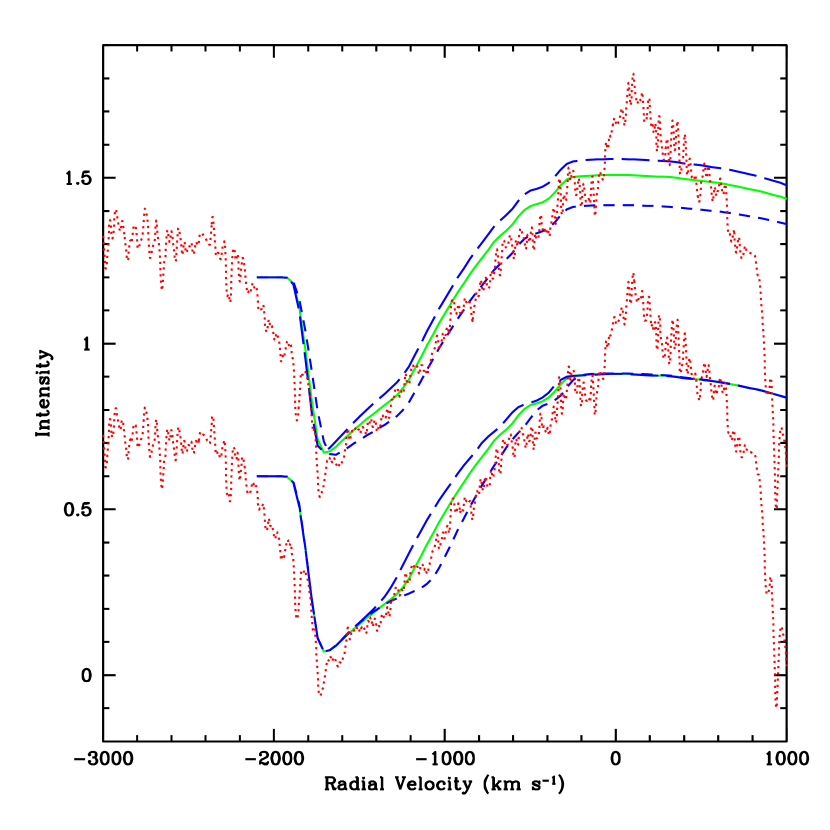
The other significant discrepancy between the model and the observed line profiles is the sharp emission peak near line center; see Fig. 7. The red component of the P V doublet at 1127 Å provides a built-in check of this discrepancy. Since the doublet separation (2693 km s-1) is greater than for star A (1660 km s-1; see Table 3), the two components are not radiatively coupled and can be treated independently. The oscillator strength of red component of the P V doublet is half that of the blue component, so the model profile for P V 1127 was calculated with half the opacity, , listed for Mp01-1 in Table 2, but holding all other parameters fixed. Figure 8 shows the synthetic profile for the doublet obtained by adding the computations for each component together. It confirms that the synthetic profiles provide a good representation of the observed line strengths, and that the sharp peak near line center is the most discrepant feature for both components of the doublet. (Note that the strong absorption at 1000 km s-1 in the absorption trough of the red component is an interstellar feature.) We will show below that this problem may be solved if we assume that star C is responsible for the excess emission near 0 velocity.
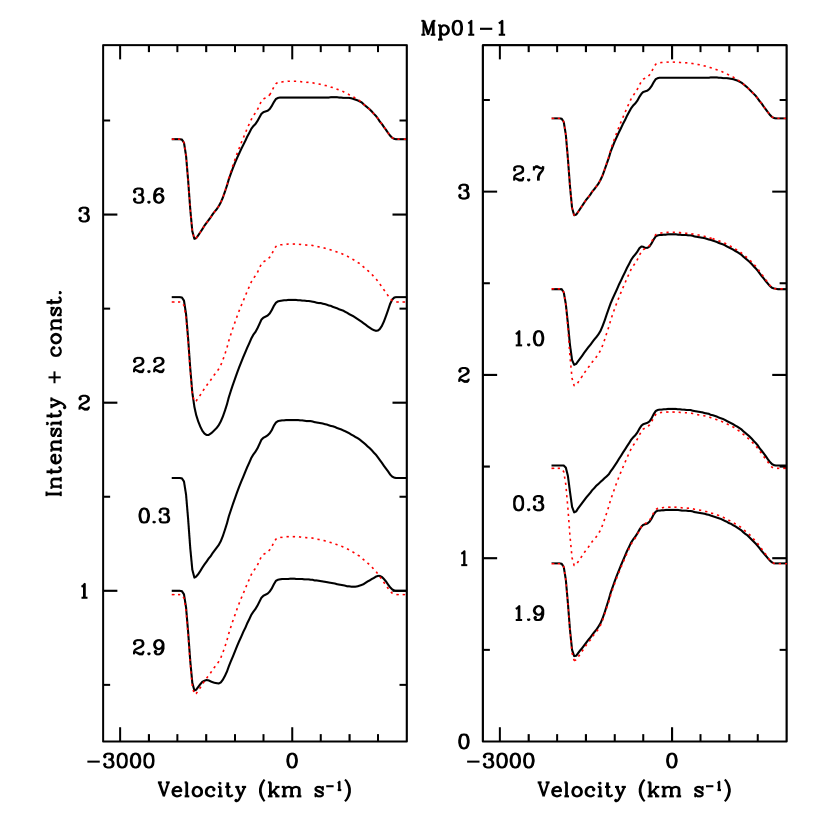
The model parameters listed in Table 2 also permit line profiles to be computed for different orbital phases. In the model, phases are characterized in terms of the impact parameter, , which is defined as the minimum distance between the line-of-sight to star B from the center of star A. For illustrative purposes, can be read directly from the abscissae in Fig. 1. The phases for the model computations were chosen to have impact parameters corresponding to the phases of the FUSE observations.
The phase-resolved progression of synthetic line profiles is shown in Figure 9, where each profile is labeled with the corresponding impact parameter (expressed in units of RA). The line profile computed for primary eclipse () is used as template, to show the predicted range over which excess absorption should be present. The left panel corresponds to orbital phases when star B is occulted by star A, while the right panel shows the phases when the portions of the wind of star A are eclipsed by star B. The profiles in both panels can be compared directly with their counterparts in Fig. 5.
Fig. 9 shows that the P Cygni absorption trough of P V in the spectrum of star A should decrease in strength near secondary eclipse, while the emission lobe is relatively unaffected. Thus, the line profile behavior shown in Fig. 5 is explained qualitatively by the combined effects of wind and physical eclipses. There is, however, one important feature of the theoretical prediction that does not appear in the observations: for small impact parameters (e.g., RA), the model predicts enhanced absorption over the entire velocity range from to , projected onto star B. In contrast, the observations only show excess absorption from to .
Thus, it appears that either: (a) the wind of star A flowing toward star B does not have the same structure as the wind emerging from the opposite side of star A; or (b) the predicted excess absorption on the “red” side of the line profile is filled in by emission from some process that is not currently included in the model. For (b), this emission must arise from gas that is not projected against either star A or star B, and which is receding from the observer at orbital phases . A plausible candidate that would produce emission is the WWC region illustrated in Fig. 6(a). However, the opening angle of the shock cone would need to be sufficiently small for the projection of the WWC flow velocities along line-of-sight to be as large as 1000 km s-1. In addition, this putative emission would have to be visible at the opposite orbital phases () at similar speeds approaching the observer. Although the observed profile at this orbital phase does display what could be interpreted as excess emission, the same feature can also be interpreted in terms of a physical eclipse of the absorption-forming column of material in the wind of star A. This effect is predicted by the model: see, e.g., the RA profile in the right-hand panel of Fig. 9. Thus, it seems more likely that the wind emitted by opposing hemispheres of star A has substantially different structure.
5.2 Correcting for Line Emission From star C
If star C is a mid-O type supergiant (Koenigsberger et al., 2002), its spectrum should contain prominent P Cygni profiles in the resonance lines of P V; see, e.g., Walborn et al. (2002). We used an archival FUSE spectrum of Sk 80 (O7 Iaf) as a template for star C, and subtracted it from each spectrum of HD 5980 in order to compensate for the contamination it introduces. Since the continuum level of Sk 80 matches the estimated continuum strength of star C (i.e., 33% of the total recorded for HD 5980), this operation also corrects the FUSE spectra for the contribution to the continuum from star C. Figure 10 illustrates the 8 line profiles from FUSE program P223 after subtracting the spectrum of Sk 80 and correcting for the orbital motion of star A (as in Fig. 5).
A new set of models was computed for the P V 1117 profile of star A at . Matching parameters to achieve a good fit with the observed profile yielded once again RA, but required larger values of and . The adopted input parameters are listed in Table 2 under the label “Mp01-2”. The increase in and compensate for the fact that the P Cygni profile of the P V resonance line in the spectrum of Sk 80 has a prominent, low-velocity absorption component. Subtracting this profile from the spectrum of HD 5980 produces more emission, and consequently the model requires more optical depth over a larger volume to achieve a good match.
Figure 11 shows the P V 1117 profile of star A at after the removal of the contribution from star C. The “best-fit” profile computed with the parameters of model Mp01-2 is shown as a continuous line, which corresponds to . For comparison, models with RA and RA are also shown. The match is significantly better than the one illustrated in Fig. 7, especially in the emission lobe near . Thus we conclude that this feature is indeed an artifact of stationary “third light” contamination by star C.
It is important to note that the assumed P V contribution from star C is overestimated by adopting Sk 80 as a template. This line’s emission is maximum in supergiants at O6O7 (Walborn et al. 2002), while star C is likely to be O4O6. Thus, star A’s actual wind structure is between that given by models Mp01-1 and Mp02-2, although the uncertainty does not affect the conclusions regarding the wind accelerating region. Sk 80 is the “earliest” O-supergiant in the SMC for which there exists a FUV spectrum, and thus provides the only template we can use at this time.
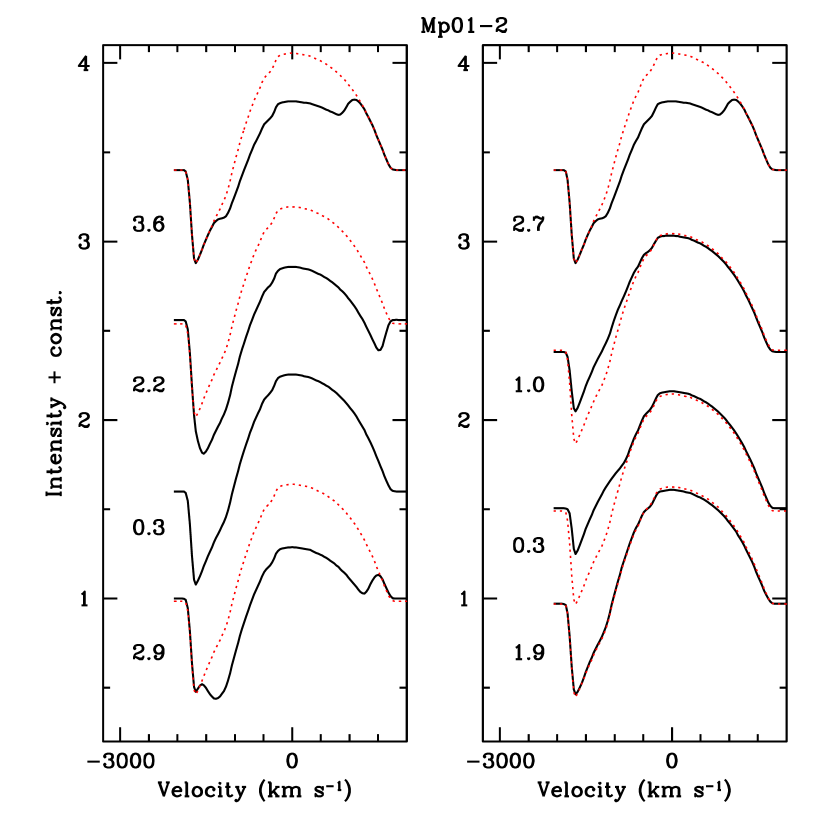
The phase-dependent line profile variability predicted by this second set of calculations is shown in Figure 12. The variations are qualitatively similar to those generated from model Mp01-1; compare, e.g., with Fig. 9. The main difference is the more pronounced wind eclipse due to the larger physical extent of the P V emitting region which, in this case, extends beyond the orbital radius.
5.3 Absolute Dimensions of the System
A theoretical light curve can be constructed from the model continuum intensities that were required to achieve a good match with the observed line profile of P V 1117. An additional, unknown requirement is the size of star B relative to star A. By varying this single parameter until a good fit with the far-UV light curve (Fig. 2) was achieved, we determined that R RA in 2002. By further adopting R15 R⊙ (Breysacher & Perrier, 1991), we infer that the far-UV continuum of star A was R21 R⊙ in 2002. With this value of RA, the length scale for all model parameters is established, which in turn allows the distances in Figures 1 and 6 to be calibrated in units of R☉. Table 3 lists the derived parameters for the wind of star A in 2002.
It is interesting to note that the value of RA that we find from the FUSE light curve obtained in 2002 is the same as that deduced by Breysacher & Perrier (1991) from optical data obtained in 1978. This coincidence suggests that the optically thick radius marking the base of the stellar wind of star A has not changed, despite the disruptions caused by the eruptive phenomenon that took place in the system.
6 Discussion and Conclusions
6.1 The Wind Structure of Star A
We have used phase-resolved wind profiles of the P V resonance doublet obtained by FUSE in 2002 together with a simple wind eclipse model to constrain the velocity law of star A, the relative continuum intensities of star A and star B, and the physical dimensions of the HD 5980 system. We find that, to a first approximation, the P V wind profiles require that the wind of star A is expanding with a “fast” velocity law, as is typical of outflows driven by radiation pressure in spectral lines. Systematic variations of profile strength and morphology as a function of orbital phase are well reproduced by a combination of “wind eclipses” of star B and physical eclipses of star A by star B.
However, there are four important discrepancies between the observations and the synthetic line profiles obtained from our simplified model. The first consists of the presence of an emission “spike” near the rest velocity in the components of the P V resonance doublet that is not predicted by the model. We show in §5.2 that this problem can be resolved by assuming that the excess emission arises from the third component of the system, star C. The presence of a P V wind feature is consistent with the classification of star C as an O4–O6 supergiant on the basis of its photospheric absorption lines (Koenigsberger et al., 2001). Unfortunately, solutions for the three remaining discrepancies are less straightforward.
Absence of a wind eclipse at The wind eclipse around phase 0.0 produces reduced emission over the range of velocities associated with the column of material projected against the disk of star B. We have shown that the wind of star A expands rapidly, so that it achieves its terminal speed before it reaches the radius of its relative orbit about star B. Thus, at phases immediately before and after 0.00, the entire emission lobe should be significantly reduced in intensity by the wind eclipse. However, the observations show the expected effect only at km s-1; i.e., only on the blue side of the P Cygni profile.
Thus, it seems as if only the portion of the wind of star A that is approaching the observer has the geometry and kinematics assumed by the model. We see two possible explanations for this discrepancy:
-
1.
There is an extended region of P V emission associated with star B that compensates for the absorption produced by the wind eclipse. This emission could come from the surface of the shock cone associated with the WWC region, which effectively truncates the spherical symmetry of the outflow.
-
2.
The wind of star A is not spherically symmetric, but is significantly perturbed in the direction of star B. However, the asymmetry must be present in the wind acceleration region, which we have shown lies very close to the surface of star A, far from the expected location of the WWC stagnation point. Hence, if this explanation is correct, we conclude that the wind structure of star A in the direction of its companion differs from that of other directions, as opposed to a wind structure that is truncated by the WWC region. This difference could either be intrinsic to star A or could be the result of “sudden radiative braking” (Gayley et al., 1997). Note that if the wind structure towards the companion is non-standard, then the WWC surfaces that are drawn in Fig. 6 are not valid. For example, a slower wind towards the companion would have the effect of moving the stagnation point towards star A.
Strength of P Cygni Absorption at 0.36: If P V 1117 is formed exclusively in the wind of star A, then the eclipse model predicts that the absorption trough of its P Cygni profile should exhibit significant weakening during secondary eclipse, because star B occults the column of material responsible for producing this absorption. However, only a modest degree of weakening is observed at slow velocities; see, e.g., Fig 5 and Fig. 10. At large velocities, , the absorption seems to be even more pronounced during secondary eclipse. A natural explanation for this behavior is that the wind of star B also emits and absorbs P V; i.e., that our assumption concerning the unique association of P V with star A is not correct. Unfortunately, the present version of the wind-eclipse model is not able to test this idea, since a rigorous calculation must include detailed radiative transfer through two stellar winds and the WWC region. Instead, we simply note that if the spectrum of star B does posses a P Cygni wind profile in the P V resonance doublet, then it differs significantly from the spectrum of the WR star in Sk 108.
Extent of the P Cygni absorption edge: The final discrepancy is the extent of the P Cygni absorption edge. Although 1750 km s-1 for star A, the edge velocity is km s-1. The greater extent of is a well-known phenomenon in O-type and WR stars, so it is not too surprising to find it in HD 5980 as well. What is surprising, however, is that the extended, “soft” blue edge of the P Cygni absorption trough does not vary with orbital phase. Since star B also drives a strong stellar wind, it is possible that its radiation field further accelerates the outflow from star A that has already achieved . However, since this speculation cannot be tested directly with the present data set, the issue must remain open for now.
6.2 New Insights into the Eruption Mechanism
The changes in the wind of HD 5980 prior to the eruptions in 1993–1994 were characterized by a progressive decrease in terminal velocity, which was accompanied by a systematic increase in density (Koenigsberger et al., 1998b). The first sign that a significant change was occurring in HD 5980 can be found in its IUE spectra of 1986 (Koenigsberger, 2004), although peculiarities were already present in the early 1980s (Niemela, 1988). The amplitude of the perturbation seems to have grown gradually over the subsequent 13 years until some kind of critical state was reached. This critical state produced the sudden eruption in 1993, which was followed by a second, stronger eruption in 1994. According to the visual data of Albert Jones (reproduced in Koenigsberger, 2004), the eruption started around HJD 2,449,299 (1993 November 7), which is only 51 days (2.6 orbital cycles) after the ORFEUS/BEFS spectrum was acquired.
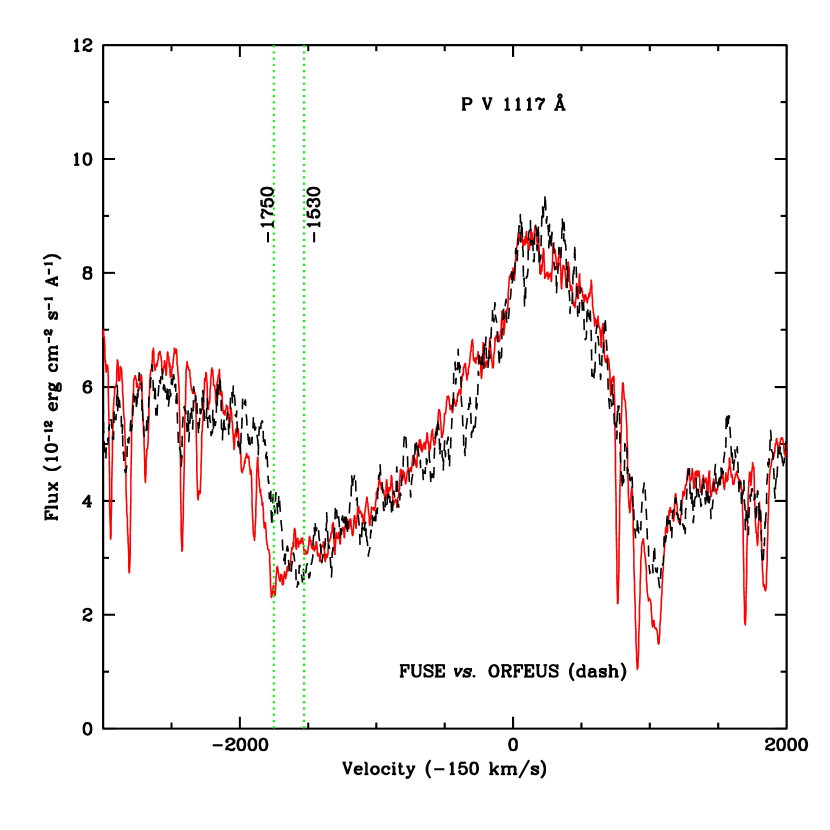
Figure 13 compares the P V 1117 wind profile in the ORFEUS/BEFS spectrum with its counterpart in the FUSE P2230102 spectrum. Both spectra were obtained at essentially the same orbital phase, though they are separated by 168 orbital periods. In addition to slightly stronger P Cygni absorption around km s-1, the only morphological difference between the two spectra is the location of the discrete absorption component that marks the position of terminal speed: in 1993 1530 km s-1, while 1750 km s-1 in 2002. Hence, the trend for decreasing wind velocity persisted from the early 1980s up to 51 days before the start of the eruption.
Evidently, the overall structure of the wind of star A was very similar just prior to the first eruption in 1993 and in 2002, when HD 5980 was in a quiescent state. Hence, we infer that the wind must have been driven by the same mechanism at both epochs; and we have argued on the basis of the rapid acceleration required to model the P V wind profile that in 2002, this mechanism was radiation pressure in spectral lines. Consequently, in 1993 the conditions in the star must have changed from supporting a “normal” radiatively driven outflow to a state of significantly enhanced mass loss in less that 51 days; i.e., whatever set of critical conditions initiated the eruption occurred within a remarkably short time interval. This rapid reconfiguration of the properties of the wind provides a strong constraint on the unknown mechanism responsible for the eruption.
The fact that the wind velocity decreased systematically for many years before the eruption suggests that some critical limit was reached in the autumn of 1993. If the decreasing wind velocity is associated with an increasing wind density, as appears to be the case from the growth of emission line intensities over the 1980–2000 timescale (Koenigsberger, 2004), it is possible that the critical conditions are related to the “bi-stability limit” (Lamers et al., 1995; Vink et al., 1999). In this case, the eruptions would be interpreted as the observable manifestation of the transition from the “fast, rarefied wind” side of the bi-stability limit to the “slow, dense wind” side and the concomitant re-structuring of the circumbinary environment. Since two major eruptions occurred within 1.5 years, it appears that star A remained very close to its “bi-stability limit” for this long before beginning to relax to its pre-outburst state.
Of course, the crucial unanswered question is what underlying evolutionary process caused star A to move towards its “bi-stability limit” in the first place, e.g., by triggering enhanced mass-loss rate or decreasing the velocity of the radiatively driven outflow. Identifying this trigger mechanism in HD 5980 is certain to improve our understanding of eruptive phenomena that occur in other massive stars and binary systems. Since these outbursts may drive significantly greater mass loss than possible via stellar winds, they have great potential to alter both the evolutionary histories of these stars and the yields of chemically enriched material they provide to their local environments.
References
- Auer & Koenigsberger (1994) Auer, L. H., & Koenigsberger, G. 1994, ApJ, 436, 859
- Bateson & Jones (1993) Bateson, F. M., & Jones, A. F. 1993, Pub. R. Astron. Soc. New Zealand, 19, 50
- Breysacher & Perrier (1980) Breysacher, J., & Perrier, C. 1980, A&A, 90, 207
- Breysacher & Perrier (1991) — 1991, in IAU Symp. 143, Wolf-Rayet Stars and Interrelations with Other Massive Stars in Galaxies, edited by K. A. van der Hucht, & B. Hidayat (Dordrecht: Kluwer), 229
- Cantó et al. (1996) Cantó, J., Raga, A. C., & Wilkin, F. P. 1996, ApJ, 469, 729
- Crowther et al. (2002) Crowther, P. A., Hillier, D. J., Evans, C. J., Fullerton, A. W., De Marco, O., & Willis, A. J. 2002, ApJ, 579, 774
- Danforth et al. (2003) Danforth, C. W., Sankrit, R., Blair, W. P., Howk, J. C., & Chu, Y.-H. 2003, ApJ, 586, 1179
- Drissen et al. (2001) Drissen, L., Crowther, P. A., Smith, L. J., Robert, C., Roy, J.-R., & Hillier, D. J. 2001, ApJ, 546, 484
- Flores et al. (2001) Flores, A., Auer, L. H., Koenigsberger, G., & Cardona, O. 2001, ApJ, 563, 341
- Foellmi et al. (2003) Foellmi, C., Moffat, A. F. J., & Guerrero, M. A. 2003, MNRAS, 338, 360
- Gayley et al. (1997) Gayley, K. G., Owocki, S. P., & Cranmer, S. R. 1997, ApJ, 475, 786
- Hoopes et al. (2001) Hoopes, C. G., Sembach, K. R., Howk, J. C., & Blair, W. P. 2001, ApJ, 558, L35
- Jenkins & Peimbert (1997) Jenkins, E. B., & Peimbert, A. 1997, ApJ, 477, 265
- Kaufer et al. (2002) Kaufer, A., Schmid, H. M., Schweickhardt, J., & Tubbesing, S. 2002, in ASP Conf. Ser. 260, Interacting Winds from Massive Stars, edited by A. F. J. Moffat, & N. St-Louis (San Francisco: ASP), 489
- Koenigsberger (1990) Koenigsberger, G. 1990, A&A, 235, 282
- Koenigsberger (2004) — 2004, Revista Mexicana de Astronomia y Astrofisica, 40, 107
- Koenigsberger et al. (1998a) Koenigsberger, G., Auer, L. H., Georgiev, L., & Guinan, E. 1998a, ApJ, 496, 934
- Koenigsberger et al. (2001) Koenigsberger, G., Georgiev, L., Peimbert, M., Walborn, N. R., Barbá, R., Niemela, V. S., Morrell, N., Tsvetanov, Z., & Schulte-Ladbeck, R. 2001, AJ, 121, 267
- Koenigsberger et al. (2002) Koenigsberger, G., Kurucz, R. L., & Georgiev, L. 2002, ApJ, 581, 598
- Koenigsberger et al. (1994) Koenigsberger, G., Moffat, A. F. J., St-Louis, N., Auer, L. H., Drissen, L., & Seggewiss, W. 1994, ApJ, 436, 301
- Koenigsberger et al. (1998b) Koenigsberger, G., Peña, M., Schmutz, W., & Ayala, S. 1998b, ApJ, 499, 889
- Lamers et al. (1995) Lamers, H. J. G. L. M., Snow, T. P., & Lindholm, D. M. 1995, ApJ, 455, 269
- Mallouris (2003) Mallouris, C. 2003, ApJS, 147, 265
- Moffat et al. (1998) Moffat, A. F. J., Marchenko, S. V., Bartzakos, P., Niemela, V. S., Cerruti, M. A., Magalhaes, A. M., Balona, L., St-Louis, N., Seggewiss, W., & Lamontagne, R. 1998, ApJ, 497, 896
- Moos et al. (2000) Moos, H. W., et al. 2000, ApJ, 538, L1
- Münch (1950) Münch, G. 1950, ApJ, 112, 266
- Niemela (1988) Niemela, V. S. 1988, in ASP Conf. Ser. 1:, Progress and Opportunities in Southern Hemisphere Optical Astronomy, edited by V. M. Blanco, & M. M. Phillips (San Francisco: ASP), 381
- Niemela et al. (1997) Niemela, V. S., Barbá, R. H., Morrell, N. I., & Corti, M. 1997, in ASP Conf. Ser. 120, Luminous Blue Variables: Massive Stars in Transition, edited by A. Nota, & H. Lamers, (San Francisco: ASP), 222
- Prinja et al. (1990) Prinja, R. K., Barlow, M. J., & Howarth, I. D. 1990, ApJ, 361, 607
- Sahnow (2003) Sahnow, D. J. 2003, Proc. SPIE, 4854, 610
- Sahnow et al. (2000) Sahnow, D. J., et al. 2000, ApJ, 538, L7
- Sterken & Breysacher (1997) Sterken, C., & Breysacher, J. 1997, A&A, 328, 269
- Vink et al. (1999) Vink, J. S., de Koter, A., & Lamers, H. J. G. L. M. 1999, A&A, 350, 181
- Walborn et al. (2002) Walborn, N. R., Fullerton, A. W., Crowther, P. A., Bianchi, L., Hutchings, J. B., Pellerin, A., Sonneborn, G., & Willis, A. J. 2002, ApJS, 141, 443
- Willis et al. (1979) Willis, A. J., Wilson, R., Macchetto, F., Beeckmans, F., van der Hucht, K. A., & Stickland, D. J. 1979, in The First Year of IUE, edited by A. J. Willis (London: University College London), 394
| Observation | HJDaaHJD 2,400,000.0 at the start of the integration. | Int. Time [ks] | PhasebbOrbital phase computed from the ephemeris of Sterken & Breysacher (1997). | ccMean continuum flux between 1059.6 and 1060.6 Å, except for Sk 80 where the interval 10571058 Å was used, in units of erg/s/cm2/Å. | ()ddStandard deviation in the mean continuum flux. | S/N |
|---|---|---|---|---|---|---|
| HD 5980 | ||||||
| BEFS1068eeObservation with ORFEUS/BEFS. | 49248.0358 | 1.810 | 0.075 | 5.73: | 0.74: | 7 |
| X0240202 | 51472.3964 | 3.153 | 0.535 | 7.33 | 0.43 | 17 |
| P1030101 | 51728.0736 | 5.745 | 0.806 | 6.61ffThere is a broad dip at 1058.54 Å at this phase. | 0.31 | 21 |
| P2230105 | 52432.2891 | 4.342 | 0.360 | 4.84 | 0.37 | 13 |
| P2230107 | 52478.8300 | 3.953 | 0.775 | 6.16ffThere is a broad dip at 1058.54 Å at this phase. | 0.39 | 16 |
| P2230108 | 52481.7160 | 8.050 | 0.925 | 6.02 | 0.28 | 22 |
| P2230101 | 52483.1789 | 6.957 | 0.001 | 4.45 | 0.26 | 17 |
| P2230102 | 52484.7828 | 6.925 | 0.084 | 5.75 | 0.27 | 21 |
| P2230103 | 52485.5381 | 7.894 | 0.124 | |||
| P2230104 | 52488.8000 | 7.871 | 0.293 | 5.97 | 0.30 | 20 |
| P2230106 | 52548.5025 | 3.886 | 0.392 | 5.03 | 0.36 | 14 |
| Sk 80 | ||||||
| P1030201 | 51728.2801 | 11.700 | 2.25 | 0.10 | 23 | |
| Sk 108 | ||||||
| P1030401 | 51728.5619 | 13.958 | 3.82 | 0.14 | 27 | |
.
| Parameter | Mp01-1 | Mp01-2 | Description |
|---|---|---|---|
| 4.1 | 5.3 | Maximum extent of emitting region | |
| 25.0 | 20.8 | Terminal speed of the wind | |
| 70 | 80 | “Turbulent” speed in km s-1 | |
| 1.4 | 1.4 | Radius over which the wind is accelerating | |
| 400 | 400 | Opacity factor at the stellar surface | |
| 2600, 1.3 | 4100, 1.3 | Opacity factor out to | |
| 220, 4.1 | 220, 5.3 | Opacity factor out to | |
| IA, IB | 48, 32 | 48, 32 | Continuum intensity of each star |
| 4.76 | 4.76 | Mean orbital separation | |
| RB | 0.7 | 0.7 | Radius of star B in units of RA |
| Parameter | Value | Comments | |
|---|---|---|---|
| 111 | Maximum extent of emitting region | ||
| 1660 | km s-1 | Terminal speed of the wind of star A, | |
| 80 | km s-1 | “Turbulent” speed in the wind in star A | |
| 29 | Radius of accelerating wind region for star A, | ||
| RA | 21 | Radius of star A in 2002 | |