Chapter 4
Accretion onto Supermassive Black Holes in Quasars:
Learning from Optical/UV Observations
Abstract
Accretion processes in quasars and active galactic nuclei are still poorly understood, especially as far as the connection between observed spectral properties and physical parameters is concerned. Quasars show an additional degree of complexity compared to stars that is related to anisotropic emission/obscuration influencing the observed properties in most spectral ranges. This complicating factor has hampered efforts to define the equivalent of an Hertzsprung-Russel diagram for quasars. Even if it has recently become possible to estimate black hole mass and Eddington ratio for sources using optical and UV broad emission lines, the results are still plagued by large uncertainties. Nevertheless, robust trends are emerging from multivariate analysis of large spectral datasets of quasars. A firm observational basis is being laid out by accurate measurements of broad emission line properties especially when the source rest-frame is known. We consider the most widely discussed correlations (i.e. the so-called “eigenvector 1 parameter space” and the “Baldwin effect”) and analyze how they can be explained in terms of accretion properties, broad line region structure, and source evolution. We critically review recent estimates of black hole mass, accretion rate, spin and possible orientation indicators, stressing that any improvement in these parameters will provide a much better understanding of the physics and dynamics of the region producing the optical and UV broad emission lines. More accurate measurements of Eddington ratio and black hole mass may have a significant impact on our ideas about evolution of quasar properties with redshift and luminosity as well as on broader cosmological issues.
1 Introduction
Tremendous data gathering advancements make now possible to see a distant solution for most of the deepest conundrums concerning quasar research. There has been an exponential growth in the number of known quasars lasting since the 1970s. Presently, the 11th edition of the Véron-Cetty & Véron Catalogue of AGNs and quasars [253] lists 50000 quasars. The Sloan Digital Sky Survey (SDSS) plans to compile a sample of 100000 quasars. The SDSS Third Data Release provides Charge Coupled Device (CCD) spectra for 51000 quasars found over 4200 deg2 [210]. The improvement in observational capabilities has been possible by the introduction and spread of CCDs and other linear, high detective quantum efficiency devices as detectors for astronomical observations since the late 1980s. At a second stance comes the increase in access to large light-gathering power telescopes of aperture 4m, crucial for spectroscopic observations. The ability to carry out multi-frequency observations with increasing spectral resolution and sensitivity (most notably provided by Hubble Space Telescope (HST) and by the Far Ultraviolet Spectroscopic Explorer (FUSE) for the optical/UV) through the 1990s and early 2000s has been a third factor of relevance. The data gathering improvements – which are the foundation of every astronomical advancement – have led to the discovery of systematic trends in quasar properties. These suggest that quasars are not well described by an average spectrum. We can amplify this statement to say that the spectra of quasars seen at a fixed viewing angle are also not the same – the basic tenet of Unification Schemes [1]. Yet, data have not been fully digested in physical terms. Observational constraints have been only very recently organized in meaningful ways. We still lack the ability to derive important physical information from observational parameters on an object-by-object basis. The first aim of this paper is to set the point of our present knowledge on the diversity of quasar spectral properties, especially in the optical and UV spectral ranges (§ 2). We then discuss much needed improvement to ensure accurate measurements of the main physical parameters (§ 4) as well as structural constraints on the line emitting regions (§ 3) and the physical basis of quasar diversity (§ 5, § 7, § 8).
1.1 Basic Accretion Parameters
We regard quasars and active galactic nuclei as systems accreting matter onto a massive ( M⊙) black hole (see §1.3 for possible caveats). The main parameters are, as for any accreting system, black hole mass (, §4), Eddington ratio (§7), and mass accretion rate in M. The Eddington ratio is defined as the ratio between the AGN bolometric luminosity and the Eddington luminosity , i.e., the limiting luminosity beyond which radiation pressure overcomes gravitational attraction if accretion is spherical [177]. The Eddington luminosity is directly proportional to , and can be written as
Since the power emitted by an active nucleus through conversion of mass into energy can be expressed as , it is possible to define an Eddington accretion rate , and hence a dimensionless accretion rate . We stress that , and that is a quantity that can be derived from observations. On the other hand, the value of the efficiency () depends on the accretion mode which may not be the same for all sources: if matter is confined in an accretion disk as it is customarily assumed [211], depends on the geometry and radiative properties of the disk, which in turn may depend on ). Therefore we will not always confuse the dimensionless accretion rate and the Eddington ratio as it is frequently done in literature: for a fixed efficiency, there could be well super-Eddington accretion even if the source is radiating at, or below, the Eddington limit [41]. Black hole spin (§5) and an orientation angle (defined as the angle between the line of sight and the axis of the accretion disk around the black hole , §5.2) probably matter in the context of UV/optical properties although they have turned out to be very elusive to measure.
1.2 Nomenclature and Samples
We use the word quasar here in a generic fashion which means all classes of extragalactic objects that show broad (full width at half maximum, FWHM 1000 km s-1) optical and UV emission lines. This includes the nuclei of Seyfert and broad-line radio galaxies (BLRG) as well as radio-quiet (RQ) and radio-loud (RL) optically unresolved sources. They are often referred to under the umbrella of Active Galactic Nuclei (AGNs) which reenforces the paradigm that they are driven by the same physics differing only in their redshift-implied distances and, hence, luminosity. At the same time, there is no divide in AGN occurrence at the canonical boundary (absolute B magnitude 22.5 for 65 km s-1Mpc-1) that separates Seyfert nuclei from quasars [253], so that nomenclature may be kept luminosity-independent. For instance, we keep using the word Narrow Line Seyfert 1 (§2.7) for sources that are actually luminous quasars.
Most sources considered in this review were “classically” selected through color criteria. Major color-based surveys include the Palomar-Green (PG), the Large Bright Quasar Survey (LBQS), the ESO-Hamburg (HE) quasar survey and the SDSS. The SDSS photometric system was designed to allow quasars at 0 6 to be identified with multicolor selection techniques [208]. Other high-quality data-sets, even if more heterogeneous and less complete, are also considered [22, 50, 89, 140, 212, 277], especially if spectral resolution and continuum . These samples often include objects of “good” spectra; studies on the LBQS involve sources, while the SDSS accounts for another order of magnitude leap in sample size, with sources.
No consideration to obscured AGNs will be given since the very possibility of accretion parameter estimation from the observed optical/UV quasar spectra turns out to be related to the measurement of quasar broad emission line shifts, profile widths, and equivalent widths. Quasars showing broad lines are often referred to as “type-1” AGNs to distinguish them from Seyfert 2 nuclei and type 2 quasars (see e.g., Refs. [1, 173]) which will not be considered here.
There are more cumbersome, borderline AGNs which could be grouped into three classes:
- 1.
-
2.
An analysis of spectra of quasars in the Half-Jansky Parkes Survey [76] suggests that the wide majority ( 80%) are sources whose continuum is dominated by a pure power-law spectrum () ascribed to synchrotron radiation. These sources show broad lines and are bona-fide type-1 sources although their equivalent width is somewhat lower than that expected for color-selected quasars (see also §7). Sources with rather low W(H) and very broad Heii4686 (most notably NGC 1275, indeed a core-dominated BRLG) may be seen as somewhat peculiar with respect to the other AGNs, especially if an important goal of the spectral analysis is measurements.
-
3.
A third class of sources may show contamination in the nuclear spectrum of emission components associated to strong star formation. At the very least, the bolometric luminosity can be significantly affected as in the case of Mkn 231 [26, 53, 225]. Circumnuclear starbursts do occur in Seyfert 1 sources and quasars [93, 102, 57], and are usually not resolved. The emission line spectra of luminous Seyfert 1 nuclei may well be affected by the absorption/emission features observed in strong wind galaxies (e.g. NGC 4691; [81]). Broad Absorption Lines (BAL) observed in quasars could be associated to nova stars [219].
We mention these three AGN optical/UV spectral typologies since they may be extremes of AGNs accretion parameters, especially of (§4, §7): sources in the third class are likely to be “young” quasars radiating at high ; the first class may include “dying” quasars radiating at very low with little reservoir of matter (§8.3).
1.3 Rationale for a Black Hole in Active Galactic Nuclei
Do we have a definitive proof that the central massive object at the center of quasar is a black hole? From the definition of event horizon ( for a non-rotating black hole, where is the gravitational constant), the mass of the black hole must satisfy the condition / g cm-1. Although this criterion has not been satisfied yet by observations of extragalactic sources, circumstantial evidence in favor of a black hole is now considered overwhelming [16]. From the time delay in the response of emission lines to continuum variations (“reverberation mapping”) it is possible to estimate the central mass assuming that the line broadening is due to Doppler effect, and to test whether the emitting gas motion is virial. In luminous Seyfert 1 galaxies, the central mass can be M⊙ within the emitting region of the broad lines (the “Broad Line Region”, BLR) size, of the order of 1 light month. The resulting / 1024 g cm-1 is far less than the / requirement for a black hole. However, time responses for lines of different width are roughly consistent with a Keplerian trend i.e., with a “point-like” mass concentration with respect to the BLR size [123]. It is therefore legitimate to talk at the very least about “compact massive objects” at the center of AGNs. This would be a proper, observation-bounded definition. We will use the term black hole with the reassurance of a large body of cirumstantial evidence as well as with the perspective of decisive tests. In addition, most of the reasoning presented in this paper is largely independent on the exact nature of the “compact massive object,” provided that it is really compact and massive.
2 Eigenvector 1
2.1 Quasar Surveys and Quasar Spectral Diversity
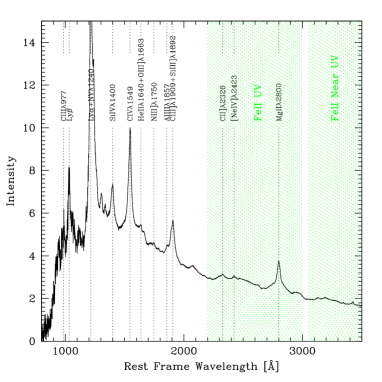
Fig. 1 shows a median composite quasar spectrum, between 800 Å and 7000 Å, with sources spanning a redshift range 0.044 4.789. The spectrum was obtained using a homogeneous data set of over 2200 spectra from the SDSS, at a resolution 1800. It reaches a peak signal-to-noise ratio () of over 300 per 1 Å resolution element in the rest frame. See Ref. [247] for a comprehensive line list of 80 emission features. Similar composite spectra have been recently constructed from HST Faint Object Spectrograph and FUSE observations [209, 290]. The main advantage of composite spectra is that is so high that identification of many faint features that remain invisible in individual spectra becomes possible [77]. Most prominent features and overall continuum shape are easily appreciable; from Fig. 1 one can realize the extent of Feii emission (shaded areas), the prominence of hydrogen Balmer (especially broad H, H, H), of Lyman lines, and of the Civ1549 line, which makes them, apart from their physical importance, the best studied optical/UV lines of AGNs. Beyond line identification and some basic information a composite spectrum can yield deceptive results. In principle it is legitimate to median together all spectra of a given survey if spectral properties scatter randomly with reasonable dispersion around the median. This is not the case for color selected samples of quasars. It is important to remark that attempts to model a composite spectrum like the ones from the SDSS and LBQS [77, 247] may be doomed to failure. Ionization conditions and gas kinematics are not the same for all type-1 AGNs [139]. The use of average line ratios from composite survey spectra has led to an impasse in the attempt at reproducing the observations through simple photoionization models (see e.g., Ref. [170], and references therein), an impasse that still hampers present-day efforts. Recent high quality data [212] with nearly simultaneous FUSE, HST and optical observations emphasize the quasar diversity in terms of emission line and continuum spectrophotometric properties. Optical data for 200 AGNs at 0.8 obtained with resolution show the impressive diversity in terms of emission line profiles [140].
2.2 Basis of Eigenvector Analysis
Eigenvector techniques are applied whenever many variables appear to be more or less loosely correlated without an intuitive indication of a dominant correlation or variable. A set of objects may have measured parameters like flux, FWHM, and equivalent widths of optical and UV emission lines, continuum shape, etc. We can think that each set of measurement is a vector in an -dimensional space described by orthogonal vectors , and define a matrix of vectors with measurements. The Principal Component Analysis (PCA) searches for the best-fitting set of orthogonal axes to replace the original axes in the space of measured parameters. The new axis set is sought by maximizing the sum of the squared projections onto each axis i.e., ()), where denotes the transposed matrix. If the set of measurements has been previously centered subtracting the variable average, then can be thought as a variance/covariance matrix. In spectral PCA no measurements are performed: the whole spectrum of objects is divided into small wavelength bins, and each input variable is the flux in the wavelength bin [213, 285]. We seek the maximum of imposing the condition that the norm of is unity through a Lagrange multiplier , and setting the first derivative to 0 [156]. With our formalism we have , hence 2, and then . This is an eigenvalue equation, which can be solved numerically. More eigenvectors are sought through a similar procedure, with the additional constraints that the eigenvectors must be orthogonal to each other. Since the eigenvalues are a measurement of the sum of the squared projections of the original data vectors on the new normalized vectors, and since we assume to have set as a covariance matrix , the eigenvalues are a measurements of the amount of variance carried in each new direction. For example, in a plane we can imagine a set of almost aligned points; their projections in the original axes may be nearly equal if they are not aligned preferentially with anyone of the two axes of the two original frame. In a physical context we may think of two variables that are highly correlated. We can maximize the projections along one axis by simply operating a rotation of the reference frame. A linear combination of the two original variables (or vectors) will now constitute the one vector that is needed to account for the variance of the data. A key aspect of the power of the PCA emerges from this simple example: a problem originally treated in two dimensions was inherently one-dimensional i.e., a PCA can restore a problem with a very large set of variables to its intrinsic dimensionality.
2.3 The Original Eigenvectors by Boroson & Green
The first important application of PCA to the interpretation of quasar spectra was done in the early 1990s on a sample of 87 objects of the PG survey at [22]. T. Boroson & R. Green measured the most prominent emission features in the H spectral region, and found that most of the variance was related to two sets of correlations, the first being an anti-correlation between the prominence of [Oiii]4959,5007 and optical Feii emission (Feiiopt). The “eigenvector 1” has been later found in a number of much larger samples [21, 88, 122, 229, 230, 285], and with spectral parameters describing phenomenologies as apparently distant as the X-ray continuum continuum shape and the radial velocity shift of high ionization emission lines. Even if many pieces of the eigenvector analysis had been hinted at by previous workers [18, 138, 263], the “eigenvector 1” provided, for the first time, a powerful systematic description of quasar spectral diversity. The second eigenvector involved the optical luminosity and the strength of the high ionization line (HIL) Heii4686. This second eigenvector had been also found by previous workers, and is basically the “Baldwin effect” (§8.4).
2.4 The Optical Eigenvector 1 Plane

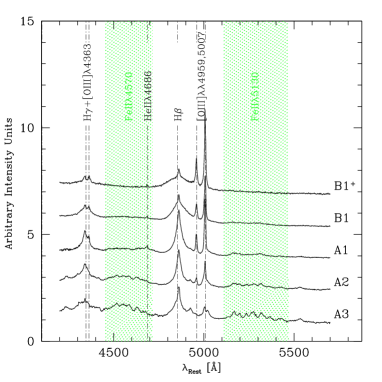
It is remarkable that the spectral diversity of quasars can be reduced (if we exclude any luminosity dependence) to just two variables. The diversity and correlation of broad line AGNs are clearly shown by their distribution in the so-called “Eigenvector 1 (E1) optical plane,” defined by the FWHM of the H broad component, FWHM(H), and by the equivalent width ratio between the Fe ii blended emission at 4570 and the H broad component, = W(Feii 4570)/W(H) [21, 22, 229]. The anti-correlation between FWHM(H) and provides perhaps a superior description of E1 than the original one, since it involves parameters related to the broad lines only ([Oiii]4959,5007 are narrow lines affected by radio loudness; [230]). The modest spread of data points drawn from a sample of more than 200 type-1 AGNs allow the definition of typical spectral types covering a narrow range in FWHM(H) and [230]. We set , and, for FWHM(H) 4000 km s-1, we define spectral type A1, A2, A3 in order of increasing (see Fig. 2; Feii emitters are considered strong if ; extreme if 1.5). Sources with FWHM(H) 4000 km s-1 very rarely show . If , we define a second sequence of increasing FWHM(H) (A1,B1,B1 ) with FWHM(H) 4000 km s-1. The spectral types are easy to identify observationally, even from a visual inspection of the optical spectrum (Fig. 3) and most of them may have a direct physical meaning (§ 2.6, 2.7, §7). FWHM(H) 4000 km s-1 represents a notable limit. It separates two groups of AGNs, Population A and B [229] whose different properties are most likely related to structural differences in the Broad Line Region (BLR; see §3).

2.5 Eigenvector 1 Measurements
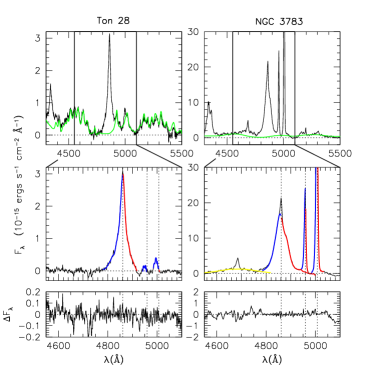
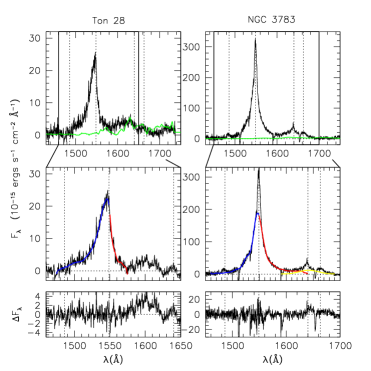
Quoting Peterson et al. [179], we can say that accurate line-width measurement depends critically on avoiding contaminating features, in particular the narrow components of the emission lines. Fig. 4 illustrates the typical analysis and measurement procedure applied to optical and UV data, in the H (left panel) and Civ1549 (right panel) spectral region. Two sources – one representative of Pop. A and the other of Pop. B – are shown. After continuum subtraction, Feii can be measured through a template Feii spectrum. Measurement of Feii 4570 (i.e., Feii emission integrated over the wavelength range 4434–4684 Å) parameters like flux and width are accomplished by constructing an array of template spectra within reasonable limits of scaling and broadening factors [22, 138, 140], starting from a template (the I Zw 1 Feii spectrum). One then obtains the best scaling and broadening factor by subtracting the templates and by identifying the one template that minimizes the sum of the least-square residuals in the range 4450–4600 Å. In principle, Feii and continuum should be fit simultaneously in an automatized way [75], especially if Feii is very strong. A similar procedure [59, 58, 121, 138, 258] is applied to the Civ1549 spectrum using an FeiiUV emission template [138, 258, 276]. While the procedure works remarkably well in the optical and in the UV around 1600 Å, some caution is needed in the UV between 2000 Å and 3000 Å since Feii emission around Mgii2800 can be strong and different from source to source [104].
We usually isolate the contribution of H, [Oiii]4959,5007, and of broadHeii4686 before we apply a high-order spline fit to produce a model- independent “description” of H which minimizes the effects of noise (the thick lines in the side panels of Fig. 4; [140]). Measurements of FWHM(H) are one of the basis of black hole mass estimates, so that it is important to provide a reliable recipe that leads to accurate results. Subtraction of a narrow-line component H is best done according to the following criteria [140]: (1) if a clear inflection is seen, the subtraction is trivial. This is the case of most sources (see the example of NGC 3783 in Fig. 4); (2) in the case where an infection is not seen, we subtracted a Gaussian profile under the condition that FWHM(H) FWHM([Oiii]4959,5007). It is important to stress that this last condition is not always applicable; (3) for several Pop. A sources (e.g., “Narrow Line Seyfert 1s” (NLSy1s) like Ton 28 shown in Fig. 4) with typically Lorentzian profiles and FWHM 4000 km s-1 (§2.8), the inflection is not observed. Such sources are “blue outliers” i.e., objects for which the recessional velocity measured on [Oiii]4959,5007 is lower than that of H by more than 250 km s-1 [288]. Subtraction of a significant narrow component in many of these sources would imply H stronger than or comparable to [Oiii]5007, which is not consistent with other forbidden line ratios [158]. Typically, H is 1/10 the strength of [Oiii]5007. In the outliers, any H would be appreciably displaced along the H profile. However, since W ([Oiii]5007) 2.5 Å, the H becomes too weak to be detected (very high resolution spectra are needed; it is detected for I Zw 1 [255], and references therein). This argues against the subtraction of a strong H in blue outliers if high-resolution does not resolve a low-ionization H [255]. If this recipe is applied, FWHM(H) measurements with an accuracy of % at a 2 confidence level are possible for the wide majority of “good” spectra. We customarily isolate a narrow-component contribution also to Civ1549 before the Civ1549BC is fit. Since the presence of significant Civ1549NC has been debated, we discuss the issue in physical terms in §4.7.1.
2.6 Eigenvector 1 Correlates
2.6.1 Feii
The emission spectrum of Feii in AGNs spans a wide wavelength range from the UV to the IR. It affects not only line intensity measurements of other ions but the continuum determination as well. In case of the strong FeiiUV, the emission produces a pseudo-continuum that extends to wavelengths as short as 1000 Å, and is especially strong in the near UV between 2000 and 3000 Å (Fig. 1; [138, 250, 276]). A convenient subdivision of Feii emission may be as follows: (1) FeiiUV, between 2000 and 3000 Å [104, 250]; (2) near FeiiUV between 3000 and 3500 Å; (3) Feii 4570, whose values are probably the most frequently reported Feiiopt measurements [22, 140]. Under the assumption that the I Zw 1 spectrum is a good representation of optical Feii emission, it is Feii 4570/Feiiopt 3.3 [138]; (4) Feii 5250 i.e., the emission blend on the red side of H (see Figs. 1 and 3).
Feii emission is still rather poorly understood, even if several recent papers have made significant advances after a decade-long standstill (see Ref. [229] for a bibliography before late 1999). An extremely complex energy level structure of Feii makes it very difficult to obtain all the experimental transition probabilities and therefore calculate line intensities ([6, 221, 252], and references therein). Although does not seem anymore a requirement for explaining very large FeiiUV/ Mgii2800 ratios [250], there is still no general consensus on the excitation mechanism. There are two lines of thought: Fe+ is mainly produced by photoionization; collisional excitation and florescence produce the observed strength and multiplet ratio. A recent paper [249] accounts for the observed FeiiUV/Feiiopt and FeiiUV/ Mgii2800 intensity ratios. Large electron density (UV multiplets are favored because of the increase in the upper level population) and moderate micro-turbolence (broadening 10 km s-1) can account for the combination of important diagnostics such as the FeiiUV/ Mgii2800, and FeiiUV/ Feiiopt intensity ratio [250]. However, models based on photoionization are not void of difficulties: a recent work indicates that photoionized BLR gas cannot produce both the observed shape and observed equivalent width of the 2200–2800 Å FeiiUV bump unless there is considerable velocity structure corresponding to a microturbulent velocity parameter 100 km s-1, which strongly favor fluorescent processes [6]. A second line of thought ([43, 255], and references therein) suggest that modelling the spectrum of the BLR requires a non radiative heating mechanism which increases the temperature in the excited HI region, thus providing the necessary additional excitation of the Feii lines [107]. The specificity of such a medium compared with a photoionized medium is its extremely low degree of ionization. The emission spectrum is made exclusively of low ionization lines (LILs) like Feii, Balmer lines and Mgii2800 for the electron density typical of the BLR. The photoionization models require very high ionizing photon fluxes cm-2s-1 to explain very large FeiiUV/ Mgii2800 ratios, while collisionally heated media require a shielding mechanism to hide the emitting regions from the strong AGN continuum. On the basis of our current understanding of the line emitting region structure (§3), it is not clear where this shielded medium could be [43, 6].
Even if the poor understanding of Feii processes hampers the use of Feii emission as a diagnostics, there are several important constraints related to E1:
-
•
Feii 4570 emission is well reproduced, in a sample of 300 AGNs [140, 143] by a scaled and broadened I Zw 1 Feiiopt template. All sources did not show any strong deviation from the template within the limits imposed by and resolution. Measurements of Feii width and strength are intrinsically difficult. Non optimal intrinsic width, spectral coverage, and imply that only an upper limit to the equivalent width can be measured for faint Feii sources (see Fig. 2);
-
•
Fig. 5 shows that the template method is able to reproduce Feii in cases of widely different width and strength. At zero order, Fig. 5 confirms that Feii and H are approximately of the same width, suggesting a common origin for these two LILs and confirming that is a meaningful parameter. There is however a difference: while for FWHM(H)4000 km s-1 we have FWHM(H)FWHM(Feii 4570) in a rigorous statistical sense, a sign test suggests that FWHM(H) FWHM(Feii 4570) if FWHM(H) 4000 km s-1[142];
-
•
the FeiiUV/ Mgii2800 ratio seems to be E1 dependent, in the sense that sources with the narrowest FWHM(H) [140] show the largest values of FeiiUV/ Mgii2800 [104, 121]. The FeiiUV/ Mgii2800 ratio increase along the E1 sequence may imply higher iron abundance but is also consistent with an increase in , if density changes from 1010 cm-3 to cm-3 [250]. Largest FeiiUV/ Mgii2800( 10) ratios require cm-3. Higher density is supported by several lines of evidence ([4, 139]; §2.8).


2.6.2 Prominence of [Oiii]4959,5007
The prominence of [Oiii]4959,5007 is one of the most basic correlates along E1, especially if the parameter actually measured is the peak height over continuum [21, 22]. Although not customary, this parameter yields a better correlation since profiles tend to broaden at low intensity [288], making W([Oiii]4959,5007) a worse correlate. Emission of [Oiii]4959,5007 is not straightforward to interpret. If a sample covers low- sources and spans a large range, [Oiii]4959,5007 measures are prone to aperture effects since the [Oiii]4959,5007 emission morphology can be anisotropic [98]. Resolved “narrow line regions” (NLRs i.e., where [Oiii]4959,5007 is produced) reveal that line emission is not only anisotropic but also strongly influenced by radio jets, in nearby RQ Seyfert nuclei and in BLRG alike [15, 36, 70, 271]. Not surprisingly, the EW of [Oiii]4959,5007 is in RL than in RQ sources of the same optical spectral type [125, 21, 143]. In addition, [Oiii]4959,5007 profiles can be strongly asymmetric with a predominance of blue-ward asymmetries ([271], and references therein). In the E1 context we find that large W([Oiii]4959,5007) sources can have a blue-ward asymmetric wing; low W([Oiii]4959,5007) sources (located in the lower left part of the optical E1 diagram; [288]) have emission entirely ascribable to a semi-broad, blueshifted feature that may resemble the blueward wing observed in stronger [Oiii]4959,5007 emitters.
2.7 Eigenvector 1 Extremes
Narrow Line Seyfert 1s
NLSy1s have been recognized as a distinct type of Seyfert nuclei since 1985 [172]. The defining criterion is that the width of the Balmer lines be less than 2000 km s-1. The [Oiii]5007/H ratio (but H is not necessarily H!) is often smaller than 3 [46, 215]. NLSy1s usually (but not always) show rather strong Feiiopt emission. Their soft X-ray spectra are very steep [248, 263] and variable (e.g., [90, 241]). The original definition is not void of difficulty, since: (1) a sharp discontinuity in many properties of type-1 sources is seen at FWHM(H) 4000 km s-1, and not at FWHM(H) 2000 km s-1 (§2.6). In other words, in the range 2000 km s-1 FWHM(H) 4000 km s-1 sources show properties consistent with the ones of NLSy1, although less extreme. (2) Sources with 0.5 (spectral type A1; [230]) may not be true NLSy1s since they often show prominent [Oiii]4959,5007, and their H profiles can be different from the typical NLSy1 and bin A2 and A3 profiles; several sources are core-dominated RL sources and some belong to the second extremal type mentioned in §1.2. With these caveats in mind, NLSy1s seem to be drivers of the E1 correlations since they show and minimum FWHM(H) and may have extreme in the “main sequence” of the optical E1 plane [229]. In the context of E1 they are interpreted as young or rejuvenated gas-rich objects with low black holes mass and high accreting rate [46, 88, 119, 144, 180].

BAL QSOs
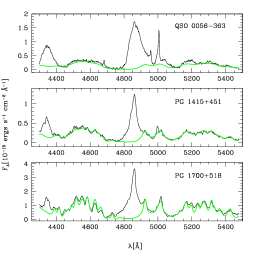
High- and low- BAL QSOs share some of the properties of the extreme Pop. A sources in the E1 optical diagram: weaker Civ1549BC in emission [97, 242]; stronger FeiiUV and Aliii1808 [261], as well as stronger Nv1240. BAL QSOs occur with a frequency of 15% with respect to all quasars [196]; the fraction of radio-loud BAL quasars may be consistent with the fraction of radio-loud ordinary quasars [239]. The “Balnicity” Index [269] distribution rises with decreasing index values. This suggests that the fraction of quasars with intrinsic outflows may be significantly underestimated [196]. Several high- BAL QSOs have extremely strong Feii and very weak [Oiii]4959,5007, extending the inverse relationship found for low- QSOs and typical of Pop. A [287]. An important information that is still missing for most high- BAL sources is a reliable estimate of the systemic redshift [117]. Without this information, the interpretation of the Civ1549 absorption/emission profile is rather ambiguous. Identification of low- BAL sources had to await space-based UV observatories [23, 225, 243], and only a handful of sources is known to-date. Classical BAL sources with Balnicity Index 0 km s-1 at low and high for which the rest frame can be reasonably set from narrow lines show an almost fully blueshifted emission component of Civ1549 in addition to a fully blueshifted absorption ([225]; Fig. 6). Most low- BAL AGNs with terminal wind velocities in the range 20000-30000 km s-1 are either outliers or are located along the upper envelope of the E1 “main sequence” for Pop. A sources. Most revealing are the cases of Mkn 231 and IRAS 07598+6508, which are basically the only 2 outliers in a sample of 300 low- AGNs. The sources show FWHM(H) significantly larger than FWHM(Feiiopt). The difference is due to a strong blue-ward asymmetry visible in the H profile. The H profile can be interpreted as due to a narrower component with FWHM FWHM(Feiiopt), and to a completely blueshifted feature, most probably associated to an high ionization outflow emitting most of HILs like Civ1549. If this effect is taken into account, and FWHM(Feiiopt) instead of FWHM(H) is used, Mkn 231 and IRAS 07598+6508 move into the “main sequence” optical E1 diagram to become extreme (in terms of ) Pop. A sources.
Radio Quiet & Radio Loud Quasars
FWHM(H) in RL sources are at least twice as large as the RQ majority [229]. The average broad Feii 4570 emission line strength is also about half that for RQ sources [22, 106, 138]. Fig. 7 shows that the Fanaroff-Riley II (i.e., lobe-dominated, LD) “parent population” of relatively un-boosted RL sources (median radio/optical flux ratio 500) shows the most restricted occupation. The Doppler boosted core-dominated (CD) RL sources (median 1000) lie towards smaller FWHM(H) and stronger Feii in E1 as expected if the lines arise in an accretion disk.
2.8 Additional E1 Correlates
H Profile Shape
Median spectra of the H profile were extracted for each spectral type (Fig. 2) after Feiiopt and continuum subtraction in a sample of 200 AGNs [140, 230]. The median H profiles in spectral types A are almost symmetric, with a slight blueward asymmetry in bin A2 (see Fig. 2 for the definition of the spectral types). The blue asymmetry becomes visually apparent in bin A3 which contains sources that are extreme in many ways. The median profiles of Pop. B sources are very redward asymmetric, with the strongest asymmetry in the (few) bin B1 sources. The H profile in NLSy1 and Pop. A sources is well fit by a Lorentz function [254]. The best fit to H bin B1 and B1+ profiles is achieved through the sum of two Gaussians: (1) an unshifted Gaussian core (FWHM(H) km s-1) and (2) a broader redshifted Gaussian base with FWHM 10000 km s-1 [29]. We remark that a Double Gaussian fit to H in Pop. B sources is a formal result. The two components have a physical justification if, for the generality of AGNs, the broader one can be ascribed to gas that lies closest to the continuum source in an optically thin (to the Hi ionizing continuum) region with large covering factor 1 [29, 30, 136, 214].

[Oiii]4959,5007 blueshifts
The narrow lines of [Oiii]4959,5007 usually provide a reliable measure of the systemic, or rest-frame, quasar velocity. However, several observations indicate that the NLSy1 galaxy prototype I Zw 1 shows an [Oiii]4959,5007 blueshift of –500 km s-1 relative to other rest-frame measures [24, 138], with a second component at –1500 km s-1 (see references in Ref. [255]). I Zw 1 is not alone. It is possible to identify sources with [Oiii]4959,5007 km s-1 with respect to H. Such large shifts are unlikely to be due to measurement errors [288]. The two known largest blueshift after I Zw 1 reach km s-1 [2]. Since these sources are apparently rather rare (but not unique! [89, 91, 143]), and since they seem to lie out of a continuous shift distribution, they have been dubbed “blue outliers”. The distribution of blue outliers in the E1 optical plane is different from that of the general AGN population [288]. The blue outliers occupy the lower right part of the diagram and are exclusively Pop. A/NLSy1 nuclei [289]. Low W([Oiii]4959,5007) may show only a blue-shifted component as if only the asymmetric part of the profile observed in stronger sources is being emitted. It is relatively straightforward to interpret the large blueshift and the profile of the [Oiii]4959,5007 lines as the result of an outflow [2, 288], and the low W([Oiii]4959,5007) as a signature of a compact NLR [255, 288].
High Ionization Lines
The peak shift of the prototypical HIL Civ1549 is an important E1 correlate in the sense that large shifts are shown only for FWHM(H) 4000 km s-1 [4, 138, 231] at low . W(Civ1549) decreases along the E1 sequence from sources with large FWHM(H) and low (typical W(Civ1549BC) 100200 Å) to the most extreme NLSy1s (typical W(Civ1549BC)50 Å; [4, 138, 203, 231]).
Ionization Level/Electron Density
A decrease in equivalent width of Civ1549 and H along with an increase in prominence of Feii 4570 in the E1 sequence toward NLSy1 sources suggest a systematic decrease in ionization level from RQ Pop. B to Pop. A [139]. The behavior of W(Civ1549) and W(H), and of the diagnostic ratios Siiii]1892/ Ciii]1909 and Aliii1808/ Ciii]1909 can be understood in terms of a decrease in ionization parameter (defined as the ratio between the ionizing photon flux and the electron density ) and an increase in from , 9.5, to , [4, 115, 139]. Notably, the diagnostic ratios indicate that 10.5 11 towards the NLSy1 domain (see also Ref. [255] for I Zw 1).
X-ray Continuum
The soft (energy 2-3 KeV) X-ray excess [45, 272] is perhaps the most distinctive X-ray feature that differentiate sources along E1 [263, 229]. The nature of the soft X-ray excess is still debated, although direct thermal emission from the accretion disk seems to be ruled out on the basis of the very high temperature derived for this optically thick component [186]. Even the newest X-ray data cannot constraint the current models [28, 85]. In the context of E1 several recent studies (including XMM-Newton observations; [186, 189]) reveal systematic differences in the X-ray properties of RL and RQ quasars. XMM observations [186] confirm a previously reported anti-correlation between soft and hard photon indices and FWHM(H) [195, 263]. The soft X-ray spectral index correlates with the hard-X ray spectral shape, in the sense that NLSy1 and Pop. A sources have a steeper spectral shape [129].
UV Continuum
Inferences on UV/FUV continuum shape are complicated by the lack of data at low before the advent of HST and FUSE, as well as by the possibility of strong extinction. A breakthrough occurred with the discovery in the spectrum of 3C273 of an optical-UV feature called the “Big Blue Bump”, corresponding to an important fraction of the bolometric luminosity. Some soft X-ray selected AGNs are NLSy1 galaxies with an enhanced big blue bump emission component relative to the underlying continuum making the optical continuum blue and the soft X-ray spectrum steep [90]. On the other hand, several recent works indicate that NLSy1s have a redder continuum than the rest of type-1 AGNs [52, 46, 266]. After correcting with an extinction curve obtained from 1000 AGNs, it seems that radio-quiet AGNs have very similar intrinsic UV-to-optical continuum shape over several orders of magnitude in luminosity, and that that radio-loud and radio-quiet AGNs probably share the same underlying continuum shape [83]. A recent investigation of ultraviolet-to-optical Spectral Energy Distribution (SED) of 17 AGNs used quasi-simultaneous spectrophotometry spanning 900-9000 Å (rest frame) with FUSE, HST and the 2.1-meter telescope at KPNO to study the big blue bump. Most objects exhibit a spectral break around 1100 Å, with a slope slightly steeper for RL sources [65, 212, 247, 290], but otherwise there is no obvious trend which may be related to the source location in the E1 sequence (apart from extinction).
FIR excess
Several quasars show an SED with an extremely strong FIR excess [20, 26, 202, 225]. The strong excess can be due, at least in part, to the contribution of circumnuclear starburst, as in the case of Mkn 231 [57], or to reprocessed radiation from a dusty torus encircling the accretion disk and the BLR. NLSy1s and extra-strong Feii sources are known to be found often among sources detected by the Infra-Red Astronomical Satellite [133, 154], although it is as yet unclear how frequent is a FIR bump among NLSy1s [215].
Bolometric Correction
It is not easy to obtain for individual quasars because they emit significant power over a large part of the electromagnetic spectrum, most notably in the FUV and in the FIR. Bolometric correction factors are found to be ergs s-1 for 5400 Å, with possible deviations for single sources of amplitude 50% [65, 212, 281]. A bolometric relationship ergs s-1 has been often adopted [41, 108, 143, 262, 281]. Recent work based on good coverage of the UV, FUV and X but still poor sampling of the IR SED confirms that the assumption ergs s-1 at 5400 Å is a fairly good approximation [212]. Again, scatter is pretty large (50%). To test any dependence of the bolometric correction along E1, we analyzed 44 sources that share accurate H measurements [140] and SEDs constructed from archival data [281]. Comparison of values computed from the SED and from the bolometric correction showed no significant systematic difference: the average is for all 44 sources, with a standard deviation . Similar results hold if RQ Pop. A sources and RL AGNs are considered separately. It is worth noting that the scatter is due to a minority of badly behaving data points (20%). If they are removed, the standard deviation becomes in all cases, with systematic differences always 0.05. Although big blue bump studies show that there may be a gross uniformity as far as the FUV is concerned, the difficulty to assess prominence and inherence of any FIR bump as well as the still uncertain shape in the EUV warrant caution before claims of accuracy better than 50 % can be believed for the bolometric correction of individual objects. It is also important to stress that sources which are RL CD could add an appreciable scatter to an average SED, since their continuum may be strongly affected by relativistic beaming. RL CD sources should be considered on an individual basis and not included in averages.
X-ray Variability
A common phenomenon observed in AGNs is variability (for a review see e.g., Ref. [244]). The most vigorous variability observed is that of the X-rays [157]. Giant-amplitude X-ray variability by more than a factor of 15 has been found in NLSy1 galaxies. The most extreme one is IRAS13224-3809 which raised by a factor of about 57 in just two days [19]. This giant variability is persistent [79, 286]. Examination of X-ray properties across the Seyfert population reveals an anti-correlation between variability amplitude and FWHM(H) [91, 241].
Optical Variability
Optical variability has been established as an identifying property of type-1 AGNs for more than three decades. Typically these objects show continuum variations by 1-2 magnitudes with timescales ranging from days to years [185, 267]. Broad emission lines have also been found to vary. Emission line variations lag the continuum variations with delays ranging from a few days to months [51, 183]. The conclusion of an optical photometric study on six NLSy1s is that, as a class, there is no evidence that NLSy1s behave any differently than broader-lined Seyfert 1s [110]. However, an earlier study [268] conducted on a large sample (23 AGNs) found some evidence that AGNs with the strongest Feii emission lines were less likely to show strong optical variability. In the E1 context, an unpublished analysis of a survey of PG quasars [86] suggests that strong optical variability is not present among sources with FWHM(H)4000 km s-1, and 0.5; it seems to be frequent for FWHM(H) 4000 km s-1, and, interestingly enough, for sources with FWHM(H)4000 km s-1 and 0.5.
Summing up, along the E1 sequence we see extreme X-ray variability in correspondence of the high , low FWHM(H) end; optical variability, on the other hand, seems to follow the opposite trend: to be modest or even undetected in NLSy1s sources, and to be of relatively large amplitude for some sources with broader lines.
| Table 1: Main Trends Along the E1 Sequence | ||
|---|---|---|
| Large | Low | |
| Small FWHM(H) | Large FWHM(H) | |
| W(H) | low | large |
| H shape | Lorentzian | redward asymmetic; |
| double Gaussian | ||
| Civ1549 shift | large blueshift | no shift |
| W(Civ1549) | low | high |
| Civ1549NC | no | may be prominent |
| W([Oiii]4959,5007) | lower | larger |
| [Oiii]4959,5007 shift | may show blueshift | agrees with H |
| width Feii | equal to H | may be less than H |
| optical variability | possible | higher amplitude |
| X ray variability | can be extreme | possible |
| Soft X photon index | can be large () | |
| Radio | predominantly RQ | RQ and RL |
| BALs | extreme BALs | less extreme BALs |
| ionization | lower | higher |
| LIL em. region | higher | lower |
3 Inferences on the Broad Line Region Structure
Two observational strategies have been proved to be very powerful to investigate the structure of the broad line region: reverberation mapping [100, 176] and statistical inter-profile comparisons, especially between HILs and LILs [31, 50, 138]. Two dimensional reverberation mapping (i.e., mapping done considering narrow radial velocity intervals in the line profile) requires special observational capabilities, and attempts to perform such measurements have yet to provide convincing results on BLR structure [100]. The correlations of E1 already allow to organize data in a fashion that provides also appropriate input to reverberation mapping studies. Table 1 summarizes the main trends along the E1 sequence from large FWHM(H) and low , to the narrowest FWHM(H) and largest .
3.1 A Different BLR Structure Separates Two AGN Populations
An obvious question is whether there is a continuity in properties all across the sequence in the optical E1 plane. This does not seem to be the case. Three results stand out:
- 1.
-
2.
at FWHM(H) 4000 km s-1 we observe a rather abrupt change in H profile shape;
-
3.
large Civ1549 and [Oiii]4959,5007 blueshifts occur for FWHM(H) 4000 km s-1. Fig. 8 shows a correlation between FWHM(Civ1549BC) and Civ1549 peak shift that is valid for RQ Pop. A sources only; the same variables for Pop. B sources would show a scatter plot.
These results have strong structural implications for the BLR. The simplest model able to explain H and Civ1549 properties for sources with FWHM(H) 4000 km s-1 is a disk and wind system. An optically thick, geometrically thin disk emits most of H and all of Feii; optically thin gas with an outflow radial velocity component emits Civ1549 and other HILs ([25, 155, 190]; due to the absence of intervening absorption we may expect that the material is highly ionized). The optically thick disk obscuring the receding part of the flow and leaves a net blueshift in the Civ1549BC line profile [4, 62, 138]. Other lines, like Siiii]1892 and Ciii]1909 are most probably emitted at the base of the flow in the LIL emitting regions as also suggested by some reverberation mapping results [176]. This model introduces a dependence on the aspect angle that can be strongly different for HIL and LILs.

Observations first supported this scheme in the context of a RQ/RL comparison [62, 138]. It seems now that a more meaningful comparison is between sources withFWHM(H) 4000 km s-1 (note that this boundary may be somewhat luminosity-dependent, §8.4.1), and the rest of type-1 AGNs [229] because sources withFWHM(H) 4000 km s-1 can be both RL and RQ, and their broad line spectra can be indistinguishable. The evidence in favor of this model is not only statistical but also based on detailed inter-profile comparisons and monitoring of individual sources. For example, NLSy1s IRAS 13224–3809 and 1H 0707–495 are characterized by very blue continua; broad, strongly blueshifted HIL Civ1549 and Nv1240; narrow, symmetric intermediate-ionization lines (including Ciii]1909, Siiii]1892, and Aliii1808) and LILs like Mgii2800 centered at the rest wavelength [131]. In NGC 4051, the Heii4686 line is almost five times broader than H and is strongly blueward asymmetric. Variability and single-epoch data are consistent with the Balmer lines arising in a low-inclination (nearly face-on) disk-like configuration, and the high-ionization lines arising in an outflowing wind, of which the near side is preferentially observed [180]. Akn 564 is the most extensively monitored NLSy1 galaxy in the UV [40]. Absence of response in the canonical HIL Civ1549 line is consistent with matter-bounded emission.
3.1.1 Extreme BAL QSOs as Extreme Pop. A Sources
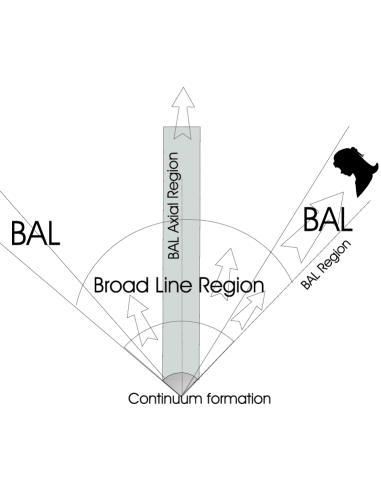
Assembling the previous results with the main constraint set by much earlier work (see, e. g., Ref. [64]) can lead to a simple geometrical and kinematical model which encompasses Pop. A sources as well as BAL quasars (see Fig. 9). The full blueshift of the emission component of Civ1549 (as in Fig. 6) requires that the opening angle of the flow is . Closer to the boundaries of the outflow and beyond the BLR proper extends the BAL region in a conical corona of divergence angle . Whenever a secondary absorption is present (Fig. 6; see also Ref. [117] for an atlas of BAL profiles), we may observe an axial region covering all of the continuum-emitting region and part of the BLR as well [225]. The depth of the absorption implies . It is important to stress that a shell of absorbing material which could provide an adequate is not viable in the geometrical context of our model because of the absorption relatively narrow width. Bent flow lines seen at large viewing angle or along the flow could give rise to NAL and BAL respectively [64]. They would require an opening angle , which does not seem supported by the Civ1549 profile in our sources. While the cylindrical sheet may appear rather ad hoc, it may have a straightforward physical explanation if it is associated to the axial flows which are likely present if the black hole spin is significant (§5).
3.1.2 On the Structure of Population B Sources
The observational structural constraints are by far more ambiguous for Pop. B sources where we do not find a kinematical decoupling between HILs and LILs [62]. This is not to say that a disk and wind system is not applicable, but that the evidence in favor of a wind is less compelling, probably because the ratio between outflow velocity and rotational velocity is much lower than in Pop. A sources. It is possible to fit the HIL profiles of Pop. B source NGC 5548 with a wind model, with parameters consistent with reverberation mapping results [39]. Modest outflows ( 1000 km s-1) are seen also in Pop. B sources like NGC 3783 [120]. A mild stratification can explain why higher ionization lines show broader profiles [142]: the FWHM of Heii4686, H, and Feii decreases in this order. A “split” BLR explains the same trend in Pop. A [4] and why the Heii4686, Hei, and H lines respond to continuum change with increasing delay in Mkn 110 [114, 111].
3.2 The BLR and the Accretion Disk/Wind Paradigm
Emission lines originating from a geometrically thin, optically thick disk [44] will show extremely small FWHM when observed face-on. Observed properties of CD RL sources suggest that we need a considerable velocity dispersion in the vertical direction to account for observed LIL widths (FWHM(H) km s-1). A candidate for the line emitting region involves the outer, self-gravitating part of the disk [42, 14]. At some distance the disk is expected to become gravitationally unstable and to dissolve into individual self-gravitating clouds or rings. For the face-on case, assuming orbital motion with Keplerian angular velocity (), one can write:
where is the vertical velocity dispersion, assumed to be proportional to the Keplerian velocity by a factor of . A reasonable guess for is about 0.1–0.2. One can easily show that FWHM of 1000 km s-1 implies an 5000 , and 3000 km s-1 implies 500 . The Toomre stability criterion applied to a standard Shakura–Sunyaev disk [211] yields results dependent on the assumption of the dominant source of opacity, making the and dependence of highly uncertain [14, 42]. It is however reasonable to conclude that can be smaller in Pop. B sources by a factor , and that this may leave a very “small” emitting surface for any standard optically-thick geometrically-thin disk. Part of the line profile may be produced in the fragmented disk if it is illuminated by a geometrically thick, hot inner region (Advection Dominated Accretion Flow, ADAF, or evaporated disk [56]).
The clumpy structure expected for may be resolvable through high-resolution spectroscopy. We note also that double-peaked profiles are expected to be resolved if the outer BLR radius is 105 . However, double-peaked line profiles from a disk can easily be turned into single-peaked profiles by the presence of a disk wind [155]. Although , the outflow velocity gradient is as large as the rotational velocity gradient. Since photons can escape much more easily along lines of sight with a small projected velocity, the resulting line profiles are single peaked with broad wings even though the emission comes from gas that is essentially on circular orbits [155].
4 Black Hole Mass Determination
4.1 The Virial Assumption
One can estimate the mass of the supermassive black hole using FWHM(H) and a reverberation BLR “radius” [108] along with the assumption of virialized motions [123]. The virial mass is
where is the gravitational constant. If FWHM of a suitable line, if the orbits of the BLR gas elements are randomly oriented.
The first question is whether the virial assumption is consistent with the data. If the virial assumption is valid, the BLR dynamics should be dominated by the gravity of a central point mass. In this case the characteristic line broadening should correlate with the time lag for different lines. The virial relationship is only marginally consistent with the best time-delay data [179, 123]. However, emission line profiles of Pop. A sources are relatively symmetric and smooth [140], and the optically thick part respond in a roughly symmetric fashion to continuum changes in 3C 390.3 [217] and NGC 5548 [218]. In the following, we will discuss the appropriateness of the virial assumption to derive considering the correlations and trends along the E1 sequence of § 2, as well as the structural constrains on the BLR derived in § 3.
4.2 Photoionization Mass
The first estimates of were based on the rough similarity of AGN spectra, and on the consequent assumption of constant ionization parameter or of constant product ([262] and references therein). A cumbersome evaluation of the ionizing luminosity is still needed with these methods. Even if these estimates are very rough, and the assumption of constant is debatable (but see Ref. [150]), these studies provide a consistency check for photoionization models and reverberation mapping results [262]. Further refinements may be possible when the behavior of along the E1 sequence will be better understood and if Feii can be used to constrain ionizing photon flux and [139, 250].
4.3 Mass Determination through Reverberation Mapping
The distance of the BLR can be deduced from reverberation data, most notably from H data. The cross correlation function between the continuum and the emission line light curve measures a time lag between continuum and line variations. The time lag, due to the light travel time across the broad line emitting region, yields an estimate of the . It is important to stress that the derivation of follows from several assumptions: (1) the continuum emitting region is much smaller than the line emitting region; (2) observable and Hi ionizing continuum are related. This assumption seems to hold well since the monochromatic luminosity at UV selected wavelengths strongly correlates with [150, 256]; (3) the light travel time across the BLR is a most important parameter, in the sense that it is shorter than the dynamical time (so that the BLR structure is not changing over the light travel time); (4) no dynamical effects of radiation are considered. Some peculiar structures in the line profiles may however derive from radiation pressure [137]; (5) the line response is linear. The responsivity of the Balmer lines are generally anticorrelated with the incident photon flux. Thus, the responsivity vary with distance within the BLR for a fixed continuum luminosity and changes with time as the continuum source varies [116]. More technical problems involve unevenly sampled data, errors in flux calibration, normalization of spectra (different setup, aperture effects), and dilution by stellar continuum [176, 100]. The coupled effects of a broad radial emissivity distribution, an unknown angular radiation pattern of line emission, and suboptimal sampling in the reverberation experiment can cause systematic errors as large as a factor of 3 or more in either direction [123].
The line FWHM observed at a single epoch is not necessarily the best estimator of the gas velocity dispersion. The highest precision measure of the virial product is obtained by using the cross-correlation function centroid (as opposed to the cross-correlation function peak) for the time delay and the radial velocity dispersion of the variable part of the line [184, 179]. The velocity dispersion for the variable part of the spectrum (which is due to portion of the BLR that is truly optically-thick) has now become available for 35 sources [179]. With those data Peterson et al. [179] found that the random component in the error of reverberation-based measurements is typically around 30%.
4.3.1 Extending Reverberation Mapping Results through the BLR Size-Luminosity Relationship
It is now common to estimate by assuming that the BLR distance from the central continuum source is and 0.6 – 0.7, as derived from the reverberation data by Kaspi et al. ([108]; §4.3.1). We therefore can write the black hole virial mass as follows: FWHM(H), where L5100 is the specific luminosity at 5100 Å in units of ergs s-1Å-1 [143].
Any deviation from = 0.6 0.7 has quantitative effects. The mass of luminous quasars at has been computed by extrapolating this relationship, so that it is important to stress that the relationship is based exclusively on quasars of and that the high (and low) luminosity ranges of the correlation are poorly sampled. If we consider sources in the luminosity range (i.e. where the sources in Ref. [108] show uniform luminosity sampling), the slope of the best fit is = 0.8, and could easily be as high as = 1 without increasing significantly the fit standard deviation. This case may be appropriate even for the PG quasar luminosity range [139]. In dwarf active galaxies, 0.5 seems appropriate i.e., dwarf active galaxies show larger BLRs than the values predicted by the - relation for more luminous AGNs [264]. One must remain open to the possibility that , and that might even be a function of . Changing implies an -dependent change in mass estimates: the slope of the luminosity-to-mass relationship is affected as well as the location of points in the vs. diagram in Fig. 13. If a restriction is made to the most likely range, = 0.6 0.7, the effect on estimates is 0.2 dex [149].
4.4 Estimation through an Optically Thin VBLR
Reverberation mapping-based determinations are probably affected by thenon-negligible size of the BLR that is optically thick to the Lyman continuum, so that the derived is not a very well defined quantity. The presence of high-velocity, optically thin line emission is likely rather common in AGNs ([214, 232] and references therein). Typical supporting evidence includes variability in the H line core, coupled with the absence of variability in the line wings, or strong response in Heii4686 without change in H. Observations of quasar PG 1416–129 revealed a large decline in its continuum luminosity over the past 10 years [232]. In response to the continuum change, the “classical” broad component of H almost completely disappeared (the flux decreased by a factor 10). A redshifted very broad component H persisted after the demise of the broad component [232]. In an optically thick medium the intensity of a recombination line is governed by the luminosity of the ionizing continuum. If the medium is optically thin the intensity of the same recombination line is governed by the volume and density of the emitting gas and is not directly related to the luminosity of the ionizing continuum. The H luminosity can be written as:
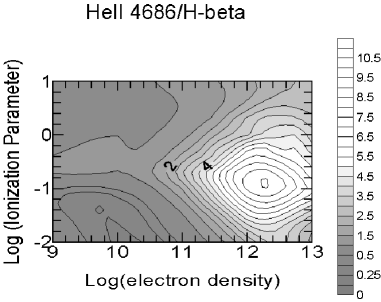
where and are the effective recombination coefficient and the line frequency for H, is the distance from the central continuum source of a shell of density and 1. The unknown can be computed given the luminosity of H after having inferred from the profile ratio in the line wings of Heii4686 and H ([136, 115]; see Fig. 10 for the expected dependence of the Heii4686/H intensity ratio). is a well-defined quantity because if the optical thickness to the Lyman continuum is less than unity at cm-3. In principle, if we could be sure that the wings of the Balmer lines are due to optically thin gas, the determination of would be possible even from a single line profile observation of H, if the density and the covering factor are known. It id tempting consider the FWZI and the luminosity of the non-variable part of the line profile of H from reverberation mapping spectra. This approach could be attempted in the near future since excellent data are now becoming available from reverberation campaigns [179].
4.4.1 Not Only Gravitational Redshift
The amplitude of the redward H asymmetry observed in Pop. A sources seems to be mass dependent [143]. A factor 6 increase in the redward displacement of the H centroid at 1/4 peak intensity [] means that the H asymmetry may be due to gravitational and transverse redshift [49]. A non-Doppler shift is due to a purely gravitational term /. A second term is due to Doppler transverse shift, which is 1/, where is the Lorentz factor. If gas motions are virial at ( ), the two terms yield a shift
The Pop. B sources considered by a recent study [143] have been subdivided in narrow ranges of and . In the range /, the resulting values are pc and 0.01 pc for and respectively, if we take the value as a conservative estimate of the redshift. If we also model the VBLR as a gas shell ( 1) with optical depth to the Lyman continuum , CLOUDY [71] simulations show the shell emission falls far short in explaining the VBLR luminosity [143]. The difference between the expected and observed VBLR luminosity is largely a consequence of the small shell radius required to explain the large in the c(1/4). We conclude that, even if c(1/4) is mass dependent, the shift amplitude cannot be explained by gravitational and transverse redshift alone [138].
4.5 and Host Mass
It seems that luminous (–24 –28) quasars (both RL and RQ) are hosted in galaxies which are spheroidal or, at least, possess large bulges [73]. A correlation of nuclear black hole with stellar bulge velocity dispersion is now well established in nearby galaxies [72, 166]. Supermassive black holes in galactic nuclei are though to be closely related, even in an evolutionary sense, to the bulge of the host galaxy. Reverberation-based estimates can be calibrated using the the correlation between and , even if indirectly (i.e., one cannot use the same objects unless the luminosity drops so much that becomes measurable; [160]). Seyfert galaxies (if we exclude NLSy1s, [145]) follow the same relation as nonactive galaxies, indicating that reverberation mapping measurements are consistent with those obtained using other methods [166]. Results based on the reverberating part of H [179] suggest that the systematic uncertainty in the is less than a factor of 3 [166]. The relationship between and should be taken with care at low . NLSy1s seem to be often host in dwarfish galaxies [119]. Analysis of PG quasar observations suggests a nonlinear relation between and bulge mass () although a linear relation cannot be ruled out [126]. The mean / ratio may drop from 0.5% in bright () ellipticals to 0.05% in low-luminosity () bulges (see also Ref. [145]).
Even more uncertain is the relationship between and bulge absolute magnitude. Seyfert galaxies are offset from nonactive galaxies but the deviation can be entirely understood as a difference in bulge luminosity, and not in ; Seyfert galaxy hosts are brighter than normal galaxies for a given value of their velocity dispersion, perhaps as a result of younger stellar populations [160]. We indeed observe post-starburst quasars i.e., type-1 AGNs that also display the strong Balmer jumps and high-order Balmer absorption lines characteristic of a very massive stellar population with ages 100 Myr, even if they are a few percent of the quasar population [175].
4.5.1 Mass Determination from [Oiii]4959,5007
In high-luminosity quasars, the relationship between and can be studied comparing derived from the width of the broad H line and from the width of the narrow [Oiii]4959,5007 lines used as a proxy to measure . RQ AGNs seem to conform to the established - relationship up to values of M⊙, with no discernible change in the relationship out to [220]. There are two major difficulties here. Even if an - FWHM([Oiii]5007) correlation is present [161], scatter is large. FWHM([Oiii]5007) measures may not always provide a way to estimate . values from [Oiii]4959,5007 can be considerably higher than values calculated using FWHM(H) [143]. This is not surprising because NLSy1-type AGNs apparently do not follow the same relationships as other type-1 AGNs [145]. It is important to stress that low-W([Oiii]4959,5007) sources can have FWHM([Oiii]4959,5007) FWHM(H), invalidating the virial assumption. Blueshifted [Oiii]4959,5007 emission arises in outflowing gas possibly associated to a disk wind [288]. The NLR in blue outliers may be very compact and its velocity field is not likely to be dynamically related to the host galaxy stellar bulge. This points to a limiting W([Oiii]5007) below which FWHM([Oiii]5007) ceases to be a useful mass estimator. Only large W([Oiii]5007) RQ sources in Pop. B may have very extended NLR whose motions is dominated by gravity due to bulge stars.
4.6 Masses of “Special” Sources
4.6.1 “Double Peakers”
A small fraction of AGNs exhibits exceptionally broad, double peaked LILs. The H emission line profile is strikingly peculiar (see Ref. [229] for a few typical examples, or recent surveys such as the ones of Refs. [67, 216]). AGNs with double peaked LILs remain relatively rare specimens, even if the SDSS has allowed to identify sources: 4% (with many dubious cases) of all RQ and RL SDSS sources [216]. Although predominantly RQ, they are more likely to be found in RL sources, and account for about 20% of RL AGNs [216, 67]. Their relative rarity and their exceptionally broad lines prompted workers to search for a specificity either in terms of peculiar views or physics soon after the discovery of the prototypical source Arp 102B [235].
Prototype “double-peakers” Arp 102B, 3C 390.3, and 3C 332 have been now monitored form more than 20 years [132]. A common property of double-peaked lines is slow, systematic variability of the profile shape on a timescale of years i.e., the timescale of dynamical changes in accretion disks [67, 163]. Lower limits on the plausible orbital periods from the absence of peak radial velocity changes would require supermassive binary black holes [82] with total masses in excess of 1010 M⊙. Such large values are difficult to reconcile with a maximum expected limit M⊙ (§4.8; [66]), and with the known – host bulge mass relationship. Other recent results from a five year monitoring of H further support the dismissal of the binary black hole hypothesis for 3C390.3 on the basis of the masses required [217]. Hot spots, spiral waves and elliptical accretion disks have been recently favored [132, 224]. If the hot spot lies within the accretion disk, it is possible to estimate and also the BLR physical size. The determination of in physical units removes the degeneracy due to the rotational velocity field (i.e., the velocity scales as (/ )-0.5; disk model profiles yield a distance normalized to ). M⊙ was inferred from the period and the distance of the hot spot in Arp 102B ( pc; [163]). It interesting to note that, within the framework of the model, / g cm-1 is still below the formal requirement for a black hole but the implied density M⊙pc-3 is a stringent limit. The in double peakers can be also estimated using the empirical relationship between and optical continuum luminosity [108]. and computations have been carried out for 135 objects from the SDSS [283] and from a survey of RL broad emission line AGNs [67]. values range from 3 M⊙ to 5 M⊙, and is between 0.001 and 0.1. Double peakers are found up to ergs s-1.
4.6.2 Black Hole Binaries
Several observational properties of extragalactic radio jets, such as bending, misaligment, and wiggling (often associated with knots superluminally moving along different-scale curved trajectory) have been interpreted in terms of helical structures of the jets. This structure is likely caused by the precession of the jet in a binary black hole system [35, 37, 47, 171, 260]. In the case of OJ 287 the bending of the VLBI jet was reported in Ref. [259]. A very small change in the orientation of the jet is needed in order to change the Doppler boosting dramatically, thereby producing long-term periodic brightness modulations. OJ287 was first recognized as a candidate binary black hole system by noticing the regularly spaced outburst pattern in its historical optical light curve [223]. Photographic information on the brightness of this blazar (thought to be a variable star) extends for about 100 years. Even though the observations were scanty in the beginning, there still was a convincing pattern which led to the prediction of the next major outburst in OJ287 in the fall of 1994 . For the first time a predicted cyclic phenomenon was indeed observed in an extragalactic object [222]. Sillanpåå et al. [223] modelled the periodic outbursts using a binary system consisting of a pair of supermassive black holes with an orbital period of 8.9 yr (in the rest frame of OJ 287). The light variations in this model are related to tidally induced mass flows from the accretion disks into the black holes [109]. A variant of this model explains and predicts other features of the observed light curve [128]. The variant allows for relativistic precession in the binary black hole system, and associates the major flares with the times at which the secondary black hole crosses the plane of the disk of the primary. The planes of the disks are perpendicular to each other. The monitoring campaign organized to observe OJ 287 in 1994 gave such a detailed light curve that a unique determination of the orbital parameters was possible. The model gave masses of 108 M⊙ and 1.7 109 M⊙ for the secondary and primary black hole respectively, and also predicted an eclipse of the secondary black hole disk by the disk of the primary in 1989. The eclipse was indeed observed [246, 194] in the optical but not in the radio, as expected. The observation of the next predicted flares for 2006 or 2007 (the date depends on the model) will allow to refine models and make a direct measurement of the orbital energy loss in the system.
4.7 At Low and High : Determination from Civ1549


4.7.1 Existence of a Civ1549NC Contribution
The very existence of significant Civ1549 narrow emission (Civ1549NC) has been a contentious issue. There is plenty of evidence that at least some AGNs with strong narrow lines have a strong Civ1549NC. Perhaps two of the most striking examples are PG 0026+12 (RQ; a borderline NLSy1 with strong NLR emission) and Pictor A (RL; Fig. 11). These are two cases in which an obvious inflection between broad and narrow component is seen, and in which a Civ1549NC can be easily isolated with FWHM1000 km s-1. The visual impression (already suggested in Ref. [138]) of a connection between [Oiii]4959,5007 and the Civ1549 narrow core is confirmed by a loose correlation between W([Oiii]4959,5007) and W(Civ1549NC) which we found considering only the cases of least ambiguous inflection. The data dispersion is probably intrinsic: at the two Civ1549NC extremes of large [Oiii]4959,5007 we find Pictor A (W(Civ1549NC) 30 Å) and 3C 390.3 (W(Civ1549NC) 5 Å) with W([Oiii]5007) 80 Å (see Fig. 11). We do not expect a strong correlation physically, since emission of Civ1549 is favored in the innermost regions of the NLR, as shown below.
Even if RL sources often show prominent Civ1549 cores of width 2000 km s-1, such emission has been ascribed to Civ1549BC [277] and to an intermediate line region [30]. It is relatively naïve to believe that [Oiii]4959,5007 and Civ1549NC should have the same width. Collisionally excited lines such as Civ1549 show a band of efficient reprocessing running at constant along a diagonal ridge in the plane photon flux versus . Emission is locally optimized along this ridge which corresponds to for Civ1549 [7]. Provided that a smooth density gradient exists (i.e., that there is a significant amount of gas at 106 cm-3), we expect Civ1549 emission to be strong at larger (Civ1549 emissivity is while [Oiii]4959,5007 becomes collisionally quenched). If velocity dispersion increases with decreasing distance from the central continuum source it is somewhat natural to expect FWHM(Civ1549NC) FWHM([Oiii]4959,5007). Detailed calculations based on these simple considerations indeed suggest that 1000 km s-1 FWHM(Civ1549NC) 2000 km s-1 for a variety of possible density-gradient laws [170, 226]. The same models correctly predict that FWHM(H) 500 km s-1 FWHM([Oiii]4959,5007) FWHM(Civ1549NC). To ascribe Civ1549 core emission to the BLR (where cm-3) seems rather arbitrary. Since Civ1549NC is prominent in Pop. B sources but can be absent in Pop A., the wind that gives rise to the blue-shifted Civ1549BC component may serve as a filter to the FUV ionizing radiation from the center that would otherwise reach the outer self-gravitating parts of the disk, where Civ1549NC may originate [130].
4.7.2 Is the Width of Civ1549BC a Reliable Estimator?
Estimating from the width of Civ1549 is cumbersome. Failure to account for Civ1549NC has dramatic consequences on and Eddington ratio estimates (§7). Dynamically, the HIL emitting gas is not in virial equilibrium at least in a significant fraction of quasars (§3; Fig. 8). Assuming virial equilibrium for Pop. B (as suggested by the absence of systematic line shifts and by the tentative similarity with the H profile) still leaves the problem of properly assessing Civ1549NC. Recent studies of the Civ1549 profile using HST archival spectra ([12, 122, 121, 256, 266]) have subtracted little or no H from the Civ1549 line profiles. A comparison of line widths and shift measures for H and Civ1549 [12, 266] shows that there are significant and systematic differences. An apparent dichotomy occurs at FWHM(H) 4000 km s-1 if no Civ1549NC is considered [12]: below 4000 km s-1, the Civ1549 line is broader than H, but the reverse seems to hold when FWHM(H) 4000 km s-1 where we believe that the NLR becomes important (Pop. B; [4]). This result is not necessarily against the view that Civ1549 generally originates closer to the center than H since Civ1549NC was not subtracted. In the case of PG 0026+129, failure to subtract the NLR emission yields spurious broad line parameter measures (e.g. FWHM 8000 km s-1 instead of 1860 km s-1; see Fig. 11). We conclude that: (a) computations from Civ1549 width are wrong in the case the Civ1549 profile shows large blueshifts i.e., for Pop. A sources; (b) failure to properly correct for Civ1549NC yields a large error in the mass estimate [4]. The error is especially large for Pop. B sources; however, it must be remarked that Civ1549NC can be strong also in Pop. A RQ sources, and that a case-by-case analysis should be made.
4.8 High- Masses: Are They Really That Big?
If the empirical relationship between and the source luminosity is used to obtain at high , the largest are M⊙. Such values of suggest bulge mass 1013 M⊙ and 700 km s-1 which are not observed at low . Black holes with M⊙ should reside almost exclusively in high-redshift quasars [169]. This implication is in contrast with the expectation that can only grow with cosmic time on timescales of the Universe present age, and inconsistent with several suggested scenarios of black hole and galaxy formation. A solution of this dilemma may reside in the improper use of Civ1549 as a proxy of H to estimate . A very good correlation has been recently found between and the specific continuum luminosity at 3000 Å [150]. In a sample of objects with broad-line radii determined from reverberation mapping the FWHM of Mgii2800 and H are consistent with an exact one-to-one relation, as expected if both H and Mgii2800 are predominantly emitted at the same distance from the central ionizing source within a factor of 2.5 [149, 150]. The Mgii2800 line seems to be systematically narrower than H probably because Mgii2800 (like Feii and the reverberating part of H) is emitted in the most optically thick portion of the BLR. The FWHM(Mgii2800) can then be used to estimate of quasars via optical spectroscopy alone, and it is in principle even preferable to FWHM(H). There are no strong theoretical reasons or empirical evidence to doubt the assumption that the Mgii2800 line broadening is virial, at least no more than the ones known for H. FWHM(Mgii2800) typically indicates a factor of 5 times lower than Civ1549 [60]. It is interesting to point out that a mass of 3 M⊙ for the central black hole in the quasar SDSS J114816.64+525150 (one of the most distant quasars known) has been estimated applying the technique appropriate for a detected Mgii2800 FWHM of 6000 km s-1 [274]. This very high luminosity quasar does not show extremely broad lines and does not require super-Eddington luminosity.
Measurements of H at high can be achieved only through IR spectrometers. Instrumental capabilities lag behind the ones of optical spectrometers, and lack of resolution as well as poor can lead to huge overestimates of FWHM(H) [146], although excellent data for a few tens of sources are becoming available [233].
4.9 Mass Estimates Along the E1 Sequence
The previous results suggest a number of general remarks.
-
•
The most accurate determinations are probably obtained considering the reverberating part of emission lines [179]. If estimates from the reverberating component of H are compared to Civ1549 estimates, offsets of 1.0 dex or larger from a perfect one-to-one relationship are possible [256]. derived from Civ1549BC has a probability of just 90% to be within a factor 10 from the best reverberation estimates. For the H single-epoch estimates, the probability of getting accurate to within an order of magnitude is 95 %, which suggests that systematic sources of uncertainties and ambiguities operate in the estimate of .
-
•
If an innermost region of optically thin (to the Lyman continuum) gas can be identified from the profile of H, an estimate of the line emitting region size is relatively straightforward (§4.4). However, the frequent occurrence of asymmetries partly invalidates the virial assumption for the innermost line emitting regions in Pop. B sources.
-
•
Single epoch, single line determinations based on the FWHM are valid in a statistical sense if the line is a LIL, like H or Mgii2800. An estimation of the aspect angle is a first-hand necessity, as farther outlined below.
-
•
It is improper to use Civ1549 for calculations is the line is blueshifted or strongly asymmetric, as in Pop. A sources. This seems to be the case of most high- objects [198]. The Mgii2800 line may provide the best estimator at high .
-
•
Some special sources, like double peakers and black hole binaries may provide accurate , although and determinations are still somewhat model dependent. Other sources – like BAL QSOs – may be favored if the orientation angle can be constrained.
-
•
[Oiii]4959,5007 may provide a suitable estimator only in RQ sources, predominantly for spectral types A1 and Pop. B, if the recessional velocity from[Oiii]4959,5007 agrees with the one deduced from other narrow lines which are of low ionization.
4.9.1 Orientation Effects
As reviewed in the previous sections, there is growing evidence that the LILs are predominantly emitted in a flattened system. LIL emission may be dominated by an extended, optically thick disk in Pop. A, while a fragmented disk may be the main line emitter in Pop. B sources. Inclination relative to a flattened system causes a systematic underestimate of the central mass. This effect is expected to be present in both RQ and RL sources. Considering the vertical velocity dispersion for the line emitting gas at FWHM, a suitable parameterization could be , where 1000 km s-1 and 3000 km s-1 for RQ and RL sources respectively. can be estimated from the FWHM range from CD to LD sources ([139, 234]; a similar approach has been followed in Ref. [148]). Considering that may be in the range , and distributed randomly, we have an average . This means that ignoring orientation effects leads to a systematic underestimate of by 0.6. The underestimate may be a factor 10 if the source is observed almost pole-on. Even if pole-on sources are the rarest one in a randomly-oriented sample, errors of this amplitude may dramatically influence inferences on and blur correlations involving (which varies only by 2 – 3 orders of magnitude in AGNs; §7). It is also important to consider that optical luminosity may not be appropriate in the – luminosity relationship for CD RL AGNs () because jets may significantly contribute to the optical continuum. A relativistically boosted continuum leads to an overestimation of . In such cases, it may be better to consider an empirical relation between and the H luminosity [284].
5 Black Hole Spin & Observer’s Orientation
5.1 Where Are Spinning Black Holes?
The idea of a non rotating black hole is rather distressing because every known massive object in the universe (from asteroids to neutron stars) does rotate. Conservation of angular momentum by the accreting matter should lead quickly to maximally rotating black holes [238]. While is destined to increase on timescales comparable to the present age of the Universe, a black hole angular momentum can reverse and decrease through a diversity of mechanisms [80, 101]: the collapse of massive gas accumulations, gas accretion, capture of stellar mass bodies, and successive mergers with other massive holes. A significant black hole specific angular momentum is required for driving relativistic, radio-emitting jets [17] although a maximally rotating black hole () is not necessary. In the E1 context, suggestions of 0 come from time scale variability arguments, especially from soft-X ray observations of NLSy1 sources. A variation in luminosity cannot occur on an arbitrarily short time scale, a minimum physical limit being set by the light crossing time of the emitting region. The emitting matter should have some opacity , where is the Thomson scattering cross-section. The time needed for radiation to diffuse out of a region of size is therefore [69]. The change in luminosity following an accretion event with accretion rate is . Writing where and is the proton mass, and considering the travel time, we have:
If changes of very large amplitude occur in such a short timescale that the relation above is violated for , claims have been laid that a rotating black hole is needed. This has been the case for a handful of NLSy1 galaxies [74]. In the view that some NLSy1s and at least some other Pop. A sources are young/rejuvenated quasars [144, 229, 88], they may have experienced one of few accretion events leading to a consistent increase of the black hole angular momentum.
Two-fluid models for relativistic outflows include a fast, relativistic beam surrounded by a slower, possibly thermal, outflow, with a mixing layer forming between the beam and the jet (e.g., [134]). The mixing layer could produce the secondary absorption seen in several BAL sources (Fig. 6). It is interesting to stress that the observed for the BAL QSOs Mkn 231 and IRAS 07598+6508 would require highly super-Eddington accretion unless the accreting object is a rotating black hole. Another aspect favoring a maximally rotating black hole is the remarkable behavior of the Fe K emission line in MCG –06–30–15 [227]. This source is pretty unremarkable optically; it is a Pop. A source with modest Feiiopt emission. More circumstantial evidence favoring rotating black holes is provided by the mass density of supermassive black holes in the present-day universe, which agrees with the quasar luminosity evolution and total power output if the efficiency has been , larger than that of a non-rotating black hole [94].
It is then intriguing that, at present, neither black hole spin nor morphology seem to be sufficient conditions to explain radio loudness [63], disfavoring the idea that the RL and RQ dichotomy may be due to systematically different black hole spins [280]. The physics of radio emission in the inner regions of all quasars (RL and RQ) may be essentially the same, involving a compact, partially opaque core together with a beamed jet [10]. Other factors may be at play: a strong electromagnetic field, coupled with differential rotation, could serve to convert rotational energy into kinetic energy of outflows [34]. In the context of optical/UV observations such effects are at present observationally unconfirmed, also because radio loudness does not seem to have appreciable effects on the observed broad line spectrum [143]. In principle, we could expect that, if a viscous accretion disk is inclined in relation to the equatorial plane of a rotating black hole, the differential precession will produce warps in the disk. The combined action of the Lense-Thirring effect and the internal viscosity of the accretion disk forces the alignment between the angular momenta of the rotating black hole and the accretion disk at . Some double peaked emission line profiles may be produced by warped disks. The agreement between some peculiar H profiles and a toy model is very good [33, 3], but many other models may also be applicable without invoking a warped disk [224].
5.2 Can we Measure an Orientation Angle?
In radio-loud quasars, where a rough orientation indicator is available from the radio core-to-lobe ratio, there is good evidence that FWHM(H) shows an orientation dependence consistent with a flattened (or even disk-like) geometry [275, 29]. There is a domain space separation between Fanaroff-Riley II (i.e., LD) and CD sources in E1. The diagonal arrow in figure 7 indicates the average change in E1 position due to change in orientation from LD to CD sources. As stressed earlier, can be underestimated if no correction is applied to observed LIL widths [167]. An analysis of the connection between and radio luminosity in radio-selected flat-spectrum quasars shows that values of are not systematically lower than those of luminous optically selected RL quasars, if a proper correction for the effects of inclination is applied [105]. It is also unlikely that there are sources radiating at at (see Fig. 14; [143]) if a reasonable orientation correction is applied to line widths. While a correction for the effect of varying is feasible in a statistical sense, measuring on a source-by-source basis has proved to be very difficult. Superluminal radio sources are an exception. Radio observations allow an estimate of the expected synchrotron self Compton flux relative to the observed X-ray flux. Lorentz factor and can then be independently estimated [84]. Figure 12 shows vs. FWHM(H) for 11 superluminal sources, confirming a factor 3 effect on the H width at extreme values.

The observational properties of some, extreme NLSy1s may well be due to a pole-on orientation angle. A NLSy1 nucleus has been found in the extensively studied eruptive BL Lac, 0846+51W1, out of a large sample of NLSy1 from the SDSS [292]. The SDSS allowed the identification of another source with typical NLSy1 properties (strong Feiiopt, undetectable [Oiii]4959,5007) that is definitely RL ( 1000). The inverted radio spectrum and the very high brightness temperature derived from variation of the radio flux suggested the presence of a relativistic jet beaming toward the observer [291]. It is unclear whether this finding can be extended to (at least) some RQ NLSy1s. Some NLSy1 might be considered the radio quiet equivalent of BL Lacs if they give rise to radio-silent relativistic outflow. Even if evidence is accumulating about the existence of a relativistic jet in RQ sources (e.g., [10]), RQ sources (especially if of Pop. A) are not optically violently variable. Although some NLSy1 sources (those with largest [Oiii]4959,5007 and Civ1549BC blueshifts, as well as narrowest H and most strongly variable soft X-ray excess) are likely to be oriented almost pole-on, it is still not clear whether we are observing a beaming effect.
Orientation estimates for RQ sources may come from the correlation between and soft-X ray variability amplitude, although the poor understanding of the soft X-ray excess prevents the definition of an orientation indicator. Other attempts at estimating are rather model-dependent. A sample of several thousand quasars from the SDSS confirms that HILs such Civ1549 are significantly blueshifted with respect to LILs such as Mgii2800 [198]. Among the SDSS sources, Civ1549 emission-line peaks have a range of shifts from a redshift of 500 km s-1 to blueshifts well in excess of 2000 km s-1 compared to Mgii2800. The anticorrelation between the shift of the Civ1549 emission-line peak and W(Civ1549) (Fig. 8) is confirmed by the SDSS study. Composite quasar spectra as a function of Civ1549 shift suggest that the apparent shift of the Civ1549 emission-line peak is not a shift so much as it is a lack of flux in the red wing for the composite with the largest apparent shift [198]. An outflowing wind and an optically thick disk to act as a screen provide a tempting explanation. However, it is unlikely that purely geometrical effects are at play in determining the width and shifts of H and Civ1549BC alike [139], even if a simple toy model shows that Civ1549 shift amplitude is orientation dependent with the largest shifts being produced by [288]. W(Civ1549) is strongly dependent on ([4, 12]; see §8.4.1), as are the properties of outflowing winds [155, 190]. To estimate on a source by source basis, we first need to understand how W(Civ1549) and Civ1549 shifts are affected by and .

We mention here an interesting attempt that is, again, strongly dependent on specific assumptions. Using the variable fraction of the H, Hei, and Heii4686 profiles to estimate , and then comparing the virial and the obtained assuming that the variable-fraction shifts observed in Mkn 110 are due to gravitational redshift, a measurement of the spin axis of the central black hole is possible [112]: . Unfortunately, there is as yet no convincing general evidence that the redward asymmetry seen in H profiles is entirely due to gravitational redshift (§4.4.1).
6 The Mass - Luminosity Diagram
Fig.13 shows a plot of vs. for a combined sample of 280 AGNs which cover an absolute B magnitude range and an interval ([143]; cf. Refs. [281, 41]). The wide majority of sources are located between . RQ sources show evidence for significant Malmquist bias while RL sources show the opposite trend probably related to a bias towards selecting higher luminosity core-dominated sources likely to be beamed. We find that the Eddington limit defines an approximate upper boundary to the luminosity distribution [281], indicating that there are no low- AGNs radiating significantly above the Eddington limit (this depends somewhat on the adopted value). Figure 13 also suggests that there may be fewer high (than low) mass sources with close to the Eddington limit. This might be a selection effect or an indication that galaxies with large may be unable to supply fuel at high i.e., a limit on [165]. If a sample comprising more high luminosity objects ( ergs s-1) is considered, 41% of the objects in that sample with ergs s-1 have super-Eddington ratios [266]. We caution however that correction for orientation and beaming should decrease . The lower envelope of the luminosity distribution of Fig. 13 may be due to a selection effect [281], or it may indicate that only sources radiating at exhibit a stable BLR. The lower limit may be connected with the absence or small size of a standard accretion disk (§7.1; see also Refs. [113, 165]). Redshift evolution of the black hole mass-luminosity ratio is found to be much less than the evolution seen in QSO luminosity function evolution [48]. This means that quasars radiate in almost the same range also at high-.
7 The Eddington Ratio as the Driver of the E1 Correlations
A PCA reveals a first principal component accounting for 48% of the spectrum-to-spectrum variance with just UV emission line strengths, ratios and widths as input. This linear combination of the input variables depends on [213, 279]. A reanalysis of PG quasars confirms that E1 is driven predominantly by while a second principal component is driven by accretion rate [21]. An UV based spectral PCA that uses the whole spectrum in the rest wavelength interval 1170–2100 Å find consistent results although the relative importance of luminosity and is reversed i.e., appears in a second eigenvector accounting for 20% of the spectrum-to-spectrum variance [285]. The E1 optical sequence and the trends have been recently confirmed also for intermediate quasars [162, 233, 287]. Comparison between high and low- QSOs confirms that the inverse Feiiopt – [Oiii]4959,5007 relationship (i.e., E1) is indeed related to rather than [287].
Different values explain the change in Feii and W(H) prominence in the optical plane [139, 278, 162]. The virial relationship can be rewritten in the form of FWHM(H) ()-1-0.4 using the – correlation. The diagnostic ratios Siiii]1892/ Ciii]1909 and Aliii1808/ Ciii]1909 provide an estimate of . Since correlates with FWHM(H) [278, 139] it is possible to write also the ionization parameter (and ) as a function of and [289]. The E1 “elbow” sequence in the optical plane is reproduced by varying , with toward spectral type A3. Orientation can be modelled as a third parameter in this scheme from the location of CD and LD RL QSOs [234]. Model computations suggest that sources of spectral type A1 are actually almost face-on, low sources [139]. This result explains why some extremely low W(H) objects (the second extreme type mentioned in §1.2) are observed in bin A1. Sources of bin B1, A2, A3 are instead rather homogenous in terms of with and acting as source od scatter. It has also been possible to show that the H different profile shapes of Pop. A and B sources are linked to differences in [143].
The soft X-ray spectral index correlates extremely closely with Eddington ratio and FWHM(H) [88, 229, 279]. W(Civ1549) decreases toward extreme population A (see a more detailed discussion in §8.4, and Fig. 16, where a dependence of W(Civ1549) on spectral type is clearly shown). Also, the distributions of large Civ1549BC blueshifts and blue outliers seem to be governed by ([143, 11, 288]; Fig. 14). Among type 1 AGNs with large blueshifted [Oiii]5007, there is no correlation between the Eddington ratio and the amount of [Oiii]5007 blueshifts. However, the Eddington ratios of the blue outliers are the highest among AGNs with the same in a sample of 300 objects [143]. These facts suggest that high is a necessary condition for [Oiii]4959,5007 large blueshifts.
Both NLSy1s galaxies and BAL QSOs of the PG sample lie at the high extreme [21, 139, 287], although these two object classes are well separated in a second eigenvector based on [21]. Other measurements confirm this scenario. BAL quasars show large Civ1549 emission blueshifts [197, 225]. Using the luminosity and H to derive and , both BAL and non-BAL QSOs at 2 tend to have even higher than those at low [287]. Extreme Pop. A sources may represent the most intense accretors with extreme BAL QSOs being observed at the largest inclination angles possible for a given wind geometry. A large mass flow may limit the viewing angle range of extreme Pop. A sources to be 90∘ (§ 3.1.1 & Fig. 9). It is important to stress a possible difference between the most extreme BALs (i.e., those with the highest terminal radial velocity, 30000 km s-1) and the generality of BAL sources. While the most extreme BAL QSOs seem to be associated to highest , the presence of a shallow BAL of moderate terminal velocity is not necessarily a signature of high since the terminal velocity correlates with if the wind giving rise to the BALs is radiation driven [225, 196, 197].
The separation between Pop. A and Pop. B sources, which may occur at 0.15 (Fig. 13) could be in part explained by a change in accretion mode. We note that there is no correlation between radio loudness and in a RL sample [92] although RL sources are differentiated in terms of from RQ sources [143]. Most or all of the weakly AGNs in nearby galaxies are RL, highly sub-Eddington systems that are plausibly experiencing advection-dominated accretion [99]. The vast majority of these objects appear to be radiating between 0.01 and 0.1 Eddington luminosity, and may therefore be akin to Pop. B powerful quasars. Radiatively inefficient accretion at less than a few per cent of the Eddington rate is unlikely to produce excess soft X ray emission [152, 159]. Lower mass loss rate, and the harder spectrum (which may decrease radiative acceleration) may both contribute to the absence of a strong wind in Pop. B sources.
7.1 Are “Double Peakers” a Peculiar Population?
Recent work seems to confirm the accretion disk origin of the LILs for double-peakers. Inter-profile comparison between Balmer lines and Civ1549 (which, in a few cases, show a markedly different, single peaked Gaussian profile [68]) can be interpreted in the framework of the disk and wind paradigm. More Civ1549 – Balmer line profile intercomparisons are needed to reach a firm conclusion also because the Civ1549 profiles thus far observed cannot be immediately ascribed to a wind. The LIL emitting portion of the disk to produce double-peaks as separated as in Arp 102B is relatively modest, from 100 to 500 [38]. At smaller radii, a hot solution may be appropriate [159], while at 500 self gravity may dominate. Using the customary empirical relation between the broad-line region size and optical continuum luminosity, and accretion rate have been computed for 135 AGNs with double-peaked broad emission lines from the SDSS from a survey of RL AGNs [283]. The inferred range of of double-peakers cover almost the full range of of type-1 AGNs, 3 M⊙ to 5 M⊙and up to 1046 ergs s-1[283]. Typical Eddington ratios are 0.001, much lower than the typical type-1 AGN; about 90% of them show (from the distribution of shown by [283]). Double-peaked sources lie close to the lower boundary or below in the mass-luminosity diagram.
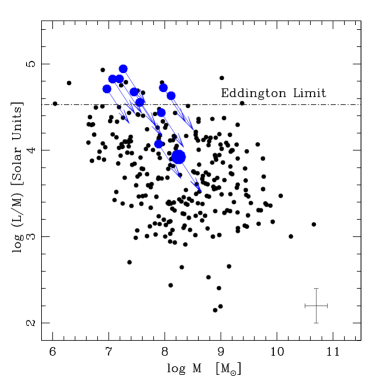
The evidence reported does not suggest that double peakers are truly peculiar sources, i.e., an independent Population C even if they lie out of the mass-luminosity sequence of Fig. 13. A two-component model assuming that the line wings originate in an accretion disk with additional contribution from spherical emission region fits very well the observed H profiles of Pop. B sources [187, 216]. An evolutionary scheme from single peaked Pop. B and double peakers is at least conceivable: double peakers show, on average, the lowest (and probably also the lowest ). They may be AGNs exhausting their fuel supply, with little gas reservoir, in which only the innermost part of the accretion disk is left to produce broad emission lines.
“Naked” AGNs
Indirect arguments suggest that some “true” type 2 AGNs do exist [127, 165]. They are AGNs without a hidden BLR even in spectropolarimetric data [240]. The observed radius-luminosity relation for the BLR implies an increasing line width with decreasing luminosity for a given black . However, the upper limit to the observed width of broad emission lines in AGNs at 25000 km s-1 [229] may reflect a physical limit above which the BLR may not be able to survive [127]. The disappearance of the BLR has been linked to the critical radius at which the disk changes from gas pressure dominated to radiation pressure dominated, or to disk evaporation [56, 164]. For low enough accretion rates, the critical radius becomes smaller than the innermost stable orbit of the accretion disk and the BLR may not form [165]. The intrinsic (i.e., unabsorbed) X-ray luminosity and an estimation of using the relationship between nuclear mass and bulge luminosity in galaxies indicate that all hidden BLR sources have accretion rates 10-3. This is also approximately the limit at which double-peakers are found [283]. Naked AGNs may this be observed if .
7.2 On the Origin of Radio Loudness
RL activity in low sources is observed, and there are RL NLSy1s that radiate al [143]. There are no appreciable effects (within the limits set by ) on the H profile attributable to radio loudness. Pop. B RL and RQ sources can have the same and values. Therefore, it is not unreasonable to conclude that a similar range of and is physically possible for both RQ and RL sources [282]. However, this does not mean that the mass function and the distribution are necessarily the same for RL and RQ sources. RL and RQ sources are well separated in terms of in the E1 space [21] at low . A robust inference from a bootstrap analysis is that the mass function and the conditional probability of having certain values at fixed are different for the two AGN classes [143]. With the customary computation assumptions, in RL sources have been found to be M⊙, while only a few quasars may contain smaller black holes [92]. These conclusions are in agreement with studies based on the SDSS carried out using a sample of more than 6000 AGNs [151]. RL sources were found to harbor systematically more massive black holes than are the RQ quasars with very high significance (see also Ref. [63]). It is important that RQ and RL samples have indistinguishable distributions on the redshift-optical luminosity plane, excluding the possibility that either parameter is responsible for the observed difference [143, 150]. Quasars from the FIRST Bright Quasar Survey [13] fill in the gap between the RL and RQ quasars in the radio vs. optical luminosity plane, show a continuous variation of radio luminosity with and no evidence for a discontinuity that may signal the turning on of powerful radio jets [124]. We suggest that several factors drive the RQ/RL separation in the E1 space: intrinsic mass function and distribution differences, jet-related effects yielding [Oiii]4959,5007 enhancement in RL sources, and sample selection criteria [125, 21, 143]. The range in radio luminosity at a given is several orders of magnitude. Additional parameters other than and like evolution should be invoked to explain the quasar radio-loudness dichotomy [151].
8 At the Origin and at the End

8.1 Is the Emission Line Width Increasing with Luminosity?
A trend between FWHM(H) and luminosity is expected if the usual virial and - reasonings are applied. There is a well-defined lower boundary in the diagram vs. (see Fig. 15; [233]). Here we make the assumption that low-redshift NLSy1 with the narrowest lines radiate very close to the Eddington ratio. If we assume , we obtain FWHM(H) km s-1 for in solar units and FWHMmin(H). If we consider the luminosity dependence ofFWHM(H)min, we see that the expected trend for reproduces fairly well the FWHM(H) lower boundary as a function of . A less pronounced trend, especially at high luminosity, is expected for . The presence of a correlation between FWHM(H) and luminosity in a survey may depend on sample and intrinsic dispersion of FWHM values in a narrow range. One should consider that the expected luminosity dependence is very weak: FWHM(H) increases by km s-1 over an increase of , with FWHM(H)min changing from 1000 km s-1 to 2000 km s-1. In a narrow range, the FWHM(H) intrinsic scatter spans the range 1000–10000 km s-1, therefore making any correlation intrinsically very weak even if statistically significant. A very large sample from the 2dF and 6dF redshift surveys shows a weak increase of H line width with luminosity with a slope –0.2 ( vs. ), very close to the one derived from our calculation [48].
8.2 Lack of Evolution in the Feii Spectrum?
An analysis of the spectra of 12 high-redshift quasars in the region of Mgii2800 shows remarkable similarity with the LBQS composite (0.8; [237]). Near-infrared spectra of four QSOs located at have been recently analyzed [103]. Two out of four QSOs have significant FeiiUV. Spectra of three additional sources indicate FeiiUV/Mgii2800 similar to that observed in low- quasars [78, 9]. The FeiiUV/Mgii2800 ratio at high redshift should be a factor of 3 lower than for low-redshift QSOs if the age of the universe at the earlier epoch is much less than 1 Gyr [96]. This prediction is due to the delayed contribution of type Ia supernovæ to the iron abundance. Apart from the intriguing results for the highest quasars, systematic examinations of the FeiiUV/Mgii2800 intensity ratio with redshift suggest that the ratio may indeed decline at [104, 103]. LBQS spectra show a significant Baldwin effect in FeiiUV emission. Further analysis reveals that the primary correlation of iron emission strength is probably with , implying an evolutionary effect [87]. A very recent SDSS study based on 16000 spectra in the reshift range from 0.08 to 5.41 shows that the dominant redshift effect is a result of the evolution of the blended Feii emission (optical) and the Balmer continuum [285]. This redshift dependence can be explained by the evolution of chemical abundance in the quasar environment, or by an intrinsic change in the continuum itself [285]. In another study [251] quasars were grouped on the basis of their FeiiUV/Mgii2800 intensity ratios. The fraction of quasars in each group with strong FeiiUV/Mgii2800 dropped significantly at . To check whether there is a change in iron abundance at high redshifts observations covering Feiiopt are essential.
8.3 A Scheme of Physical Evolution for the AGNs
High- quasars must have accreted at a relatively high rate in the early stages of their evolution, if black holes of M⊙ were already radiating at [257, 266, 274]. From the low- data, it is tempting to understand the Eddington ratio as the age of an AGN within its total lifetime (i.e., considering the totality of the time spent by a black hole as a “switched on” AGN): AGNs with steep X-ray spectra, strong Feii, and weak [Oiii]5007 are AGNs in an early phase of their evolution, which proceeds roughly from the lower left corner ( ) of the optical plane of E1 toward the upper right corner (low , large ). In this hypothetical scenario local NLSy1s are the “seedlings” of AGNs [229, 88]. Several results and correlations associated to the optical E1 can be explained by an evolutionary sequence. RL seem to be systematically more massive than RQ sources. They also radiate at lower . They show extended NLRs with large W([Oiii]4959,5007). At the other end we have “blue outliers” which are Pop. A sources with strong winds. Young AGNs still possess a compact NLR; they may have plenty of fuel and may show spectral evidence of circum-nuclear Starbursts. More massive, evolved systems may have less fuel and have had all the time to ionize interstellar clouds in the bulge of their host galaxies as well as to produce radio lobes exceeding the host galaxy size. Dying quasars have a limited gas supply surrounding their continuum-emitting regions, and may at best produce emission lines through the illumination of a last “strip” or ring of optically thick material as it may be the case of double-peakers. In this sense, the sequence of E1 becomes literally an age sequence.
8.4 The Baldwin Effect


It is important to stress that the Baldwin effect is a very loose correlation between specific luminosity and Civ1549 equivalent width. Claims and counter-claims of a Baldwin effect on the basis of small samples (few tens of objects) are unreliable [229]; the statistical weakness of the Baldwin correlation implies that the effect becomes appreciable only if a very large range in luminosity is considered, 4 – 6 decades. As pointed out by Sulentic et al. [229], results until mid-1999 have led to a standard scenario in which the Baldwin effect occurs in all measurable HILs except Nv1240, and the slope of the Baldwin relationship (i.e., W(Civ1549), [5]) increases with ionization potential (e.g. [168]; see Ref. [96] for the implications of the apparent lack of any Baldwin effect for Nv1240). These results have been basically confirmed by more recent studies based on large quasar samples [54, 59, 198], LBQS [87] and SDSS [285] included. A source of dispersion involves low-luminosity objects that have low W(Civ1549) Å since they tend to blur even more the Baldwin relationship. These sources are NLSy1s that preferentially occupy the lower left part of a vs. diagram.
Claims of a Baldwin effect on Mgii2800 should be taken somewhat with care [285], since the underlying FeiiUV emission can be very strong as well as variable from source to source depending on the BLR physical conditions, and the FeiiUV behavior has a function of luminosity and redshift is still poorly understood. Similar claims for W(H) have been rather erratic and unconvincing due to small sample sizes and large intrinsic scatter (Refs. [146, 229] found no trend; Ref. [162, 273] did).
The [Oiii]4959,5007 lines seem to decrease in equivalent width with increasing luminosity [59, 162, 233, 285]. In the joint data of Refs. [233] and [140] there is definitely a significant correlation. Even if a luminosity correlation may not be always detectable (we stress again that the luminosity range must be very large) weak or no [Oiii]4959,5007 seems to be a common property of many luminous AGNs [162, 287]. The reason why [Oiii]4959,5007 seem to experience a Baldwin effect is presently not clear. It is possible that the [Oiii]4959,5007 luminosity is limited by the physical size of the NLR [162], or that we are seeing an evolutionary effect at high-, making high- sources more similar to low- Pop. A AGNs.
8.4.1 The Baldwin Effect as an Evolutionary Effect
A recent analysis of 80 PG quasars and one of 120 HST archive spectra indicates a strong correlation of W(Civ1549) with some of the emission parameters which define E1. Since drives the E1 correlations, may be the primary physical parameter behind the Baldwin effect for Civ1549 ([4, 11, 32]; Fig. 16). Also, high- quasars show large Civ1549 blueshifts like Pop. A sources at low- [198, 233, 225]. Near-IR, low resolution spectra of eight of the most distant quasars (in the range ) show that half of these quasars are characterized by deep, broad and blueshifted absorption features typical of BAL quasars [135]. Similarities and close association between NLSy1, BAL QSOs, strong Feii emission, and low W(Civ1549) led to the suggestions that NLSy1s might be Seyfert galaxies in their early stage of evolution and as such may be low-redshift, low-luminosity analogues of high-redshift quasars [144, 229]. The Civ1549 profiles show decreasing equivalent widths with increasing luminosity and the line profiles become similar to the “trapezoidal” shapes often observed in low- NLSy1s [266]. However, a direct comparison of composite spectra of NLSy1 and 4 quasars through a PCA suggests that high- quasi-stellar objects do not show a strong preference toward NLSy1 behavior [46]. Since this result is sample dependent and the mass-luminosity diagram of quasars can be similar up to [48], it is still debatable whether evolution of with , selection effects or a combination of both may lead to the Baldwin effect [229]. After all, we are not observing other evolutionary effects even at . What seems unlikely is that the driving parameter of the Baldwin effect is [265]. Computing employing FWHM(Civ1549) and assuming virial motions does not demonstrate that is driving the Baldwin effect because it is assumed to be , and this assumption leads, in part, to circular reasoning.
8.5 Quasars as Standard Candles
The Supernova Cosmology Project results supporting a cosmological constant 0 are still highly uncertain. The expected effect is just a few tens of magnitude at , and goes down to 0 at . A robust verification of a cosmological model with relative energy density and 0.72 would require accurate measurements of standard candles in the range , as it can be seen from the Hubble diagram with type Ia supernovæ [200, 201].
It is clear from the previous discussion that, at high , we are observing quasars that can be very similar to the AGNs we are observing at low , in terms of line width, Feii prominence, HIL equivalent widths. Trends with are much better defined than trends with luminosity. Luminosity effects remain weak and prone to sample bias (see, for example, Fig. 16, where the Baldwin effect is not significant while W(Civ1549) shows a significant correlation with ). Furthermore, seems to affect many parameters related to physics and structure of the BLR, from LIL widths to HIL shifts and ionization degree. It makes therefore sense to use E1 correlations to estimate . If is known with reasonable accuracy, it may become possible to retrieve -independent information on . In principle, this can be achieved through two methods:
Instruments like the infrared spectrometers mounted on 10-m sized telescopes make possible observations of intermediate redshift quasars (1 2.2) with and resolution sufficient to apply the same data analysis procedure used for optical spectra of sources with . If these data are available, it is possible to measure the E1 parameters and to build an extension of “optical” E1 diagram. To fully exploit the E1 diagram, orientation needs to be estimated on an object-by-object basis. In the case of a radiation pressure driven wind, the Civ1549 shift and profile shape should be sensitive to both and . Therefore, Civ1549 measurements may provide an independent estimate of orientation, and hence a 3D observational parameter space to map into a 3D physical space (, , ) which will ultimately yield a redshift-independent estimate of the luminosity (if an accurate low- calibration can be defined). Merging results on and on from the previous analysis, it is reasonable to infer that, if is known within , errors could be 60% on , 80% on . If errors are distributed randomly, an uncertainty as high as could be farther reduced if samples of sources within a spectral type are averaged, yielding valuable data points for the Hubble diagram.
9 Conclusion
The main purpose of this paper was to point out how it is becoming possible to measure accretion parameters (especially and ) of AGNs. We highlighted major results and sources of uncertainty, as well as the connections between and , the structure of the broad line emitting region, and physical evolution. If we compare our present knowledge to the one of about 10 years ago, we can see an impressive progress. determinations through the virial assumption have become widely popular, and have been applied to quasars at all known , up to 6.4, even if several sources of uncertainty limit strongly the accuracy by which is known for individual objects. It has been possible to show that many line properties and trends (including the Baldwin effect) correlate with , and the the BLR structure is strongly affected by through E1. There is no doubt that we have a much better framework with a strong observational support to understand the BLR structure, minority objects like “double-peakers” and BAL QSOs, and source evolution. Improvements on and estimates are possible through new multivariate analysis including orientation sensitive parameters, or through disk and wind BLR models accounting for the combined effects on line parameters of orientation and physics. We may be able to achieve a satisfactory vision of quasar structural evolution (not to mention boundaries on cosmography) well before the emitting regions may be resolved through space interferometry missions (e.g., Ref. [245]).
We thank Dr. Massimo Calvani for a careful reading of the manuscript.
References
- [1] Antonucci, R. 1993, ARAAp, 31, 473
- [2] Aoki, K., Kawaguchi, T., & Ohta, K. 2004, ArXiv Astrophysics e-prints, astro-ph/0409546
- [3] Bachev, R. 1999, AAp, 348, 71
- [4] Bachev, R., Marziani, P., Sulentic, J. W., Zamanov, R., Calvani, M., & Dultzin-Hacyan, D. 2004, ApJ, 617, 171
- [5] Baldwin, J. A. 1977, ApJ, 214, 679
- [6] Baldwin, J. A., Ferland, G. J., Korista, K. T., Hamann, F., & LaCluyzé, A. 2004, ApJ, 615, 610
- [7] Baldwin, J., Ferland, G., Korista, K., & Verner, D. 1995, ApJL, 455, L119
- [8] Bardeen, J.M., & Petterson, J.A., 1975, ApJL, 195, 65
- [9] Barth, A. J., Martini, P., Nelson, C. H., & Ho, L. C. 2003, ApJl, 594, L95
- [10] Barvainis, R., Lehar, J., Birkinshaw, M., Falke, H., & Blundell, K. M. 2004, ArXiv Astrophysics e-prints, astro-ph/0409554
- [11] Baskin, A. & Laor, A. 2004, MNRAS, 350, L31
- [12] Baskin, A. & Laor, A. 2004, ArXiv Astrophysics e-prints, astro-ph/0409196
- [13] Becker, R. H., White, R. L., & Helfand, D. J. 1995, ApJ, 450, 559
- [14] Bian, W., & Zhao, Y. 2002, AAp, 395, 465
- [15] Bicknell, G. V. 2002, New Astronomy Review, 46, 365
- [16] Blandford, R. D., Netzer, H., Woltjer, L., Courvoisier, T. J.-L., & Mayor, M. 1990, Saas-Fee Advanced Course 20. Lecture Notes 1990. Swiss Society for Astrophysics and Astronomy, XII, 280 pp. 97 figs.. Springer-Verlag Berlin Heidelberg New York,
- [17] Blandford, R. D., & Znajek, R. L. 1977, MNRAS, 179, 433
- [18] Boller, Th., Brandt, W.N., Fink, H.H., 1996, AAp, 305, 53 (BBF96)
- [19] Boller, Th., Brandt, W.N., Fabian, A.C. & Fink, H.H., 1997, MNRAS, 289,393-405
- [20] Boller, T., Gallo, L. C., Lutz, D., & Sturm, E. 2002, MNRAS, 336, 1143
- [21] Boroson, T. A. 2002, ApJ, 565, 78
- [22] Boroson T.A., Green R.F., 1992, ApJS 80, 190
- [23] Boroson, T. A. & Meyers, K. A. 1992, ApJ, 397, 442
- [24] Boroson, T. A., & Oke, J. B. 1987, PASP, 99, 809
- [25] Bottorff, M., Korista, K. T., Shlosman, I., & Blandford, R. D. 1997, ApJ, 479, 200
- [26] Braito, V., et al. 2004, AAp, 420, 79
- [27] Breeveld, A. A., Puchnarewicz, E. M., & Otani, C. 2001, MNRAS, 325, 772
- [28] Brinkmann, W., Papadakis, I. E., Ferrero, E., 2004, AAp, 414,107
- [29] Brotherton, M. S. 1996, ApJS, 102, 1
- [30] Brotherton, M. S., Wills, B. J., Steidel, C. C., & Sargent, W. L. W. 1994, ApJ,423, 131
- [31] Brotherton, M. S., Wills, B. J., Francis, P. J., & Steidel, C. C. 1994, ApJ, 430, 495
- [32] Calvani, M., Marziani, P., Bachev, R., Sulentic, J. W., Zamanov, R. K., & Dultzin-Hacyan, D. 2004, Memorie della Societa Astronomica Italiana Supplement, 5, 223
- [33] Calvani, M., Marziani, P., & Sulentic, J. 1997, Memorie della Societa Astronomica Italiana, 68, 93
- [34] Camenzind, M. 2004, ArXiv Astrophysics e-prints, astro-ph/0411573
- [35] Camenzind, M., & Krockenberger, M. A. 1992, AAp, 255, 59
- [36] Capetti, A., Axon, D. J., Macchetto, F., Sparks, W. B., & Boksenberg, A. 1996, ApJ, 469, 554
- [37] Caproni A., Abraham Z., 2004, ApJ, 602, 625
- [38] Chen, K., & Halpern, J. P. 1989, ApJ, 344, 115
- [39] Chiang, J., & Murray, N. 1996, ApJ, 466, 704
- [40] Collier, S., et al. 2001, ApJ, 561, 146
- [41] Collin, S., Boisson, C., Mouchet, M., Dumont, A.-M., Coupé, S., Porquet, D., & Rokaki, E. 2002, AAp, 388, 771
- [42] Collin, S., & Hur , J.-M. 2001, AAp, 372, 50
- [43] Collin, S., & Joly, M. 2000, New Astronomy Review, 44, 531
- [44] Collin-Souffrin, S., Dyson, J. E., McDowell, J. C., & Perry, J. J. 1988, MNRAS,232, 539
- [45] Comastri , A., Setti, G., Zamorani, G., Elvis, M., Giommi, P., Wilkes, B.J., & McDowell. J.C. 1992, ApJ, 384, 62
- [46] Constantin, A., & Shields, J. C. 2003, PASP, 115, 592
- [47] Conway, J. E., & Wrobel, J. M. 1995, ApJ, 439, 98
- [48] Corbett, E. A., et al. 2003, MNRAS, 343, 705
- [49] Corbin, M. R. 1997, ApJ, 485, 517
- [50] Corbin, M. R., & Boroson, T. A. 1996, ApJS, 107, 69
- [51] Crenshaw, D.M., et al. 1996, ApJ, 470, 322
- [52] Crenshaw, D. M., et al. 2002, ApJ, 566, 187
- [53] Cresci, G., Maiolino, R., Marconi, A., Mannucci, F., & Granato, G. L. 2004, AAp, 423, L13
- [54] Croom, S. M., et al. 2002, MNRAS, 337, 275
- [55] Czerny, B., Nikoajuk, M., Piasecki, M., & Kuraszkiewicz, J. 2001, MNRAS,325, 865
- [56] Czerny, B., Rózańska, A., & Kuraszkiewicz, J. 2004, AAp, 428, 39
- [57] Davies, R. I., Tacconi, L. J., & Genzel, R. 2004, pJ, 613, 781
- [58] Dietrich, M., Hamann, F., Appenzeller, I., & Vestergaard, M. 2003, ApJ, 596, 817
- [59] Dietrich, M., Hamann, F., Shields, J. C., Constantin, A., Vestergaard, M., Chaffee, F., Foltz, C. B., & Junkkarinen, V. T. 2002, ApJ, 581, 912
- [60] Dietrich, M., & Hamann, F. 2004, ApJ, 611, 761
- [61] Dong, X., Zhou, H., Wang, T., Wang, J., Li, C., & Zhou, Y. 2004, ArXiv Astrophysics e-prints, astro-ph/0411171
- [62] Dultzin-Hacyan, D., Marziani, P., & Sulentic, J. W. 2000, Revista Mexicana de Astronomia y Astrofisica Conference Series, 9, 308
- [63] Dunlop, J. S., McLure, R. J., Kukula, M. J., Baum, S. A., O’Dea, C. P., & Hughes, D. H. 2003, MNRAS, 340, 1095
- [64] Elvis, M. 2000, ApJ, 545, 63
- [65] Elvis, M., et al. 1994, ApJS, 95, 1
- [66] Eracleous, M., et al. 1997, ApJ, 490, 216.
- [67] Eracleous, M., & Halpern, J. P. 2003, ApJ, 599, 886
- [68] Eracleous, M., Halpern, J. P., Storchi-Bergmann, T., Filippenko, A. V., Wilson, A. S., & Livio, M. 2004, ArXiv Astrophysics e-prints, astro-ph/0404506
- [69] Fabian, A. C. 1979, Royal Society of London Proceedings Series A, 366, 449
- [70] Falcke, H., Wilson, A. S., & Simpson, C. 1998, ApJ, 502, 199
- [71] Ferland, G. J. 2000, Revista Mexicana de Astronomia y Astrofisica Conference Series, 9, 153
- [72] Ferrarese, L., & Merritt, D. 2000, ApJL, 539, L9
- [73] Floyd, D. J. E., Kukula, M. J., Dunlop, J. S., McLure, R. J., Miller, L., Percival, W. J., Baum, S. A., & O’Dea, C. P. 2004, MNRAS, 355, 196
- [74] Forster, K., & Halpern, J. P. 1996, ApJ, 468, 565
- [75] Freeman, P. E., Doe, S., Siemiginowska, A. 2001, SPIE Proceedings vol.4477, 76
- [76] Francis, P. J., Drake, C. L., Whiting, M. T., Drinkwater, M. J., & Webster, R. L. 2001, Publications of the Astronomical Society of Australia, 18, 221
- [77] Francis, P. J., Hewett, P. C., Foltz, C. B., Chaffee, F. H., Weymann, R. J., & Morris, S. L. 1991, ApJ, 373, 465
- [78] Freudling, W., Corbin, M. R., & Korista, K. T. 2003, ApJL, 587, L67
- [79] Gallo, L.C., Boller, Th., Tanaka, Y., Fabian, A.C., Brandt, W.N., Welsh, W.F., Anabuki, N. & Haba, Y., 2004, MNRAS, 347, 269-276
- [80] Gammie, C. F., Shapiro, S. L., & McKinney, J. C. 2004, ApJ, 602, 312
- [81] Garcia-Barreto, J. A., Franco, J., Guichard, J., & Carrillo, R. 1995, ApJ, 451, 156
- [82] Gaskell, C. M. 1996, ApJ, 464, L107
- [83] Gaskell, C. M., Goosmann, R. W., Antonucci, R. R. J., & Whysong, D. H. 2004, ApJ, 616, 147
- [84] Ghisellini, G., Padovani, P., Celotti, A., & Maraschi, L. 1993, ApJ, 407, 65
- [85] Gierlinski & Done, C., 2004, MNRAS, 349, L7
- [86] Giveon, U., Maoz, D., Kaspi, S., Netzer, H., & Smith, P. S. 1999, MNRAS, 306, 637
- [87] Green, P. J., Forster, K., & Kuraszkiewicz, J. 2001, ApJ, 556, 727
- [88] Grupe, D. 2004, AJ, 127, 1799
- [89] Grupe, D., Beuermann, K., Mannheim, K., & Thomas, H.-C. 1999, AAp, 350, 805
- [90] Grupe, D., Beuermann, K., Thomas, H.-C., Mannheim, K., & Fink, H. H. 1998, AAp, 330, 25
- [91] Grupe, D., Thomas, H.-C., & Beuermann, K. 2001, AAp, 367, 470
- [92] Gu, M., Cao, X., & Jiang, D. R. 2001, MNRAS, 327, 1111
- [93] Gu, Q., Dultzin-Hacyan, D., & de Diego, J. A. 2001, Revista Mexicana de Astronomia y Astrofisica, 37, 3
- [94] Haiman, Z., Quataert, E., & Bower, G. C. 2004, ApJ, 612, 698
- [95] Halpern, J. P., Eracleous, M., Filippenko, A. V., & Chen, K. 1996, ApJ, 464, 704
- [96] Hamann, F., & Ferland, G. 1999, ARAAp, 37, 487
- [97] Hartig, G. F. & Baldwin, J. A. 1986, ApJ, 302, 64
- [98] Hes, R., Barthel, P. D., & Fosbury, R. A. E. 1993, Nature, 362, 326
- [99] Ho, L. C. 2002, ApJ, 564, 120
- [100] Horne, K., Peterson, B. M., Collier, S. J., & Netzer, H. 2004, PASP, 116, 465
- [101] Hughes, S. A. & Blandford, R. D. 2003, ApJl, 585, L101
- [102] Imanishi, M., & Wada, K. 2004, ApJ, 617, 214
- [103] Iwamuro, F., Kimura, M., Eto, S., Maihara, T., Motohara, K., Yoshii, Y., & Doi, M. 2004, ApJ, 614, 69
- [104] Iwamuro, F., Motohara, K., Maihara, T., Kimura, M., Yoshii, Y., & Doi, M. 2002, ApJ, 565, 63
- [105] Jarvis, M. J., & McLure, R. J. 2002, MNRAS, 336, L38
- [106] Joly, M. 1991, AAp, 242, 49
- [107] Joly, M. 1987, AAp, 184, 33
- [108] Kaspi, S., Smith, P. S., Netzer, H., Maoz, D., Jannuzi, B. T., & Giveon, U. 2000, ApJ, 533, 631
- [109] Kidger, M., Takalo, L., Sillanpåå, A.: 1992, AAp, 264, 32
- [110] Klimek, E.S., Gaskell, C.M. & Hedrick, C.H., 2004, ApJ, 609, 69-79
- [111] Kollatschny, W. 2003, AAp, 412, L61
- [112] Kollatschny, W. 2003, AAp, 407, 461
- [113] Kollatschny, W., & Bischoff, K. 2002, AAp, 386, L19
- [114] Kollatschny, W., Bischoff, K., Robinson, E.L., Welsh, W.F. & Hill, G.J., 2001, AAp, 379, 125-135
- [115] Korista, K., Baldwin, J., Ferland, G., & Verner, D. 1997, ApJS, 108, 401
- [116] Korista, K. T., & Goad, M. R. 2004, ApJ, 606, 749
- [117] Korista, K. T., Voit, G. M., Morris, S. L., & Weymann, R. J. 1993, ApJS, 88, 357
- [118] Krichbaum, T. P., et al. 2004, ArXiv Astrophysics e-prints, astro-ph/0411487
- [119] Krongold, Y., Dultzin-Hacyan, D., & Marziani, P. 2001, AJ, 121, 702
- [120] Krongold, Y., Nicastro, F., Brickhouse, N. S., Elvis, M., Liedahl, D. A., & Mathur, S. 2003, ApJ, 597, 832
- [121] Kuraszkiewicz, J. K., Green, P. J., Crenshaw, D. M., Dunn, J., Forster, K., Vestergaard, M., & Aldcroft, T. L. 2004, ApJS, 150, 165
- [122] Kuraszkiewicz, J. K., Green, P. J., Forster, K., Aldcroft, T. L., Evans, I. N., & Koratkar, A. 2002, ApJS, 143, 257
- [123] Krolik, J. H. 2001, ApJ, 551, 72
- [124] Lacy, M., Laurent-Muehleisen, S. A., Ridgway, S. E., Becker, R. H., & White, R. L. 2001, ApJl, 551, L17
- [125] Laor, A. 2000, ApJL, 543, L111
- [126] Laor, A. 2001, ApJ, 553, 677
- [127] Laor, A. 2003, ApJ, 590, 86
- [128] Lehto, H. J., Valtonen, M. J., 1996, ApJ 460, 207
- [129] Leighly, K. M. 1999, ApJS, 125, 317
- [130] Leighly, K. M. 2004, ApJ, 611, 125
- [131] Leighly, K. M., & Moore, J. R. 2004, ApJ, 611, 107
- [132] Lewis, K. T., Eracleous, M., Halpern, J. P., & Storchi-Bergmann, T. 2004, ArXiv Astrophysics e-prints, astro-ph/0404342
- [133] Lipari, S., Terlevich, R., & Macchetto, F. 1993, ApJ, 406, 451
- [134] Lobanov, A. P., & Roland, J. 2004, ArXiv Astrophysics e-prints, astro-ph/0411417
- [135] Maiolino, R., Oliva, E., Ghinassi, F., Pedani, M., Mannucci, F., Mujica, R., & Juarez, Y. 2004, AAp, 420, 889
- [136] Marziani, P., & Sulentic, J. W. 1993, ApJ, 409, 612
- [137] Marziani, P., Sulentic, J. W., Calvani, M., Perez, E., Moles, M., & Penston, M. V. 1993, ApJ, 410, 56
- [138] Marziani P., Sulentic J.W., Dultzin-Hacyan D., Calvani M., Moles M., 1996, ApJS 104, 37
- [139] Marziani P., Sulentic J.W., Zwitter T., Dultzin-Hacyan D., Calvani M., 2001, ApJ, 558, 553 (M01)
- [140] Marziani P., Sulentic J. W., Zamanov R., Calvani M., Dultzin-Hacyan D., Bachev R., Zwitter T., 2003a, ApJS, 145, 199 (M03)
- [141] Marziani, P., Sulentic, J. W., Zamanov, R., Calvani, M., Della Valle, M., Stirpe, G., & Dultzin-Hacyan, D. 2003, Memorie della Societa Astronomica Italiana Supplement, 3, 218
- [142] Marziani, P., Zamanov, R., Sulentic, J. W., Dultzin-Hacyan, D., Bongardo, C., & Calvani, M. 2003b, ASP Conf. Ser. 290: Active Galactic Nuclei: From Central Engine to Host Galaxy, 229
- [143] Marziani P., Zamanov R., Sulentic J. W., Calvani M., 2003c, MNRAS, 345, 1133 S. 2000, MNRAS, 314, L17
- [144] Mathur, S. 2000, MNRAS, 314, L17
- [145] Mathur, S., Kuraszkiewicz, J., & Czerny, B. 2001, New Astronomy, 6, 321
- [146] McIntosh, D. H., Rieke, M. J., Rix, H.-W., Foltz, C. B., & Weymann, R. J. 1999, ApJ, 514, 40
- [147] McLure, R. J., & Dunlop, J. S. 2001, MNRAS, 327, 199
- [148] McLure, R. J., & Dunlop, J. S. 2002, MNRAS, 331, 795
- [149] McLure, R. J., & Dunlop, J. S. 2004, MNRAS, 352, 1390
- [150] McLure, R. J., & Jarvis, M. J. 2002, MNRAS, 337, 109
- [151] McLure, R. J., & Jarvis, M. J. 2004, MNRAS, 353, L45
- [152] Merloni, A., Heinz, S., & di Matteo, T. 2003, MNRAS, 345, 1057
- [153] Miller, H.R. Ferrara, E.C., McFarland, J.P., Wilson, J.W., Daya, A.B., Fried, R.E., 2000, New Astron. Rev., 44, 539
- [154] Moran, E. C., Halpern, J. P., & Helfand, D. J. 1996, ApJS, 106, 341
- [155] Murray, N., & Chiang, J. 1997, ApJ, 474, 91
- [156] Murtagh, F. & Heck, A. 1987, Astrophysics and Space Science Library, Dordrecht: Reidel, 1987
- [157] Mushotzki, R.F., Done, C., Pounds, K.A., 1993, ARAAp, 31, 717
- [158] Nagao, T., Murayama, T. & Taniguchi, Y., 2001, ApJ, 546, 744-758
- [159] Narayan, R. 2004, ArXiv Astrophysics e-prints, astro-ph/0411385
- [160] Nelson, C. H., Green, R. F., Bower, G., Gebhardt, K., & Weistrop, D. 2004, ApJ, 615, 652
- [161] Nelson, C. H. 2000, ApJl, 544, L91
- [162] Netzer, H., Shemmer, O., Maiolino, R., Oliva, E., Croom, S., Corbett, E., & di Fabrizio, L. 2004, ApJ, 614, 558
- [163] Newman, J. A., Eracleous, M., Filippenko, A. V., & Halpern, J. P. 1997, ApJ,485, 570
- [164] Nicastro, F. 2000, ApJL, 530, L65
- [165] Nicastro, F., Martocchia, A., & Matt, G. 2003, ApJL, 589, L13
- [166] Onken, C. A., Ferrarese, L., Merritt, D., Peterson, B. M., Pogge, R. W., Vestergaard, M., & Wandel, A. 2004, ApJ, 615, 645
- [167] Oshlack, A. Y. K. N., Webster, R. L., & Whiting, M. T. 2002, ApJ, 576, 81
- [168] Osmer, P. S., & Shields, J. C. 1999, Astronomical Society of the Pacific Conference Series, 162, 235
- [169] Netzer, H. 2003, ApJL, 583, L5
- [170] Netzer, H. 1990, in Blandford, R. D., Netzer, H., Woltjer, L., Courvoisier, T. J.-L., & Mayor, M. 1990, Saas-Fee Advanced Course 20. Lecture Notes 1990. Swiss Society for Astrophysics and Astronomy, XII, 280 pp. 97 Springer-Verlag Berlin Heidelberg New York,
- [171] Ostorero, L.; Villata, M.; Raiteri, C. M. 2004, AAp, 419, 913.
- [172] Osterbrock, D.E., Pogge, R.W., 1985, ApJ, 297, 166
- [173] Padovani, P., Allen, M. G., Rosati, P., & Walton, N. A. 2004, AAp, 424, 545
- [174] Page, K. L., Reeves, J. N., O’Brien, P. T., Turner, M. J. L., & Worrall, D. M. 2004, MNRAS, 353, 133
- [175] Paul C., Brotherton M.S., Diamond-Stanic A.), Vanden Berk D., Canalizo G. 2005, BAAS, in press
- [176] Peterson, B. M. 1993, PASP, 105, 247
- [177] Peterson, B. M. 1997, An introduction to active galactic nuclei, Cambridge, New York Cambridge University Press, 1997
- [178] Peterson, B. M. 2004, ArXiv Astrophysics e-prints, astro-ph/0404539
- [179] Peterson, B. M., et al. 2004, ApJ, 613, 682
- [180] Peterson, B.M., et al. 2000, ApJ, 542, 161
- [181] Peterson, B. M., et al. 2002, ApJ, 581, 197
- [182] Peterson, B. M. & Horne, K. 2004, ArXiv Astrophysics e-prints, astro-ph/0407538
- [183] Peterson, B.M., Korista, K.T., & Wagner, R.M., 1989, AJ, 98, 100
- [184] Peterson, B. M., Wanders, I., Horne, K., Collier, S., Alexander, T., Kaspi, S., & Maoz, D. 1998, PASP, 110, 660
- [185] Pica, A.J., Smith, A.G., Webb, J.R., Leacock, R.J., Clements, S., & Gombola, P.P. 1988, AJ, 96, 1215
- [186] Piconcelli, E., Jim nez-Bailon, E., Guainazzi, M., et al., 2004, MNRAS, 351, 161
- [187] Popović, L. Č., Mediavilla, E., Bon, E., & Ilić, D. 2004, AAp, 423, 909
- [188] Popović, L. Č. 2003, ApJ, 599, 140
- [189] Porquet, D., Reeves, J. N., O’Brien, P., & Brinkmann, W. 2004, AAp, 422, 85
- [190] Proga, D., Stone, J. M., & Kallman, T. R. 2000, ApJ, 543, 686
- [191] Pounds, K. A., King, A. R., Page, K. L., & O’Brien, P. T. 2003, MNRAS, 346, 1025
- [192] Pounds, K. A., Reeves, J. N., King, A. R., Page, K. L., O’Brien, P. T., & Turner, M. J. L. 2003, MNRAS, 345, 705
- [193] Pounds, K. A., Reeves, J. N., Page, K. L., Edelson, R., Matt, G., & Perola, G. C. 2003, MNRAS, 341, 953
- [194] Pursimo, T., Takalo, L.O., Sillanpåå, A., Kidger, M., Lethto, H.J., Heidt, J., Charles, P.A., Aller, H., Aller, M., Beckmann, V., and 61 coauthors, 2000, AApS, 146, 141.
- [195] Reeves, J. N., & Turner, M. J. L., 2000, MNRAS, 316, 234
- [196] Reichard, T. A., et al. 2003, AJ, 125,1711
- [197] Reichard, T. A., et al. 2003, AJ, 126, 2594
- [198] Richards, G. T., Vanden Berk, D. E., Reichard, T. A., Hall, P. B., Schneider, D. P., SubbaRao, M., Thakar, A. R., & York, D. G. 2002, AJ, 124, 1
- [199] Richards, G. T., et al. 2003, AJ, 126, 1131
- [200] Riess, A. G. et al. 2001, ApJ, 560, 49
- [201] Riess, A. G., et al. 2004, ApJ, 607, 665
- [202] Rodríguez-Ardila, A., & Viegas, S. M. 2003, MNRAS, 340, L33
- [203] Rodríguez-Pascual, P.M., Mas-Hesse, J.M., Santos-Lleo, M., 1997, AAp, 327, 72
- [204] Rokaki, E., Lawrence, A., Economou, F., & Mastichiadis, A. 2003, MNRAS,340, 1298
- [205] Romano, P., Turner, T. J., Mathur, S., & George, I. M. 2002, ApJ, 564, 162
- [206] Ross, R. R., & Fabian, A. C. 1993, MNRAS, 261, 74
- [207] Saslaw, W. C., Waltonen, M. J., & Aarseth, S. J. 1974, ApJ, 190, 253
- [208] Schneider, D. P., et al. 2002, AJ, 123, 567
- [209] Scott, J. E., Kriss, G. A., Brotherton, M., Green, R. F., Hutchings, J., Shull, J. M., & Zheng, W. 2004, ApJ, 615, 135
- [210] http://www.sdss.org
- [211] Shakura, N. I., & Sunyaev, R. A. 1973, AAp, 24, 337
- [212] Shang, Z., et al. 2004, ArXiv Astrophysics e-prints, astro-ph/0409697
- [213] Shang, Z., Wills, B. J., Robinson, E. L., Wills, D., Laor, A., Xie, B., & Yuan, J. 2003, ApJ, 586, 52
- [214] Shields, J. C., Ferland, G. J., & Peterson, B. M. 1995, ApJ, 441, 507
- [215] Stepanian, J. A., et al. 2003, ApJ, 588, 746
- [216] Strateva, I. V., et al. 2003, AJ, 126, 1720
- [217] Shapovalova, A.I., Burenkov, A.N., Carrasco, L., Chavushyan, V.H., Doroshenko, V.T., Dumont, A.M., Lyuty, V.M., Vald s, J.R., Vlasuyk, V.V., Bochkarev, N.G., 2001, AAp, 376, 775.
- [218] Shapovalova, A. I., et al. 2004, AAp, 422, 925
- [219] Shields, G. A. 1996, ApJL, 461, L9
- [220] Shields, G. A., Gebhardt, K., Salviander, S., Wills, B. J., Xie, B., Brotherton, M. S., Yuan, J., & Dietrich, M. 2003, ApJ, 583, 124
- [221] Sigut, T. A. A., Pradhan, A. K., & Nahar, S. N. 2004, ApJ, 611, 81
- [222] Sillanpåå, A., et al. 1996, A & A, in press
- [223] Sillanpåå, A., Haarala S., Valtonen M. J., Sundelius B., Byrd G. G., 1988, ApJ,325, 628.
- [224] Storchi-Bergmann, T., et al. 2003, ApJ, 598, 956
- [225] Sulentic, J. W., Dultzin-Hacyan, D., Marziani, P., C. Bongardo, V. Braito, M. Calvani, Zamanov, R., 2005, RevMexAAp, submitted
- [226] Sulentic, J. W. & Marziani, P. 1999, ApJL, 518, L9
- [227] Sulentic, J. W., Marziani, P., & Calvani, M. 1998, ApJL, 497, L65
- [228] Sulentic, J. W., Marziani, P., Zwitter, T., & Calvani, M. 1995, ApJL, 438, L1
- [229] Sulentic, J. W., Marziani, P., & Dultzin-Hacyan, D. 2000a, ARA&A, 38, 521
- [230] Sulentic, J. W., Marziani, P., Zamanov, R., Bachev, R., Calvani, M., & Dultzin-Hacyan, D. 2002, ApJ, 566, L71
- [231] Sulentic, J. W., Marziani, P., Zwitter, T., Dultzin-Hacyan, D., & Calvani, M. 2000b, ApJ, 545, L15
- [232] Sulentic, J. W., Marziani, P., Zwitter, T., Dultzin-Hacyan, D., & Calvani, M. 2000, ApJL, 545, L15
- [233] Sulentic, J. W., Stirpe, G. M., Marziani, P., Zamanov, R., Calvani, M., & Braito, V. 2004, ArXiv Astrophysics e-prints, astro-ph/0405279
- [234] Sulentic J. W., Zamfir S., Marziani P., Bachev R., Calvani M., Dultzin-Hacyan D., 2003, ApJ, 597, L17
- [235] Sulentic, J. W., Zheng, W., Calvani, M., & Marziani, P. 1990, ApJL, 355, L15
- [236] Ter sranta, H., Valtaoja, E.: 1995, Private Communication
- [237] Thompson K. L., Hill G. J., Elston R. 1999. ApJ, 515, 487
- [238] Thorne, K. S. 1974, ApJ, 191,507
- [239] Tolea, A., Krolik, J. H., & Tsvetanov, Z. 2002, ApJL, 578, L31
- [240] Tran, H. D. 2001, ApJL, 554, L19
- [241] Turner, T.J., George, I.M., Nandra, K., & Turcan, D., 1999, ApJ, 524, 667
- [242] Turnshek, D. A. 1984, ApJ, 280, 51
- [243] Turnshek, D. A., Monier, E. M., Sirola, C. J., & Espey, B. R. 1997, ApJ, 476, 40
- [244] Ulrich, M.-H., Maraschi, L., & Urry, C.M., 1997, ARAAp, 35, 445
- [245] Unwin, S. C., Wehrle, A. E., Jones, D. L., Meier, D. L., & Piner, B. G. 2002, Publications of the Astronomical Society of Australia, 19, 5
- [246] Valtonen, M. J.; Lehto, H. J.; Pietil , H., 1999, AAp, 342, 29.
- [247] Vanden Berk, D. E., et al. 2001, AJ, 122, 549
- [248] Vaughan, S., Reeves,J., Warwick, R., & Edelson, R. 1999, MNRAS, 309, 113
- [249] Verner, E., Bruhweiler, F., Verner, D., Johansson, S., & Gull, T. 2003, ApJL,592, L59
- [250] Verner, E., Bruhweiler, F., Verner, D., Johansson, S., Kallman, T., & Gull, T. 2004, ApJ, 611, 780
- [251] Verner, E. M., & Peterson, B. A. 2004, ApJL, 608, L85
- [252] Verner, E. M., Verner, D. A., Korista, K. T., Ferguson, J. W., Hamann, F., & Ferland, G. J. 1999, ApJS, 120, 101
- [253] Véron-Cetty, M.-P. & Véron, P. 2003, AAp, 412, 399
- [254] Véron-Cetty, M.-P., Véron, P., & Gonçalves, A. C. 2001, AAp, 372, 730
- [255] Véron-Cetty, M.-P., Joly, M., & Véron, P. 2004, AAp 417, 515
- [256] Vestergaard, M. 2002, ApJ, 571, 733
- [257] Vestergaard, M. 2004, ApJ, 601, 676
- [258] Vestergaard, M., & Wilkes, B. J. 2001, ApJS, 134, 1
- [259] Vicente, L, et al., 1995, in Extragalactic Radio Sources , IAU symposium 175, Bologna.
- [260] Villata, M., & Raiteri, C. M. 1999, AAp, 347, 30
- [261] Wampler, E. J. 1986, AAp, 161, 223
- [262] Wandel, A., Peterson, B. M., & Malkan, M. A. 1999, ApJ, 526, 579
- [263] Wang, T., Brinkmann, W., Bergeron, J., 1996, AAp, 309, 81
- [264] Wang, T., & Zhang, X. 2003, MNRAS, 340, 793
- [265] Warner, C., Hamann, F., & Dietrich, M. 2003, ApJ, 596, 72
- [266] Warner, C., Hamann, F., & Dietrich, M. 2004, ApJ, 608, 136
- [267] Webb, J.R., Smith, A.G., Leacock, R.J., Fitzgibbons, G.L., Gombola, P.P., & Shepherd, D.W. 1988, AJ, 95, 374
- [268] Webb, W. & Malkan, M., 2000, ApJ, 540, 652-677
- [269] Weymann R.J., Morris S.L., Foltz C.B., Hewett P.C., 1991, ApJ 373, 23
- [270] Wang, T., & Zhang, X. 2003, MNRAS, 340, 793
- [271] Whittle, M. 1992, ApJS, 79, 49
- [272] Wilkes, B. J., & Elvis, M. 1987, ApJ, 323, 243
- [273] Wilkes, B. J., Kuraszkiewicz, J., Green, P. J., Mathur, S., & McDowell, J. C. 1999, ApJ, 513, 76
- [274] Willott, C. J., McLure, R. J., & Jarvis, M. J. 2003, ApJL, 587, L15
- [275] Wills, B. J., & Browne, I. W. A. 1986, ApJ, 302, 56
- [276] Wills, B. J., Netzer, H., & Wills, D. 1985, ApJ, 288, 94
- [277] Wills, B. J., Brotherton, M. S., Fang, D., Steidel, C. C., & Sargent, W. L. W. 1993, ApJ, 415, 563
- [278] Wills, B. J., Brandt, W. N., & Laor, A. 1999, ApJL, 520, L91
- [279] Wills, B. J., & Shang, Z. 2004, Advances in Space Research, 34, 2584
- [280] Wilson, A. S., & Colbert, E. J. M. 1995, ApJ, 438, 62
- [281] Woo, J., & Urry, C. M. 2002, ApJ, 579, 530
- [282] Woo, J., & Urry, C. M. 2002, ApJ, 581, L5
- [283] Wu, X., & Liu, F. K. 2004, ApJ, 614, 91
- [284] Wu, X.-B., Wang, R., Kong, M. Z., Liu, F. K., & Han, J. L. 2004, AAp, 424, 793
- [285] Yip, C. W., et al. 2004, AJ, 128, 2603
- [286] Young, A.J., Crawford, C.S., Fabian, A.C., Brandt, W.N., O Brien, P.T., 1999, MNRAS, 304, 4
- [287] Yuan, M. J. & Wills, B. J. 2003, ApJL, 593, L11
- [288] Zamanov, R., Marziani, P., Sulentic, J. W., Calvani, M., Dultzin-Hacyan, D., & Bachev, R. 2002, ApJL, 576, L9
- [289] Zamanov, R. & Marziani, P. 2002, ApJL, 571, L77
- [290] Zheng, W., Kriss, G. A., Telfer, R. C., Grimes, J. P., & Davidsen, A. F. 1997, ApJ, 475, 469
- [291] Zhou, H., Wang, T., Dong, X., Zhou, Y., & Li, C. 2003, ApJ, 584, 147
- [292] Zhou, H., Wang, T., Dong, X., Li, C., & Zhang, X. 2004, ArXiv Astrophysics e-prints, astro-ph/0411252