Formation and Evolution of Planetary Systems: Upper Limits to the Gas Mass in Disks Around Sun-like Stars
Abstract
We have carried out a sensitive search for gas emission lines at infrared and millimeter wavelengths for a sample of 15 young sun–like stars selected from our dust disk survey with the Spitzer Space Telescope. We have used mid–infrared lines to trace the warm (300–100 K) gas in the inner disk and millimeter transitions of 12CO to probe the cold (20 K) outer disk. We report no gas line detections from our sample. Line flux upper limits are first converted to warm and cold gas mass limits using simple approximations allowing a direct comparison with values from the literature. We also present results from more sophisticated models following Gorti and Hollenbach (2004) which confirm and extend our simple analysis. These models show that the [S i] line at 25.23 µm can set constraining limits on the gas surface density at the disk inner radius and traces disk regions up to a few AU. We find that none of the 15 systems have more than 0.04 MJ of gas within a few AU from the disk inner radius for disk radii from 1 AU up to 40 AU. These gas mass upper limits even in the 8 systems younger than 30 Myr suggest that most of the gas is dispersed early. The gas mass upper limits in the 10–40 AU region, that is mainly traced by our CO data, are 2 M⊕. If these systems are analogs of the Solar System, either they have already formed Uranus– and Neptune–like planets or they will not form them beyond 100 Myr. Finally, the gas surface density upper limits at 1 AU are smaller than 0.01% of the minimum mass solar nebula for most of the sources. If terrestrial planets form frequently and their orbits are circularized by gas, then circularization occurs early.
1 Introduction
Circumstellar disks are a natural outcome of the star formation process (Shu et al., 1987). Initially massive and gas-dominated, they evolve into tenuous dusty disks possibly with embedded planets (e.g. Meyer et al. 2006). Studying the evolution of gas and dust in circumstellar disks is essential to understanding how planets form.
The properties of circumstellar dust have been extensively studied in young and old disks since the IRAS mission. The emerging evolutionary picture is of sub-micron interstellar grains that grow to larger sizes (up to km-size bodies) and settle to the disk midplane (e.g. Bouwman et al. 2001; Przygodda et al. 2003; Apai et al. 2005). In a later stage, collisions between forming planets and/or minor bodies such as asteroids or Kuiper Belt Objects can produce second-generation dust (or debris) in circumstellar disks (e.g. Rieke et al. 2005; Kim et al. 2005; Bryden et al. 2006). This evolution leads to tenuous dust disks where the emission from grains is optically thin to its own radiation. In contrast, less is known observationally about gas evolution in circumstellar disks.
The presence or absence of gas affects planet formation in profound ways. Gas masses between 1 and 10 times the dust masses in circumstellar disks control the dust dynamics and shape the disk structure (e.g. Takeuchi & Artymowicz 2001). The gas lifetime constrains the time for forming gas giant planets like Jupiter and Saturn. In addition, the ultimate size and distribution of giant planets may be affected by the disk gas mass. Even during the assembly of terrestrial planets, which concluded approximately 30 Myr after the origin of the Solar System (Jacobsen, 2005), a few Earth masses of gas in the terrestrial planet region could have influenced the eccentricity and final size of growing planets (Kominami & Ida, 2004).
Observations of gas have mainly targeted young accreting disks (few Myr old) and probed the cold outer regions (outside 30 AU) and the warm regions within 1 AU of such disks. Cold gas (20 K50 K) is traced in the millimeter by CO rotational lines that indirectly measure gas masses in young accreting disks with radii of few hundred AU (e.g. Dutrey & Guilloteau 2004). The only bona–fide debris disk detected in millimeter CO transitions is that around the A star 49 Cet (Zuckerman et al., 1995; Dent et al., 2005). Warm gas ( K) in the inner disk ( 1 AU) is probed in the near–infrared by CO vibrational transitions (e.g. Najita et al. 2003). These transitions may also trace gas in the terrestrial planet zone of evolved tenuous disks. In addition, H2 rovibrational lines have been detected in a few disks and found to trace the surface layer of the disks at distances of 10–30 AU from the star (e.g. Bary et al. 2003). Observations in the ultraviolet have successfully detected a number of gas lines towards pre-main sequence stars (e.g. Valenti et al. 2000, 2003). In particular fluorescent H2 emission has been found tracing both warm gas ( 2500 K) at or near the disk surface within 1 AU from the star (Herczeg et al., 2002) as well as surrounding molecular gas shocked in the interaction with stellar outflows (e.g. Walter et al. 2003). These UV diagnostics are not sensitive to the bulk of the much colder gas at larger radii. This cold gas can be traced with H2 absorption lines in the FUV but only in optically thin disks that are observed close to edge-on. Stringent upper limits to the line-of-sight H2 column density through the edge-on disks of Pic and AU Mic suggest that the primordial gas dispersed in less than 12 Myr in both systems (Lecavelier des Etangs et al., 2001; Roberge et al., 2005).
One region not adequately probed by most of the observations described above is the AU region ( K), corresponding to the giant planet forming region in the solar system. The Infrared Space Observatory (ISO) provided a first glimpse. Thi et al. (2001a) reported pure rotational H2 S(0) and S(1) line detections from a large number of pre-main sequence stars and also from three main-sequence stars with debris disks. These detections translated into large reservoirs of gas, suggesting a gas dispersal timescale longer than the accretion timescale. However, subsequent ground-based infrared spectroscopy (Richter et al., 2002; Sheret et al., 2003; Sako et al., 2005) and UV observations (Lecavelier des Etangs et al., 2001) cast doubt on whether the observed lines originated in disks.
As part of the Formation and Evolution of Planetary Systems (FEPS) Spitzer legacy program, we are carrying out a comprehensive survey of disks around Sun-like stars to characterize the gas dissipation timescale. In conjunction with this survey, Gorti & Hollenbach (2004, hereafter GH04) constructed detailed gas and dust models of optically thin dust disks in order to compare observational results with model spectra. In Hollenbach et al. 2005 (hereafter H05) we applied these models to FEPS observations of the disk around the 30 Myr star HD 105, and showed that less than 1 of gas exists in the planet–forming region (between 1–40 AU for a disk inner radius of 1 AU). In the following, we extend our analysis to 15 sun-like stars surrounded by optically thin dust disks, most of which have ages in the range 5–100 Myr. The target selection and observational strategy are presented in Sect. 2. From the non-detection of atomic and molecular gas lines, we place stringent upper limits on the gas mass in the planet–forming zone (Sect. 3 and 4). We discuss the implications on the gas evolution timescale and on the formation of gas giant and terrestrial planets in Sect. 5. Our findings are summarized in Sect. 6.
2 Observations and Data Reduction
In this Section we describe the target selection for our gas survey with Spitzer (Sect. 2.1) and the data reduction of the mid-infrared spectra (Sect. 2.2). In order to trace outer disk regions with gas colder than 50 K we complemented the Spitzer data of many sources with millimeter observations of 12CO lines (Sect. 2.3).
2.1 Target Selection and Observational Strategy
We selected objects from the FEPS dusty disk survey of 328 stars based on two observational criteria and several ancillary parameters. We chose the nearest objects with ages mostly between 5 and 100 Myr and those located in the lowest infrared backgrounds so that the observing time required to meet our goal would be minimized. Targets were chosen to span a range of infrared excess emission, X–ray luminosity, and spectral type (within the bounds of our program: 0.8–1.2 M⊙). We required that mid– to far–IR excess be detected in IRAS and ISO observations and extended the sample to excess sources discovered within FEPS. We also included additional young sources ( Myr) lacking infrared excess emission. Here we focus on a subset of these sources, whose dusty disks are thin at optical wavelengths. Results on the optically thick dust disks will be reported in a future contribution. The properties of the optically thin sample are summarized in Table 1. Ten out of fifteen sources have excess emission from circumstellar dust starting at wavelengths longer than µm. Among the five sources with no excess emission, ScoPMS 214, AO Men, and V343 Nor were included in the sample because of their young ages ( Myr). Our MIPS and low-resolution IRS observations do not confirm the excess emission reported in the literature towards the older two sources HD 134319 and HD 216803 (Spangler et al., 2001; Fajardo-Acosta et al., 1999). In the case of HD 134319, the ISO 60m flux was contaminated by a nearby source detected in our MIPS 24 and 70 m exposures.
Our Spitzer IRS observations were designed to be sensitive to less than 0.5 MJ in molecular hydrogen gas at a temperature of 100 K. Integration times were set to achieve a 5- detection against the noise. We used the IRS high-resolution modules providing R700 spectral resolution over 9.9-37.2 m. Note that the natural line–width of the gas is expected to be 10-100 times smaller than the 430 km/s resolution of the IRS high resolution spectra. The large wavelength coverage of the IRS on Spitzer enables us to probe various atomic and molecular lines in addition to the molecular hydrogen transitions. In fact, GH04 show that certain lines, such as [S i] at 25.23 µm and [S ii] at 34.8 µm, are expected in many instances to be significantly stronger than the H2 lines.
| # | Source | RA | DEC | SpT | Age | D | Log( | Log() | |
|---|---|---|---|---|---|---|---|---|---|
| [J2000] | [J2000] | [Myr] | [pc] | [K] | [L☉] | [erg/s] | |||
| 1 | ScoPMS 214a | 16:29:49 | -21:52:11.9 | K0(1) | 5b | 145 | 5318 | 0.26 | 30.72(11) |
| 2 | MML 17 | 12:22:33 | -53:33:49.0 | G0(2) | 17c | 124 | 6000 | 0.43 | 30.30(2) |
| 3 | MML 28 | 13:01:51 | -53:04:58.1 | K2(2) | 17c | 108 | 4997 | -0.35 | 30.00(2) |
| 4 | HD 37484 | 05:37:40 | -28:37:34.7 | F3(3) | 72 | 60 | 6727 | 0.55 | 29.07(12) |
| 5 | HD 202917 | 21:20:50 | -53:02:03.1 | G5(4) | 30d | 46 | 5553 | -0.18 | 29.49(13) |
| 6 | HD 134319a | 15:05:50 | +64:02:50.0 | G5(5) | 150 | 44 | 5716 | -0.14 | 29.23(11) |
| 7 | HD 12039 | 01:57:49 | -21:54:05.3 | G3/5(6) | 30d | 42 | 5688 | -0.05 | 29.10(13) |
| 8 | V343 Nora | 15:38:58 | -57:42:27.3 | K0(4) | 12e | 40 | 5103 | -0.03 | 30.73(11) |
| 9 | HD 377 | 00:08:26 | +06:37:00.5 | G2(7) | 88 | 40 | 5852 | 0.09 | 29.10(11) |
| 10 | AO Mena | 06:18:28 | -72:02:41.6 | K3(8) | 12e | 38 | 4359 | -0.59 | 30.16(14) |
| 11 | HD 209253 | 22:02:33 | -32:08:01.6 | F6/7(3) | 280 | 30 | 6217 | 0.21 | 29.70(15) |
| 12 | HD 35850 | 05:27:05 | -11:54:03.4 | F7/8(9) | 12e | 27 | 6138 | 0.25 | 30.60(13) |
| 13 | HD 25457 | 04:02:37 | -00:16:08.2 | F7(10) | 110 | 19 | 6319 | 0.32 | 29.74(16) |
| 14 | HD 17925 | 02:52:32 | -12:46:11.2 | K1(6) | 150 | 10 | 5173 | -0.43 | 28.97(17) |
| 15 | HD 216803a | 22:56:24 | -31:33:56.1 | K4(3) | 400 | 7.6 | 4531 | -0.71 | 28.34(17) |
| # | AOR Key | SH | LH |
|---|---|---|---|
| ScoPMS 214 | 9776897 | 121.96 | 60.958 |
| MML 17 | 13463296 | 121.96 | 60.956 |
| MML 28 | 13462016 | 121.96 | 60.957 |
| AO Men | 5458688 | 121.92 | 60.952 |
| HD 35850 | 9777920 | 31.466 | 14.6810 |
| V343 Nor | 5458944 | 121.92 | 60.952 |
| HD 12039 | 13461760 | 121.94 | 60.953 |
| HD 202917 | 9778176 | 31.465 | 14.688 |
| HD 25457 | 9779712 | 6.294 | 6.292 |
| HD 37484 | 9780224 | 31.4610 | 14.6810 |
| HD 377 | 13462272 | 121.93 | 60.953 |
| HD 17925 | 9780480 | 31.465 | 14.688 |
| HD 134319 | 9779968 | 31.466 | 14.6810 |
| HD 209253 | 9779200 | 31.467 | 14.684 |
| HD 216803 | 9777664 | 31.465 | 14.688 |
2.2 Data Reduction of the High-resolution IRS Spectra
Observations of our 15 targets were obtained between September 2004 and August 2005. After our validation observations of HD 105 in December 2003, in which we obtained only single on–source exposures, we switched to an on–source/off–source observing strategy to better subtract the background and improve source extraction. The objects have been all observed in the Fixed Cluster–Offsets mode with two nod positions on–source (located at 1/3 and 2/3 of the slit length) and two additional sky measurements acquired just after the on–source exposures. The IRS or PCRS Peak-up options were used to place and hold the targets in the spectrograph slit with positional uncertainties always better than 1′′ (1 sigma radial). We used the Short-High module (SH), covering the spectral range 9.9-19.6 µm, and the Long-High module (LH) covering the wavelength range between 18.7 and 37.2 µm. Both modules are cross–dispersed echelle spectrographs with spectral resolution of approximately 700. A summary of the observational log is given in Table 2. The plate scale of the detector is 2.3′′/pixel for the SH module and 4.5′′/pixel for the LH module. Emission at radii larger than 50 AU could be spatially resolved with the SH module for targets closer than 20 pc (see Table 1). However as we will show in Sect. 4.2, mid–infrared lines only trace warm gas located within few AU from the disk inner radius. Such emission is spatially unresolved for all targeted disks.
Raw high-resolution IRS data were processed with the Spitzer Science Center (SSC) pipeline S12.02. We start our data reduction from the droop products. Corrections applied in the SSC pipeline at this stage include: saturation flagging, dark subtraction, linearity correction, cosmic ray rejection and integration ramp fitting. Further data reduction is based on self-developed IDL routines in combination with the SMART reduction package developed by the IRS Instrument Team at Cornell (Higdon et al. 2004). The first step consists of creating background subtracted images from sky measurements acquired after the on–source exposures111Because we have the same RAMP and number of cycles for the source and the sky, we subtracted a sky exposure from each on–source exposure. Next we fix pixels marked bad in the ”bmask” files with flag value equal to or larger, thus including anomalous pixels due to cosmic-ray saturation early in the integration, or preflagged as unresponsive. The SSC provides additional hot pixel masks for individual campaigns/modules that include permanently as well as temporarily hot pixels. We correct for these hot pixels using the irsclean package provided by the SSC. The routines recognize if a pixel is marked in both the bmasks and the additional hot pixel masks and correct only once. Bad and hot pixels are cleaned by averaging spatial profiles in rows above and below the affected row and then normalizing the average profile to that of the affected row. The profiles are fitted to the good data in the affected row by minimizing the . These procedures have been extensively tested by the IRS GTO team and SSC222http://ssc.spitzer.caltech.edu/irs/roguepixels/. We use the background subtracted pixel–corrected images to extract 1D spectra with the full aperture extraction routine in SMART.
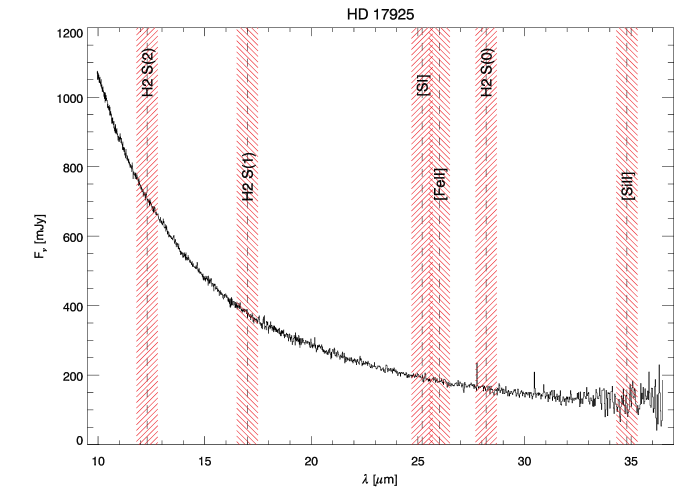
We applied the same procedure to our sources and to calibrators observed within the Spitzer IRS Calibration program (PI, L. Armus). We used all the calibrators processed with the S12.0.2 pipeline (2 observations of HD 166780, 3 of HD 173511 and 1 of Dra) to create two one-dimensional spectral response functions (one at each nod position) from the known stellar model atmosphere. The stellar models for the calibrators are available at the SSC web page333http://ssc.spitzer.caltech.edu/irs/calib/templ/ . The extracted spectra of each source are then divided by the spectral response function for each order and nod observation. The lower right corner of the chip is not well illuminated, resulting in a drop of signal at the end of each order. However, since the orders have a good overlap in wavelength, we simply trimmed the low-signal regions, retaining about 0.06 µm overlap in the SH module and 0.1 micron in the LH module. After trimming, spectra over all slit positions and cycles are averaged on an order basis. The uncertainties at each wavelength are estimated by the 1 sigma standard deviations of the distribution of the data points used to calculate the mean spectrum over all cycles and nod positions, and thus indicate the repeatability of our measurements. To these uncertainties we included the error on the derived spectral response function by taking the standard deviation of the calibrator spectra divided by the stellar atmospheres. The error quoted at overlapping wavelengths is the error propagation of the mean value. An example of a reduced spectrum is shown in Fig. 1. All reduced spectra are available in the on-line article. We report no detection of gas lines in any of these IRS spectra. We find that a few anomalous pixels remain in the reduced spectra that were not flagged in the bmasks nor in the hot pixel masks. These pixels are typically located at the beginning and/or at the end of a spectral order and not at the location of the expected gas lines (see for example the pixel at 27.78 µm in Fig. 2).
2.3 Millimeter CO Observations and Data Reduction
Observations of 12CO in J=2-1 (230.538 GHz) and J=3-2 (345.796 GHz) were obtained with the 10-m Submillimeter Telescope (SMT) during two campaigns, December-February 2003-2004 and December-January 2005-2006. The full-width-half-maximum (FWHM) beam size of the SMT observations is 33′′ and 22′′ for the J=2-1 and J=3-2 transitions respectively. The data were recorded using the CHIRP digital spectrometer (bandwidth of 215 MHz and resolution of 40 kHz) and reduced using CLASS in the GILDAS444http://www.iram.fr/IRAMFR/GILDAS data reduction package. During data reduction, the spectra were smoothed to a velocity resolution of 0.2 km s-1, about ten times smaller than the expected width of the line. A linear baseline was then removed from each spectrum, and all the spectra for a given source were coadded by weighting each spectra by rms-2. We calibrated our temperatures by measuring the ratio of observed and expected emission lines from planets (the latter was computed with the ASTRO software within GILDAS). These ratios, also known as beam efficiencies, had mean values of 0.77 and 0.50 for the J=2-1 and J=3-2 during the first campaign and 0.74 and 0.55 for the J=2-1 and J=3-2 during the second campaign. Repeated observations of spectral line calibrator sources during each campaign indicate the dispersion in the calibration is 19%, and 28% for J=2-1 and J=3-2 respectively. This dispersion was not included in the estimates of the line flux upper limits in Sect. 3.2. For two FEPS sources (HD 37484 and ScoPMS 214), the heliocentric velocity was unknown at the time of the observations, and the spectrometer was centered on 0.0 km/s. The velocities were later determined from high resolution optical spectra (White et al., 2006), and in all three instances, the velocities were well within the spectrometer bandwidth (100 km/s). We did not detect any CO emission line from any of our sources. The 1-sigma upper limits per channel are provided in Table 3. Values are given in the main beam scale, i.e. the antenna temperatures have been divided by the main beam efficiencies of the telescope at the specific frequencies.
| Source | [K] | ||
|---|---|---|---|
| [km/s] | CO(2-1) | CO(3-2) | |
| ScoPMS 214 | -7.6 | 0.033I | 0.18 |
| HD 35850 | 20.2 | 0.043 | 0.083I |
| HD 12039 | 3.1 | 0.049 | 0.078 |
| HD 25457 | 17.6 | 0.028I | 0.044 |
| HD 37484 | 23.7 | 0.038I | – |
| HD 377 | -4 | 0.043 | 0.13I |
| HD 17925 | 17.7 | 0.042I | 0.056 |
| HD 134319 | -6.8 | 0.06b | 0.068I |
| HD 209253 | 8.0 | – | 0.095I |
3 Simple Estimates of Gas Mass Upper Limits
We have not detected any lines associated with the gas in our IRS spectra, nor in our millimeter data. Line flux upper limits can be compared to model predictions of line strength and provide stringent constraints on the amount of gas in the planet–forming region. We pursue rigorous theoretical comparisons in Sect. 4.2. Here for comparison to previous studies, we estimate gas mass upper limits in the approximation of optically thin emission at assumed fixed temperatures. Upper limits to the warm and cold gas are derived from the H2 (Sect. 3.1) and CO non-detections respectively (Sect. 3.2). In addition, we calculate the upper limit on the radius of a putative gas disk under the assumption that the CO emission is optically thick in the inner regions (Sect. 3.2). This radius will be later compared to that derived from our detailed modeling of gas disks which satisfy the observed infrared line flux limits.
3.1 Warm Gas Limits from H2 Observations
To estimate line flux upper limits from the mid–infrared observations, we first extract a 0.5 µm region around the expected feature. Then we fit a baseline using a first order polynomial. Five sigma upper limits to the line flux are derived by taking the local RMS dispersion of the pixels in the baseline subtracted spectrum over two pixels per resolution element, assuming the noise is uncorrelated. Note that because we calibrate our spectra from the average spectral response function of various standard stars, our upper limits partly include the error in the absolute flux calibration. We have tested that the line flux upper limits are not very sensitive to the width of the region where we fit the baseline. Choosing a region around the line that is 0.5 µm smaller or larger than the 1 µm width we adopt changes the upper limits on average by only 6%555These tests have been made on the three lines that are the most informative when compared to the gas models: the H2 S(1) at 17.04 µm, the [S i] at 25.23 m, and the [Fe ii] at 26.00 m. Our approach provides conservative upper limits. The use of a higher order polynomial to fit the continuum and/or the inclusion of the errors at each wavelength would lower the computed RMS and thus the line flux upper limits. Our RMS values are on average 20% higher than the error at the wavelengths of the expected lines. Table 4 summarizes the line flux upper limits for many of the transitions observed in the IRS modules: H2 S(2) at 12.28 m, H2 S(1) at 17.04 m, H2 S(0) at 28.22 m, [S i] at 25.23 m, [Fe ii] at 26.00 m, and [Si ii] at 34.80 m. We show examples of hypothetical 5 lines in Fig. 2.
| Source | Log[Line flux (W/cm2)] | |||||
|---|---|---|---|---|---|---|
| H2S(2) | H2S(1) | H2S(0) | [S i] | [Fe ii] | [Si ii] | |
| ScoPMS 214 | -21.73 | -21.89 | -21.41 | -21.57 | -21.57 | -20.99 |
| MML 17 | -21.86 | -21.99 | -21.56 | -21.46 | -21.62 | -20.95 |
| MML 28 | -21.95 | -22.02 | -21.51 | -21.60 | -20.27 | -20.81 |
| HD 37484 | -21.13 | -21.28 | -21.20 | -21.18 | -21.36 | -20.76 |
| HD 202917 | -21.10 | -21.11 | -21.15 | -21.11 | -21.34 | -20.73 |
| HD 134319 | -21.18 | -21.27 | -21.17 | -21.15 | -21.28 | -20.73 |
| HD 12039 | -21.60 | -21.74 | -21.29 | -21.01 | -21.42 | -20.78 |
| V343 Nor | -21.29 | -21.52 | -21.00 | -21.18 | -21.38 | -20.60 |
| HD 377 | -21.45 | -21.66 | -21.33 | -20.95 | -21.12 | -20.53 |
| AO Men | -21.60 | -21.74 | -21.25 | -21.19 | -21.17 | -20.87 |
| HD 209253 | -20.82 | -20.86 | -21.07 | -20.98 | -21.21 | -20.51 |
| HD 35850 | -20.94 | -21.07 | -21.07 | -20.97 | -21.18 | -20.75 |
| HD 25457 | -20.49 | -20.57 | -20.42 | -20.66 | -20.77 | -20.11 |
| HD 17925 | -20.80 | -21.01 | -20.89 | -21.24 | -21.24 | -20.64 |
| HD 216803 | -20.80 | -20.98 | -21.06 | -20.93 | -21.14 | -20.68 |

We convert H2 line flux upper limits into upper limits on the H2 mass (see e.g. Thi et al. 2001b for the equations) assuming that the gas is in local thermal equilibrium, that the H2 lines are optically thin, and that the gas temperature is 100, 150 or 200 K. Temperatures of 100 K correspond to the gas from which our own Jupiter and Saturn are thought to have formed (e.g. Gautier et al. 2001). Expanding the temperature range to 200 K allows us to make a direct comparison with published gas masses and upper limits for circumstellar disks (e.g. Thi et al. 2001b; Sako et al. 2005; Chen 2005; H05; Chen et al. 2006) and illustrate how gas masses depend on the assumed gas temperature. The H2 S(2) line does not set stringent limits for temperatures lower than 300 K, the H2 S(1) transition is the most sensitive line at 150 and 200 K, while the H2 S(0) and the H2 S(1) transitions provide similar values for gas at 100 K. In Table 5 we report the lowest gas mass upper limits for temperatures of 100, 150, and 200 K and indicate whether they are derived from the H2 S(0) or the H2 S(1) transitions for gas at 100 K. This simple approach shows that gas masses are very sensitive to the assumed gas temperature: if the emitting gas is as cold as 100 K it takes about hundred times more mass to produce the measured line flux upper limits than if gas is at 200 K. Hence, it is very important to utilize detailed disk thermal models which describe the gas density and temperature distribution and which predict line fluxes from disks of a given mass for comparision with the observed upper limits on line fluxes.
| Source | H2 mass [] | Most sensitive linea |
|---|---|---|
| for 100–150–200 K gas | for 100 K gas | |
| ScoPMS 214 | 200–6.6–1.3 | H2 S(1) |
| MML 17 | 115–3.8–0.8 | H2 S(1) |
| MML 28 | 82–2.7–0.6 | H2 S(1) |
| HD 37484 | 64–4.6–0.9 | H2 S(0) |
| HD 202917 | 42–4.0–0.8 | H2 S(0) |
| HD 134319 | 37–2.5–0.5 | H2 S(0) |
| HD 12039 | 24–0.8–0.2 | H2 S(1) |
| V343 Nor | 36–1.2–0.2 | H2 S(1) |
| HD 377 | 21–0.9–0.2 | H2 S(0) |
| AO Men | 19–0.6–0.1 | H2 S(1) |
| HD 209253 | 22–3.1–0.6 | H2 S(0) |
| HD 35850 | 17–1.5–0.3 | H2 S(0) |
| HD 25457 | 39–2.4–0.5 | H2 S(1) |
| HD 17925 | 4–0.2–0.05 | H2 S(0) |
| HD 216803 | 1–0.1–0.03 | H2 S(0) |
| aafootnotetext: For gas temperatures of 150 and 200 K the H2 S(1) line is always more sensitive than the H2 S(0) and the H2 S(2) lines. |
Our measurements for optically thin disks are more sensitive than the ISO observations by Thi et al. (2001b) by at least a factor of 4 for sources at similar distance. The line detections claimed by Thi et al. suggested that relatively large amounts (6.7-0.2 ) of gas can persist into the debris–disk phase. Our gas mass upper limits show that even the six youngest disks in our sample (5-20 Myr) have less than 0.6 Jupiter masses of 100 K gas (or less than 0.005 Jupiter masses of 200 K gas). Our results are in agreement with the recent findings by Chen (2005) who reports masses of 100 K gas smaller than 15 (or 0.05 ) in the disks of Pictoris (12 Myr, Zuckerman et al. 2001) and 49 Ceti (10 Myr, Zuckerman et al. 1995). These low gas masses argue for short gas dispersal timescales.
Gas masses in Table 5 are provided mainly for comparison to previous studies. More detailed modeling of the dust and gas components is necessary to understand the mechanisms relevant to the gas heating, to determine gas temperatures, and thus infer total gas masses from our non-detections. This procedure has been fully explored in H05 for HD 105, one of the first sources in the FEPS gas program, and is extended to our larger sample in Sect. 4.
3.2 Cold Gas Limits from CO Observations
For the millimeter observations, we convert the 1-sigma noise into line flux upper limits as follows:
| (1) |
where is the Boltzmann constant, are our 1-sigma upper limits per channel as reported in Table 3, is the beam in radians at the transition , is the frequency resolution ( = 0.2 km/s), and is the number of channels on which the line is distributed. Assuming a line width of 5 km/s, which is the Keplerian velocity for gas at 30AU around a solar mass star, we have 25 channels for the SMT resolution of 0.2 km/s. The 5-sigma line flux upper limits are summarized in Table 6 and will be used here to provide an upper limit either to the CO mass in disks optically thin to the CO transitions or to the size of an optically thick CO disk. We will use our gas models to fully characterize the CO emission in Sect. 4.2.
Assuming that CO is optically thin throughout the disk, we can convert our line flux upper limits into CO mass upper limits. We use the formulation of Scoville et al. (1986) with appropriate changes to take into account different CO transitions and adopt an excitation temperature of 20 K. We note that the CO mass is not very sensitive to the gas temperature and changes only by 20% if we assumed an excitation temperature of 40 K. Five-sigma upper limits to the CO mass are summarized in Table 6. Our limiting values are typically a factor of 10 higher than those reported by Najita & Williams (2005) for the disks around HD 104860 and HD 107146, due to a combination of shorter integration times and the assumption of larger line widths. Still these upper limits convert to less than a few of total gas mass for many sources assuming the interstellar H2/CO number ratio of 104. However, there are at least two important issues that need to be considered: the possible condensation of CO onto grains and the photodissociation of CO molecules. Both these processes reduce the CO gas phase abundance relative to H and thereby raise the upper limit on the total mass. Condensation of CO occurs for grain temperatures 50 K depending on the substrate onto which CO is adsorbed (see e.g. Najita & Williams 2005 for a discussion). The lack of submillimeter continuum data for our sample does not allow us to constrain the temperature of the cold grains, and thereby to estimate the effect of CO condensation. However, we will show in Sect. 4 that photodissociation is a severe problem for tenuous gas disks such as those we have observed. If CO is optically thin but much of the gas phase carbon is found in C+ or C, then the CO gas we detect would be representative of only a small fraction of the total gas mass, and the total gas mass associated with the optically thin CO could be few . In addition, the optically thin limits on CO mass tell us nothing about the CO mass located in the optically thick inner regions.
Assuming the existence of such an optically thick inner disk (which is indeed present in young accreting disks, Dutrey et al. 2004), we can set limits to the disk size by our CO flux upper limits. For simplicity we describe the CO emission as that from a blackbody times the solid angle subtended by a face–on disk666Because we do not have information on the disk inclinations, we assume face–on configurations here and in the following gas models. For optically thick lines the observed flux is proportional to the projected area of the disk. Thus, fluxes from optically thick lines can be corrected by multiplication with the cosine of the disk inclination. and compare this emission to our 5–sigma line flux upper limits. Table 6 summarizes the inferred upper limits on optically thick disk radii for a black body temperature of 20 K. Disk radii are more sensitive to the assumed blackbody temperature than disk masses: a blackbody temperature of 40 K results in 35% smaller radii than those reported in Table 6. It is important to characterize the region inside which optically thick CO gas could exist because inside that region, gas masses could be high and still be undetected in CO. It is in these regions that the infrared upper limits may constrain the mass or surface density. In Section 4 we will compare these radii, calculated for constant T, with those inferred by detailed gas models which compute the radial and vertical dependence of T and the detailed radiative transfer operating for the CO transitions as well as for the infrared transitions.
| Source | Log(Line flux) | |||||
| [W/cm2] | [M⊕] | [AU] | ||||
| CO(2-1) | CO(3-2) | CO(2-1) | CO(3-2) | CO(2-1) | CO(3-2) | |
| ScoPMS 214 | -23.43 | -22.51 | 236 | 403 | ||
| HD 37484 | -23.37 | – | – | 105 | – | |
| HD 134319 | -23.17 | -22.93 | 97 | 75 | ||
| HD 12039 | -23.26 | -22.87 | 83 | 77 | ||
| HD 377 | -23.32 | -22.65 | 74 | 94 | ||
| HD 209253 | – | -22.79 | – | – | 61 | |
| HD 35850 | -23.32 | -22.85 | 50 | 51 | ||
| HD 25457 | -23.50 | -23.12 | 28 | 26 | ||
| HD 17925 | -23.33 | -23.02 | 18 | 15 | ||
4 Constraining the Gas Mass in the Planet–forming Zone
Even though H2 is the dominant constituent of the gas, H2 lines are not always the strongest transitions from circumstellar disks. Depending on the density, temperature and chemical structure (which in turn depends on the radiation field and disk surface density distribution), other infrared atomic and molecular lines can have higher luminosities (GH04). In this section, we make use of the line flux upper limits derived from the mid-infrared and mm CO transitions to derive constraining upper limits for the gas mass in the planet–forming zone.
Hollenbach et al. (2005) have shown that the dust disk of HD 105 is so tenuous that the dust does not affect the gas temperature or gas disk structure. In Sect. 4.1 we demonstrate that our systems also have too low dust surface density for gas-grain collisions to heat or cool the gas. Gas heating in these tenuous disks is dominated by X-rays and UV radiation from the central star, and therefore we can ignore the dust component in modeling the gas emission (Sect. 4.2). This is completely opposite to the case for young optically thick disks, where the gas temperature in much of the disk is coupled to the dust temperature by collisions, and where the surface gas is heated by the grain photoelectric heating mechanism (e.g. Jonkheid et al. 2004).
4.1 Gas–dust Collisions versus X–ray Heating
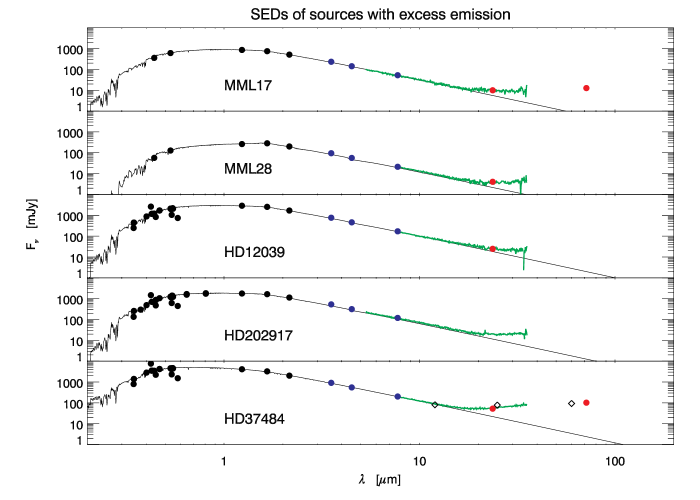
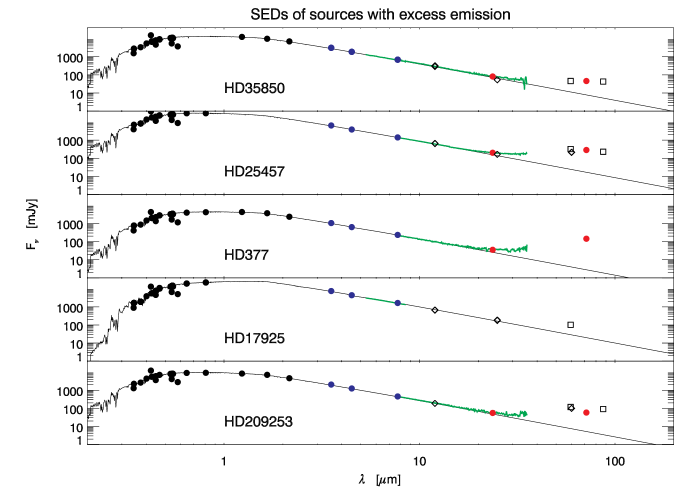
To understand whether dust may be an important heating mechanism for the gas, we need to evaluate the dust surface density of our disks. The observed infrared continuum excess from a disk gives an upper limit to the dust surface density for a chosen grain size. Ten of our gas sources have infrared excess emission at wavelengths longer than 20 µm with spectral energy distributions (SEDs) characteristic of optically thin dust disks (see Fig. 3 and 4). We use HD 37484 and its disk as our demonstrative case because the system has the largest warm excess emission and the star has a low X-ray luminosity, thus representing the case with the largest dust surface density and the lowest X-ray heating of the gas. We assume that the disk has a dust surface density proportional to (e.g. the Vega best fit model to its debris disk by Su et al. 2005). We estimate in three steps the maximum dust surface density at the disk inner radius that is consistent with the infrared observations: i) we calculate the dust temperature using the analytical solution of the radiative transfer equation for optically thin disks (e.g. Pascucci et al. 2004, eq. 5); ii) we determine the excess emission by subtracting the best-fit Kurucz model atmosphere from the observed data; iii) we write the dust re-emission in terms of the dust surface density at the inner radius (e.g. Wyatt et al. 1999 eq. 3) and require that the re-emission does not exceed the observed excess at any wavelength. The maximum dust surface density for inner radii from 1 to 19 AU is shown in Fig. 5 for a disk with small (0.2 µm) and large (2 µm) grains. The dust surface density for small grains is lower than that for large grains at all disk radii. This is because smaller grains are warmer than larger ones at the same distance from the star and because, for the same dust surface density, smaller grains have more total surface area than larger grains.
On the other hand, a lower limit to the dust surface density is obtained if the dust is to dominate the heating by X rays. Heating from gas-dust collisions is proportional to the product of the densities of dust and gas while X-ray heating is only proportional to the density of gas. By equating the contribution from gas–dust collisional heating and X-ray heating (see GH05 for the analytic forms of these heating processes), we obtain a minimum dust density for dust-gas collisions to contribute as much as X-ray heating. We compare the two heating mechanisms at the midplane of the disk where the number density is highest at any given radius, and hence where collisional heating is maximum. This is also the region where X-ray heating is at its lowest, since the attenuation is highest. To convert the number density to surface density we use the mass of spherical Draine & Lee silicate grains and a disk scale height of 0.1 times the radial distance, which is a good approximation for the inner regions of flared disks (e.g. Chiang & Goldreich 1997). The resulting minimum dust surface densities for different inner disk radii and for two grain sizes are summarized in Fig. 5. These values are obtained for a gas temperature of 70 K. Note that the general trend will not change if a different gas temperature is assumed, but for gas hotter than the dust at any radius gas-dust collisions will result in cooling rather than heating the gas. However, the magnitude of the collisional cooling is similar to the magnitude of the collisional heating, the energy transfer being proportional to ().
The comparison of the two surface densities proves that our dust disks are too tenuous for dust to appreciably affect gas heating or cooling. This simple approach shows that at least two orders of magnitude higher dust surface densities are necessary for dust-gas collisions to equal X-ray heating. Because the other gas sources have lower excess emission than HD 37484 and/or higher X-ray luminosities, this result extends to the entire sample. We also point out that grain photoelectric heating is completely negligible for optically thin dust disks where most of the dust grains have grown to sizes larger than the very small ( µm) interstellar grains which dominate grain photoelectric heating (see the case of HD 105 by H05 and Fig. 3 by GH04). We therefore proceed to model the gas temperature and density structure of disks ignoring their dust properties.

| FEPS sources | UV templates | ||||
| Source | Log() | Source | SpT | Criteria | Ref. |
| ScoPMS 214 | -2.2 | ScoPMS 52a | K0IV | age, colors | 1 |
| MML 17 | -2.4 | HD 146516a | G0IV | age, colors | 1 |
| MML 28 | -2.6 | ScoPMS 52a | K0IV | age, colors | 1 |
| HD 37484 | -2.4 | HD 28568 | F2V | X-ray | 2 |
| HD 202917 | -2.6 | HD 43162 | G5V | X-ray | 2 |
| HD 134319 | -3.2 | HD 134319 | 3 | ||
| HD 12039 | -2.8 | HD 43162 | G5V | X-ray | 2 |
| V343 Nor | -3.3 | V343 Nor | 3 | ||
| HD 377 | -3.7 | EK Dra | G1.5V | age, X-ray | 4 |
| AO Men | -2.5 | RE J0137+18A | K3V | age, colors | 3 |
| HD 209253 | -2.8 | HD 33262 | F7V | X-ray | 2 |
| HD 35850 | -2.8 | HD 35850 | 3 | ||
| HD 25457 | -3.1 | HD 28033 | F8V | X-ray | 2 |
| HD 17925 | -3.5 | HD 17925 | 3 | ||
| HD 216803 | -2.2 | HD 216803 | 3 | ||
| aafootnotetext: These two template stars belong to the Upper Scorpius association (d=145 pc) and have large visual extinctions as estimated from fitting their photometric data with Kurucz stellar atmospheres (=1.5 for ScoPMS 52 and =0.8 for HD 146516). Their IUE spectra have been deredden using the reddening law by Mathis (1990) before scaling them to the Kurucz model atmospheres of our targets. All other template stars have distances less than 65 pc and thus negligible extinction: their IUE spectra scaled to the source distances and radii were found to match well the source Kurucz model atmospheres at wavelengths longward of 3200 Å. | |||||
4.2 Gas Models for Optically Thin Disks
The simple approximations adopted in Sections 3.1 and 3.2 allowed us to obtain initial estimates of gas mass upper limits and compare them to values published in the literature. The upper limits were shown to depend strongly on the assumed gas temperature. We can improve on these estimates by applying comprehensive gas models to calculate the gas disk temperature and thus infer total gas mass upper limits for the targeted disks. We use the models of GH04 that include the chemistry and thermal balance in a self–consistent manner and calculate the vertical density structure and the temperature in the radial and vertical directions. These models include heating and cooling from gas–dust collisions, stellar and interstellar UV radiation, stellar X–rays, collisional deexcitation of vibrationally excited H2 molecules, grain photoelectric heating, exothermic chemical processes, and cosmic rays. Condensation of molecules onto grains is not implemented for two main reasons. First, infrared lines originate from regions where dust is too hot (100 K) for condensation to occur appreciably. Second, the code is steady state but would require time dependent solutions to properly treat the condensation of molecules. Gas–phase species are assumed to have interstellar abundances (Savage & Sembach 1996 and Appendix A in GH04). We demonstrated in Section 4.1 that gas-dust collisions and grain photoelectric heating are insignificant heating and cooling mechanisms in tenuous dust disks and therefore we removed the dust component in the models that follow.
FIDUCIAL DISK MODEL. We first consider a fiducial face–on gas disk extending from 1 to 100 AU with a surface density dependence of , as indicated from observations of young disks (e.g. Dutrey et al. 1996). The main input parameters to the gas models are the stellar properties reported in Table 1 and stellar FUV fluxes (UV fluxes between 6 eV 13.6 eV). Our first modeling of the disk around HD 105 showed that stellar X ray and UV photons dominate the gas heating in tenuous dust disks (the UV heats not by the grain photoelectric heating mechanism but by pumping H2 and by photodissociating and photoionizing molecules and atoms, H05). Because stellar X-ray and UV fluxes depend on the stellar activity, we tried to collect measurements for each source. X-ray data are available for all targets (see Table 1) while only 5 of our sources have been observed in the UV by the International Ultraviolet Explorer (IUE). For these sources we merged the IUE data with the Kurucz model atmospheres777The Kurucz model atmospheres for the stellar parameters in Table 1 match in all cases the long wavelength IUE data (from 3000 Å). We used the IUE data for wavelengths 3000 Å and the Kurucz model atmospheres for longer wavelengths. and estimated the flux in 8 energy bins (from 0.7 to 13.6 eV) that are relevant for the photodissociation and photoionization of dominant atomic and molecular species like S, Fe, Mg, Si, CO and H2. Where we lack UV data for our targets, we searched for stars with similar spectral type, age, and colors in the IUE archive and used them as templates for the FUV flux. For sources where ages are not well-determined we used the spectral type and X–ray luminosity as the main criteria for assigning templates. We estimated the H I Ly-alpha flux from the X-ray flux, based on the empirical relationship by Wood et al. (2005). Since Ly-alpha emission contributes most of the FUV emission from late-type stars, we use it as a proxy for the total FUV emission and scale the templates accordingly, yielding order-of-magnitude estimates for the stellar UV field. A summary of UV templates and luminosities is given in Table 7. In Sect. 4.3 we will discuss the dependence of our results on the input parameters that are most uncertain: the disk inner radius, the surface density slope, and the stellar UV luminosity.
METHOD. We calculate the line fluxes from gas models with the total disk mass as our main variable parameter. For each transition reported in Tables 4 and 6, we find a disk mass where the calculated line flux from the models matches the observed flux limit. We determine the radius, , from within which 90% of the emission originates for each transition and also define a disk mass associated with this region , which includes mass from the inner radius to . We also calculate the radius within which the CO emission is optically thick. This region corresponds to a vertical column density of CO molecules of cm-2 (this value is similar for the two CO lines and corresponds to line optical depths larger than 1). Our modeling results are summarized in Tables 8 and 9.
RESULTS FROM THE MID–INFRARED LINES. We find that the [S i] transition at 25.23 µm sets the most stringent upper limits on the gas mass in comparison to the limits set by the other mid–infrared lines. We explored the sensitivity of our results to the S abundance in the gas phase using the disk of HD 35850 as a test case. Observations from comet Halley dust suggest that about half of the S could be in FeS grains (e.g. Pollack et al. 1994). Some S could be removed from the gas phase component of circumstellar disks in this way, as recently proposed by Keller et al. (2002). However, current observations cannot quantify the amount of S into grains. To investigate a pessimistic case we reduced the S abundance in gas phase by 90%. This reduction results in a 5 times larger gas mass upper limit. This is because for such a low mass disk the [S i] line is nearly optically thin (optical depths of 2–3), so that the [S i] flux drops nearly proportional to the gas mass. Note that even if [S i] upper limits would be increased by a factor of 5, they would still be more stringent that those inferred from H2 lines for most of the sources (see below).
Our gas models predict also relatively strong [Si ii] lines at 34.8 µm, however the IRS spectra become noisier at longer wavelengths and our line flux upper limits are not as low. These results are in agreement with what we found for the disk around HD 105 (H05). The [Fe ii] line at 26 µm is the second most sensitive transition and can set useful gas mass upper limits for two-thirds of the sample (in other words, in one-third of the sample, our models did not produce detectable [Fe ii] no matter how much gas mass was contained within the disk). The H2 S(1) line at 17 µm provides the most stringent upper limits when compared to the other two H2 lines; nevertheless gas masses can be constrained only for one-third of the sample with this diagnostic. This is because the transition probabilities of the H2 lines are orders of magnitudes smaller than those of the [S i] and [Fe ii] transitions while their excitation temperatures are quite similar. The H2 surface density upper limits are typically a factor of 10 higher than the surface densities set by [S i], while the [Fe ii] transitions provide values similar to those from [S i] for many sources.
For an inner disk radius of 1 AU, the models indicate that the emitting region for the mid–infrared transitions is typically a few AU and extends up to 5 AU in a few of our fiducial disks, suggesting that we are tracing a region analogous to that between Earth and Jupiter in our Solar System. We note that the gas mass upper limits inferred from modeling the [S i] lines are less than 0.4 in the 1-5 AU region for all sources and are as low as a tenth of an Earth mass for two–thirds of the sample.
Comparing gas masses from the models to the simple LTE approximation (Sect. 3.1) requires knowing the characteristic temperature of the emitting gas. For the 5 sources where we could set limits from the H2 S(1) line, we computed mean temperatures as follows:
where the sum is carried out over the spatial grid and the flux is the H2 S(1) flux. We obtain mean temperatures between 230 K (for HD 35850) and 160 K (for HD 216803). This temperature range reflects the different source heating; K-type stars like HD 17925 should have even lower close to 100 K. Limits on the mass of the emitting gas from modeling the [S i] line ( in Table 8) are typically a factor of 50 and of 10 lower than the warm gas limits calculated in Sect. 3.1 for gas temperatures of 150 K and 200 K respectively. The difference results from the use of [S i] as the tracer and the temperature structure in real disks. The limits on the total gas mass in a disk depends on the power law of the gas surface density and on the outer disk radius. For our fiducial disk model (, 100 AU) upper limits to the total gas mass range from 10 (for ScoPMS 214) to 0.5 (for HD 17925), with higher limits typically for the more distant sources, which are also the younger (see last column of Table 8).

RESULTS FROM THE MILLIMETER CO LINES. While mid-infrared line luminosities trace the inner few AU of circumstellar disks, millimeter CO transitions are sensitive to colder gas located in the outer disks. CO is mainly heated by stellar X-ray and UV emission, but at large disk radii (20 AU for a star with ) the interstellar UV field can dominate the local stellar UV. Fig. 6 shows the line luminosity per logarithmic radial annulus produced in a disk as a function of . Mid-infrared line luminosities increase steeply at the disk inner radius, peak in the inner few AU, and rapidly fall as the temperature decreases. In contrast, CO line luminosities gradually increase with radius, peak at larger disk radii, and decline as CO begins to photodissociate. CO emission is so widespread that radii as large as 20 AU and up to 60 AU (see of Table 9) are required to encompass 90% of the CO luminosity. This emission is mostly optically thick, suggesting that as a first approximation CO is mainly tracing the radius inside of which the CO is optically thick rather than the total disk mass. The disk radii estimated with the simple assumption of optically thick CO emission and 20 K temperature are typically a factor of 2 higher (and can be up to a factor of 4 higher, e.g. HD 12039) than the from the models. This suggests that gas temperatures as high as 50 K are more representative of the region where CO is optically thick (see also the discussion in Sect. 3.2). In the case of HD 17925 the low observed flux limits only allow a very tenuous gas disk. The low column density of the disk results in photodissociation of CO by the interstellar UV field (the average H2/CO number ratio is 105, an order of magnitude higher than the interstellar value) and CO emission from this disk is optically thin at all radii.
| Source | (g/cm2) | (AU) | () | |||||||
|---|---|---|---|---|---|---|---|---|---|---|
| H2 | [Fe ii] | [S i] | H2 | [Fe ii] | [S i] | H2 | [Fe ii] | [S i] | () | |
| ScoPMS 214 | … | … | 0.41 | … | … | 3.4 | … | … | 0.23 | 9.6 |
| MML 17 | … | … | 0.29 | … | … | 2.9 | … | … | 0.13 | 6.8 |
| MML 28 | … | … | 0.13 | … | … | 2.4 | … | … | 0.04 | 3.0 |
| HD 37484 | … | 0.68 | 0.13 | … | 2.3 | 1.6 | … | 0.21 | 0.02 | 3.0 |
| HD 202917 | … | 0.48 | 0.26 | … | 2.0 | 2.9 | … | 0.11 | 0.12 | 6.1 |
| HD 134319 | … | … | 0.13 | … | … | 1.7 | … | … | 0.02 | 3.0 |
| HD 12039 | 0.7 | 0.12 | 0.25 | 2.8 | 3.4 | 2.6 | 0.3 | 0.07 | 0.09 | 5.8 |
| V343 Nor | … | 0.05 | 0.09 | … | 4.6 | 5.1 | … | 0.04 | 0.09 | 2.1 |
| HD 377 | 1.3 | … | 0.12 | 1.4 | … | 1.6 | 0.1 | … | 0.02 | 2.8 |
| AO Men | 0.9 | 0.13 | 0.09 | 4.2 | 2.7 | 3.3 | 0.7 | 0.05 | 0.05 | 2.1 |
| HD 209253 | … | 0.29 | 0.06 | … | 1.8 | 2.5 | … | 0.06 | 0.02 | 1.4 |
| HD 35850 | 1.2 | 0.04 | 0.11 | 2.5 | 4.2 | 5.5 | 0.4 | 0.03 | 0.12 | 2.6 |
| HD 25457 | … | 0.41 | 0.07 | … | 1.7 | 2.9 | … | 0.07 | 0.03 | 1.6 |
| HD 17925 | … | 0.36 | 0.02 | … | 1.4 | 1.8 | … | 0.03 | 0.004 | 0.5 |
| HD 216803 | 0.3 | 0.07 | 0.08 | 2.5 | 1.5 | 1.9 | 0.1 | 0.008 | 0.02 | 1.9 |
| Source | (AU) | () | (AU) | () | |||
|---|---|---|---|---|---|---|---|
| CO(2-1) | CO(3-2) | CO(2-1) | CO(3-2) | CO(2-1) | CO(3-2) | CO(3-2) | |
| ScoPMS 214 | … | … | … | … | 17 | ||
| HD 37484 | 49.8 | – | 3.5 | – | 50.1(90%) | – | 7.0 |
| HD 134319 | 50.4 | 61.3 | 1.6 | 1.6 | 43.5(87%) | 43.5(83%) | 2.7 |
| HD 12039 | 30.4 | 31.9 | 1.0 | 0.9 | 20.5(62%) | 19.6(56%) | 2.8 |
| HD 377 | 36.4 | 53.8 | 1.2 | 2.3 | 33.0(86%) | 44.5(84%) | 4.4 |
| HD 209253 | – | 31.1 | – | 0.7 | – | 28.2(85%) | 2.6 |
| HD 35850 | 23.0 | 21.9 | 0.7 | 0.6 | 20.9(87%) | 13.4(50%) | 2.7 |
| HD 25457 | 28.4 | 26.4 | 0.5 | 0.4 | 28.2(91%) | 28.2(95%) | 1.5 |
| HD 17925 | 21.1 | 20.1 | 0.07 | 0.05 | 0(0%) | 0(0%) | 0.3 |
.
4.3 Dependence of the Results on Uncertain Input Parameters
In this section we test the dependence of our results on the slope of the gas surface density, on the stellar UV field, and on the disk inner radius, that are the main input parameters to our gas models lacking independent observational constraints.
First, we consider different slopes of the gas surface density power-law, , and use the disk around HD 35850 as the demonstrative case. In addition to our fiducial disk model with , we summarize in Fig. 7 results for a flatter () and a steeper () surface density distribution, thus comprising the observed range of surface density slopes in circumstellar disks. For a disk with fixed mass, distributing more mass in the inner regions () results in increased mid-infrared line luminosities (upper panel of Fig. 7). But a steeper density slope reduces the radius of the emitting region and results in higher surface density upper limits at 1 AU (middle panel of Fig. 7). For instance, the for the [S i] line decreases from 10.4 AU for to 3.7 AU for , with the intermediate value of 5.5 AU for our fiducial disk (see Table 8). The H2 S(1) transition is more sensitive to the redistribution of mass than the [Fe ii] and [S i] lines because it is the least optically thick transition. Differences between the limiting surface densities are less than a factor of 2 for differing by 0.5 (middle panel of Fig. 7). CO lines are not affected appreciably for or larger but distributing more mass in the outer regions () results in a more extended CO emission and therefore an increase of the mass associated with the emission (by a factor of 6). However, the outer disk mass between two fixed radii (in the zone 10–50 AU) differ by less than a factor of 2. Thus we conclude that uncertainties in the surface density slope introduce only a factor of a few uncertainty in our results.

We then consider the dependence of our results on different stellar UV luminosities. In addition to the UV flux for HD 35850 ( at the stellar radius888 is the flux between 912-2000Å in units of 1.6 erg cm-2 s-1) assumed previously, we have modeled two cases with 100 times higher and 100 times lower UV flux. The effect of higher stellar UV flux is to increase the heating (as well as alter the chemistry) and thus the predicted line luminosities of mid-infrared as well as of millimeter lines (see Fig. 8). Note that an increase of 4 orders of magnitude in the UV flux increases the mid–infrared and millimeter line luminosities by factors smaller than 20 and 3 respectively. Because our method provides order–of–magnitude estimates of the stellar UV field, model line luminosities have only a factor of a few uncertainty. Based on the previous tests on the surface density slope, such luminosity uncertainties should have negligible effects on the limiting surface densities and on the extension of the emitting regions (compare Figs. 7 and 8).

Finally, we test the dependence of our results on the disk inner radius. Our earlier modeling of HD 105 (H05) showed that, for a range of between 1 AU and 40 AU, the upper limit on the surface density at the inner radius varied only by a factor of a few. This result is robust and can be extended to our sample: Spitzer data can set useful upper limits on the surface density for disks with out to 40 AU999Note that will change depending on . The models from H05 suggest that the extension of the region where Spitzer lines originate is a few AU (see Table 2 from H05, there we used the notation instead of ). For inner radii smaller than 1 AU, H05 found that the surface densities required to produce detectable lines increased (see their Fig. 6). This is because for smaller inner radii the mass or area (when lines are optically thick) of the emitting gas decreases. Essentially all the heating is deposited close to the star and gas located at larger radii becomes too cool to produce any line emission at mid–infrared wavelengths. The result was that if the disk inner radius of HD 105 became smaller than AU, line upper limits from Spitzer could not set useful constraints on the gas mass.
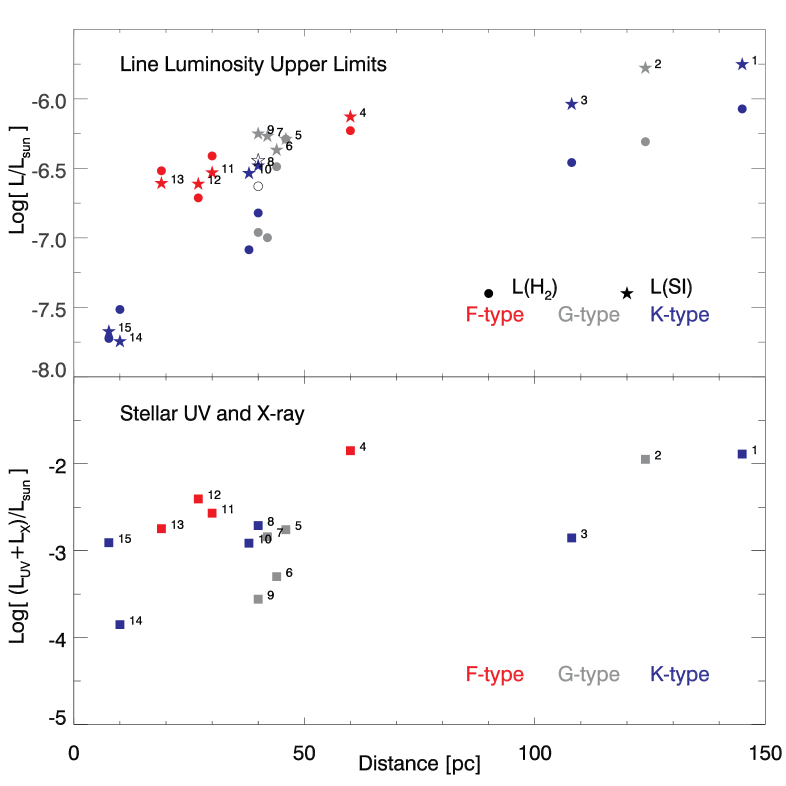
In general, the sensitivity to the disk inner radius depends on the heating (stellar X-ray and UV) and on the line upper limits from Spitzer. While the younger sources in our sample typically have higher X-ray and UV luminosities, and therefore produce more line flux, they are also more distant and so the upper limits on their luminosities are less stringent (see Fig. 9). To illustrate the effect of heating from stellar X-rays and UV we use the two disks around the F-type star HD 35850 and the K-type star HD 17925. We have chosen these sources because they represent extremes in stellar UV and X-ray luminosity (HD 35850 has high UV and X-ray luminosities, whereas HD 17925 has low UV and X-ray luminosities) and have IUE spectra and CO millimeter data (sources 12 and 14 in Fig. 9). We consider 5 disk models with inner disk radii equal to 1, 0.5, 0.3, 0.2, and 0.1 AU and compute for each case the surface density upper limits at the inner radius () from the [S i] transition (filled symbols in Fig. 10)101010We have also computed the from CO lines and noted only marginal changes with . To show the effect of source distance, we also compute upper limits for HD 17925 at 30 pc (Log[L(SI)/L☉]= -6.8) and HD 35850 at 100 pc (Log[L(SI)/L☉]=-5.5), i.e. at about 3 times their real distance (open symbols in Fig. 10). To calculate these line luminosities we have assumed that the flux limits and the S/N do not change with the source distance and simply scaled the luminosities with the distance square (in reality our limits from the [S i] line are better for far–away sources due to longer exposure times but only by a factor of 4 at most). These tests show that: a) more distant sources will typically have larger limits as well as larger disk inner radii at which the gas mass becomes unconstrained by Spitzer observations; b) high stellar heating lowers the limits on the gas surface density for sources at comparable distance (i.e., comparing HD 35850 at 27 pc and HD 17925 at 30 pc we see that we can set useful limits until =0.2 AU for the more luminous HD 35850). Given the Spitzer upper limits and the stellar properties of our sample (Fig. 9), we conclude that we can set useful upper limits to the gas mass in the majority of our systems for disks with inner holes ranging from 0.3 to 40 AU. In the case of the more distant sources ScoPMS 214, MML 17, and MML 28, which are K- and G-type stars, the inner radius at which the surface density cannot be constrained may be larger than 0.3 AU but still less than 1 AU.

5 Discussion
We have shown that infrared and millimeter observations set low limits to the amount of gas in the inner (1-5 AU) and outer (15 AU) regions, respectively, of our fiducial disks. In Sect. 4.3 we have proven that order–of–magnitude uncertainties in the stellar UV field and surface density slopes varying from -1.5 to -0.5 introduce only a factor of a few uncertainty in our results. Reducing the disk inner radius does not affect appreciably the result from the CO millimeter transitions because they originate farther out in the disk. On the other hand, mid-infrared lines are sensitive to small inner disk radii (1 AU). Depending on the stellar properties, there is an inner radius at which Spitzer observations cannot set useful upper limits to the gas mass because the area or mass of the emitting gas is so small that lines cannot produce enough luminosity regardless of the surface density or the total disk mass. This critical inner radius is 0.3 AU for the majority of our targets, and between 0.5 and 1 AU for the three more distant systems (ScoPMS 214, MML 17, and MML 28). Thus the Spitzer observations alone can exclude the existence of gas disks with inner holes AU up to AU around the nearby ( pc) 12 targets and gas disks with inner holes AU up to AU around the 3 targets at distances larger than 100 pc.
We want now to convert surface density upper limits from the [S i] line, the most sensitive mid–infrared transition, to gas mass upper limits and answer the question of whether the targeted disks have enough gas at their present age to form gas giant planets. For 1 AU, we have shown in the previous Section that the [S i] line traces the inner few AU (with 3 AU being the mean value from Table 8) and provides very similar surface density upper limits at the disk inner radius. Thus, we can use the at 1 AU in Table 8 as representative of the limiting gas surface density at the inner radius for disks with between 1 and 40 AU. In this way, we find that Spitzer data can exclude gas masses larger than MJ within 3 AU of the inner radius for disks with inner radii between 1 and 40 AU.111111These masses are not very sensitive to the assumed gas surface density slopes because of the small (few AU) region probed by mid–infrared gas lines. This result is valid for all targets in our sample.
In addition, for the 12 nearby systems we can compute limits on the gas mass for disks with inner radii smaller than 1 AU. In the case of the nearby source HD 17925 (only 10 pc away) which has very stringent line flux upper limits, we can exclude gas disks with inner holes as small as 0.1 AU and a surface density at 1 AU even smaller than those reported in Table 8 (see Fig. 10). This result can be extended to HD 216803 which is similarly nearby and experiences even higher heating (Fig. 9). More generally, limits on for 1 AU increase faster than our assumed density slope and results in higher (up to a factor of 10 for close to 0.3 AU ) surface density upper limits than those reported in Table 8 (see Fig. 10 and the HD 105 models from H05). However, even if assume that is 20 times larger at 0.3 AU (which gives 5 g/cm2), we find that there is less than 0.0008 MJ of gas between 0.3 and 1 AU; a constant surface density slope would have resulted in less than 0.002 MJ of gas.
But could we also rule out a substantial amount (MJ) of gas within 1 AU in the case of the three more distant systems? A gaseous disk extending close to the star may be accreting. We can use the upper limits on the stellar accretion rates for these sources to constrain the amount of gas in this disk region. The mass accretion rate of a steady disk around a solar-type star is121212Eq. 2 was derived from eq. 5.78, 5.64 and 5.31 from Hartmann (1998), assuming a gas surface density and the isothermal sound speed for a hydrogen gas. We normalize the temperature to 100 K because that is close to the dust temperature in the midplane of accreting T Tauri disks.:
| (2) |
where is the viscosity parameter (typically 0.01 from magnetorotational instability models), and and are the gas disk temperature and the surface density at 1 AU. Accretion rates of are routinely measured in disks surrounding young (1 Myr) classical T Tauri stars by modeling the UV excess emission and the profile of the H emission lines. Muzerolle et al. (2000) have extended these techniques to 10 Myr old stars in the TW Hya association and detected accretion rates down to for lower mass stars than are studied here. All our targets have been observed in H with high spectral resolution and found to have only narrow H lines (equivalent widths ) in absorption (White et al., 2006). The absence of H in emission indicates that they have already passed the phase of active gas accretion. We can use the H data for the three more distant sources and the minimum observable from magnetospheric accretion models to infer an upper limit to the mass accretion rate. Magnetospheric accretion models predict that the minimum observable depends on and is about 10 for a 1 Myr old star with =0.5 and =2 (Muzerolle priv. comm.). Given this dependence, the absence of H in emission and the radii and masses of the stars, we can conclude that residual accretion may persist in these disks only at low rates . Accretion rates translate into if the disk is accreting with and is 100 K (eq. 2). This surface density corresponds to a gas mass upper limit of 0.001 from the magnetospheric radius (3 =0.01 AU) out to 1 AU when adopting our fiducial disk surface density of . Although and are extremely uncertain (and that’s why upper limits from Spitzer data alone are valuable), it seems very unlikely that even the three more distant systems have large amounts of gas within 1 AU. Surface density limits at 0.3 AU from the accretion are , comparable to Spitzer limits for nearby sources but much more stringent than what could be set from infrared data alone on these three more distant sources.
In summary, we can exclude gaseous reservoirs of 0.04 MJ within a few AU of the disk inner radius for disk radii from 1 AU up to 40 AU. Spitzer data alone are sensitive to small amounts of gas from about 0.3 AU to 1 AU for the majority of the sources. For the three more distant systems, accretion rate indicators set similarly stringent upper limits in the inner disk regions (1 AU). For disks with inner holes larger than 40 AU, mid–infrared transitions are not sensitive tracers of surface density because the gas is too cold. However, CO millimeter non–detections can exclude the presence of a large reservoir of cold gas at 20 AU. In conclusion, there is no indication that the targeted disks have enough gas to form Jupiter– or Saturn–like planet(s). The present data cannot exclude the possibility that some or all of these systems have already formed such planets.
What can we learn about the gas dissipation timescale based on the above discussion? Our sample includes sources that are beyond the phase of active gas accretion. In addition, their small infrared excesses suggest that they have already dissipated most of their primordial dust and/or agglomerated it into larger particles. Our results show that by this time most of the gas has also been dispersed perhaps by photoevaporation (e.g. Clarke et al. 2001), and/or accreted to form gas giant planets. These conclusions are consistent with a rapid gas dissipation timescale that leaves little trace of gas in optically thin dust disks. More statistics on sources younger than Myr in age and also on sources with optically thick dust disks are necessary to observationally constrain the gas lifetime and explore any link between gas and dust dissipation.
Short gas dissipation timescales are not only relevant to the formation of giant planets but also to the later stages of terrestrial planet formation. These final stages of growth may have involved tens to hundreds of planetary embryos over a timescale of 10 to 100 Myr (Canup, 2004). Numerical simulations find that terrestrial planets grow to Earth-size in timescales of tens of million of years, in agreement with isotopic constraints (Kleine et al., 2002). A problem in the simulations of these later stages is that secular perturbations by (the presumably already formed) Jupiter and Saturn and by neighboring embryos excite terrestrial planet eccentricities131313Collisions with large impactors (up to the mass of Mars) occur frequently at average times of 30 Myr and random orientations but seem to cause smaller changes in the eccentricities than secular perturbations (see e.g. Chambers 2001). Thus, some damping mechanisms seem to be required to circularize the final orbits of terrestrial planets. One possibility is through tidal interactions with a remnant gas disk. Kominami & Ida (2002) suggest that small amounts of gas, between 0.1– 0.01% of the minimum mass solar nebula (MMSN, Weidenschilling 1977; Hayashi 1981), can reduce the eccentricities to values as low as those of Earth and Venus on a timescale of about 10 Myr if secular perturbations from Jupiter and Saturn do not have a significant effect upon the evolution (Kominami & Ida, 2004). Alternatively, dynamical friction associated with remnant swarms of planetesimals can damp the eccentricities over longer timescales even in the presence of perturbations from the giant planets (O’Brien et al., 2006; Raymond et al., 2006). Thus our low gas surface density upper limits at 1 AU (see Fig. 11) suggest that circularization of terrestrial planets if it occurs beyond 10 Myr may have happened primarily through the latter mechanism, although certainly gas could have played a role during the earlier stages of terrestrial planet formation.

Finally, the gas limits in the 10-40 AU region, the region mainly traced by our millimeter CO observations, may also be relevant to the formation of outer gas-poor giant planets such as Uranus and Neptune. Because of the dynamical interactions between embryos and the gravitational effects of Jupiter and Saturn, very little accretion of solids is expected to have occurred at the location of Uranus and Neptune in the absence of mechanisms to increase capture cross sections of embryos (Levison & Stewart, 2001). One way to do this is through gas drag. However, this mechanism would require many Jupiter masses of gas (e.g. Goldreich et al. 2004) that are not observed in any of our targets (see Tables 8 and 9). The CO data for eight of our sources (with ages between 12 and few hundred Myr) indicate that less than 2 Earth masses of gas are present between 10 and 40 AU in our disks. These values are smaller than the gas mass of Uranus and Neptune as inferred by models of their interiors (Guillot, 1999). Thus if Uranus and Neptune formed at their current radii, either gas persisted much longer in the solar nebula than was the case for our target stars, or they formed relatively quickly, in much less than 100 Myr.
6 Summary and Conclusions
We analyzed infrared and millimeter spectra for 15 of our FEPS sources selected for investigating the gas dispersal timescale in disks around solar-type stars. Our targets span a wide age range from 5 to few hundred Myr (with 50% of the sample younger than 30 Myr) and most are surrounded by optically thin dust disks. We did not detect gas lines in the Spitzer IRS modules nor in the millimeter with the SMT. We estimated upper limits to the gas mass using simple approximations and also more sophisticated gas and dust models. In agreement with our previous modeling of HD 105 (H05), we find that optically thin dust disks have too little dust surface density to appreciably heat the gas. Therefore, X–ray and UV flux from the central star become the main heating mechanisms for the gas. We show that gas line upper limits from Spitzer provide sensitive limits to the gas surface density at the disk inner radius. Millimeter CO data are complementary by setting limits on the gas mass in the outer disk (15 AU). We have also discussed the robustness of our results by varying the main uncertain input parameters to the disk models. Future work will include a study weighted towards disks younger than 10 Myr and tests of the gas models on sources with detected gas lines probing different disk regions. Our main conclusions can be summarized as follows:
-
1.
Simple estimates of gas mass upper limits from mid–infrared H2 lines indicate that even the five youngest disks (5-20 Myr) in our sample have less than 0.6 of gas at 100 K. Detailed gas models of the infrared and millimeter upper limits combined with the absence of accretion signatures allow us to conclude that none of the targeted disks have enough gas to form Jupiter– or Saturn–like planets at the present time.
-
2.
Our results do not support the presence of ”large quantities of gas in debris disks” as proposed by Thi et al. (2001a). On the contrary, we have evidence that systems with small dust excess in the 10–30 Myr age range do not have large amounts of remnant gas.
-
3.
We estimate gas surface density upper limits at 1 AU smaller than 0.01% of the MMSN model for most of the sources, eight of which have ages between 5–30 Myr. If the circularization of terrestrial planets occurs in this age range, then gas surface densities appear to be so low that interactions with planetesimals seem to be the only viable mechanism to circularize their orbits.
-
4.
The gas limits from CO data in the 10-40 AU region are less than a few . These values are far too low for gas drag to enhance the gravitational cross section of embryos and speed up the in-situ formation of Uranus and Neptune. In addition, if these systems are analogs of the Solar System, our results indicate relatively short timescales ( 100 Myr) for the formation of Uranus– and Neptune–like planets.
References
- Apai et al. (2005) Apai, D., Pascucci, I., Bouwman, J., Natta, A., Henning, T., & Dullemond, C. P. 2005, Science, 310, 834
- Bary et al. (2003) Bary, J. S., Weintraub, D. A., & Kastner, J. H. 2003, ApJ, 586, 1136
- Bouwman et al. (2001) Bouwman, J., Meeus, G., de Koter, A., Hony, S., Dominik, C., & Waters, L. B. F. M. 2001, A&A, 375, 950
- Bryden et al. (2006) Bryden, G., Beichman, C. A., Trilling, D. E., Rieke, G. H., Holmes, E. K., Lawler, S. M., Stapelfeldt, K. R., Werner, M. W., Gautier, T. N., Blaylock, M., Gordon, K. D., Stansberry, J. A., & Su, K. Y. L. 2006, ApJ, 636, 1098
- Buscombe (1998) Buscombe, W. 1998, VizieR Online Data Catalog, 3206, 0
- Canup (2004) Canup, R. M. 2004, ARA&A, 42, 441
- Chambers (2001) Chambers, J. E. 2001, Icarus, 152, 205
- Chen (2005) Chen, C. H. 2005, to appear in the ASP conference proceedings of ”Frank N. Bash Symposium 2005: New Horizons in Astronomy”
- Chen et al. (2006) Chen, C. H., Sargent, B. A., Bohac, C., Kim, K. H., Leibensperger, E., Jura, M., Najita, J., Forrest, W. J., Watson, D. M., Sloan, G. C., & Keller, L. D. 2006, ArXiv Astrophysics e-prints
- Chiang & Goldreich (1997) Chiang, E. I. & Goldreich, P. 1997, ApJ, 490, 368
- Clarke et al. (2001) Clarke, C. J., Gendrin, A., & Sotomayor, M. 2001, MNRAS, 328, 485
- de Zeeuw et al. (1999) de Zeeuw, P. T., Hoogerwerf, R., de Bruijne, J. H. J., Brown, A. G. A., & Blaauw, A. 1999, AJ, 117, 354
- Dent et al. (2005) Dent, W. R. F., Greaves, J. S., & Coulson, I. M. 2005, MNRAS, 359, 663
- Draine & Lee (1984) Draine, B. T. & Lee, H. M. 1984, ApJ, 285, 89
- Dutrey & Guilloteau (2004) Dutrey, A. & Guilloteau, S. 2004, Ap&SS, 292, 407
- Dutrey et al. (1996) Dutrey, A., Guilloteau, S., Duvert, G., Prato, L., Simon, M., Schuster, K., & Menard, F. 1996, A&A, 309, 493
- Dutrey et al. (2004) Dutrey, A., Lecavelier Des Etangs, A., & Augereau, J.-C. 2004, The observation of circumstellar disks: dust and gas components (Comets II), 81–95
- Fajardo-Acosta et al. (1999) Fajardo-Acosta, S. B., Stencel, R. E., Backman, D. E., & Thakur, N. 1999, ApJ, 520, 215
- Gautier et al. (2001) Gautier, D., Hersant, F., Mousis, O., & Lunine, J. I. 2001, ApJ, 550, L227
- Goldreich et al. (2004) Goldreich, P., Lithwick, Y., & Sari, R. 2004, ARA&A, 42, 549
- Gray et al. (2006) Gray, R. O., Corbally, C. J., Garrison, R. F., McFadden, M. T., Bubar, E. J., McGahee, C. E., O’Donoghue, A. A., & Knox, E. R. 2006, ArXiv Astrophysics e-prints
- Gray et al. (2003) Gray, R. O., Corbally, C. J., Garrison, R. F., McFadden, M. T., & Robinson, P. E. 2003, AJ, 126, 2048
- Guillot (1999) Guillot, T. 1999, Science, 286, 72
- Habing (1969) Habing, H. J. 1969, Bull. Astron. Inst. Netherlands, 20, 177
- Habing et al. (2001) Habing, H. J., Dominik, C., Jourdain de Muizon, M., Laureijs, R. J., Kessler, M. F., Leech, K., Metcalfe, L., Salama, A., Siebenmorgen, R., Trams, N., & Bouchet, P. 2001, A&A, 365
- Hartmann (1998) Hartmann, L. 1998, Accretion Processes in Star Formation (Accretion processes in star formation / Lee Hartmann. Cambridge, UK ; New York : Cambridge University Press, 1998. (Cambridge astrophysics series ; 32) ISBN 0521435072.)
- Hayashi (1981) Hayashi, C. 1981, Progress of Theoretical Physics Supplement, 70, 35
- Herczeg et al. (2002) Herczeg, G. J., Linsky, J. L., Valenti, J. A., Johns-Krull, C. M., & Wood, B. E. 2002, ApJ, 572, 310
- Hollenbach et al. (2005) Hollenbach, D., Gorti, U., Meyer, M., Kim, J. S., Morris, P., Najita, J., Pascucci, I., Carpenter, J., Rodmann, J., Brooke, T., Hillenbrand, L., Mamajek, E., Padgett, D., Soderblom, D., Wolf, S., & Lunine, J. 2005, ApJ, 631, 1180
- Houk (1982) Houk, N. 1982, CDS Catalogue
- Houk & Cowley (1975) Houk, N. & Cowley, A. P. 1975, CDS Catalogue
- Houk & Smith-Moore (1988) Houk, N. & Smith-Moore, M. 1988, CDS Catalogue
- Houk & Swift (1999) Houk, N. & Swift, C. 1999, CDS Catalogue
- Huensch et al. (1998) Huensch, M., Schmitt, J. H. M. M., & Voges, W. 1998, A&AS, 132, 155
- Jacobsen (2005) Jacobsen, S. B. 2005, Annual Review of Earth and Planetary Sciences, 33, 531
- Jaschek (1978) Jaschek, M. 1978, Bulletin d’Information du Centre de Donnees Stellaires, 15, 121
- Jonkheid et al. (2004) Jonkheid, B., Faas, F. G. A., van Zadelhoff, G.-J., & van Dishoeck, E. F. 2004, A&A, 428, 511
- Keller et al. (2002) Keller, L. P., Hony, S., Bradley, J. P., Molster, F. J., Waters, L. B. F. M., Bouwman, J., de Koter, A., Brownlee, D. E., Flynn, G. J., Henning, T., & Mutschke, H. 2002, Nature, 417, 148
- Kim et al. (2005) Kim, J. S., Hines, D. C., Backman, D. E., Hillenbrand, L. A., Meyer, M. R., Rodmann, J., Moro-Martín, A., Carpenter, J. M., Silverstone, M. D., Bouwman, J., Mamajek, E. E., Wolf, S., Malhotra, R., Pascucci, I., Najita, J., Padgett, D. L., Henning, T., Brooke, T. Y., Cohen, M., Strom, S. E., Stobie, E. B., Engelbracht, C. W., Gordon, K. D., Misselt, K., Morrison, J. E., Muzerolle, J., & Su, K. Y. L. 2005, ApJ, 632, 659
- Kleine et al. (2002) Kleine, T., Münker, C., Mezger, K., & Palme, H. 2002, Nature, 418, 952
- Kominami & Ida (2002) Kominami, J. & Ida, S. 2002, Icarus, 157, 43
- Kominami & Ida (2004) —. 2004, Icarus, 167, 231
- Lecavelier des Etangs et al. (2001) Lecavelier des Etangs, A., Vidal-Madjar, A., Roberge, A., Feldman, P. D., Deleuil, M., André, M., Blair, W. P., Bouret, J.-C., Désert, J.-M., Ferlet, R., Friedman, S., Hébrard, G., Lemoine, M., & Moos, H. W. 2001, Nature, 412, 706
- Levison & Stewart (2001) Levison, H. F. & Stewart, G. R. 2001, Icarus, 153, 224
- Makarov (2003) Makarov, V. V. 2003, AJ, 126, 1996
- Mamajek et al. (2002) Mamajek, E. E., Meyer, M. R., & Liebert, J. 2002, AJ, 124, 1670
- Mathis (1990) Mathis, J. S. 1990, ARA&A, 28, 37
- Meyer et al. (2006) Meyer, M. R., Backman, D. E., Weinberger, A. J., & Wyatt, M. C. 2006, Protostars and Planets V, in press
- Micela et al. (1997) Micela, G., Favata, F., & Sciortino, S. 1997, A&A, 326, 221
- Moor et al. (2006) Moor, A., Abraham, P., Derekas, A., Kiss, C., Kiss, L. L., Apai, D., Grady, C., & Henning, T. 2006, ArXiv Astrophysics e-prints
- Muzerolle et al. (2000) Muzerolle, J., Calvet, N., Briceño, C., Hartmann, L., & Hillenbrand, L. 2000, ApJ, 535, L47
- Najita et al. (2003) Najita, J., Carr, J. S., & Mathieu, R. D. 2003, ApJ, 589, 931
- Najita & Williams (2005) Najita, J. & Williams, J. P. 2005, ApJ, 635, 625
- O’Brien et al. (2006) O’Brien, D. P., Morbidelli, A., & Levison, H. F. 2006, Icarus, in press
- Pascucci et al. (2004) Pascucci, I., Wolf, S., Steinacker, J., Dullemond, C. P., Henning, T., Niccolini, G., Woitke, P., & Lopez, B. 2004, A&A, 417, 793
- Perryman et al. (1997) Perryman, M. A. C., Lindegren, L., Kovalevsky, J., Hoeg, E., Bastian, U., Bernacca, P. L., Crézé, M., Donati, F., Grenon, M., van Leeuwen, F., van der Marel, H., Mignard, F., Murray, C. A., Le Poole, R. S., Schrijver, H., Turon, C., Arenou, F., Froeschlé, M., & Petersen, C. S. 1997, A&A, 323, L49
- Pollack et al. (1994) Pollack, J. B., Hollenbach, D., Beckwith, S., Simonelli, D. P., Roush, T., & Fong, W. 1994, ApJ, 421, 615
- Preibisch et al. (2002) Preibisch, T., Brown, A. G. A., Bridges, T., Guenther, E., & Zinnecker, H. 2002, AJ, 124, 404
- Przygodda et al. (2003) Przygodda, F., van Boekel, R., Àbrahàm, P., Melnikov, S. Y., Waters, L. B. F. M., & Leinert, C. 2003, A&A, 412, L43
- Raymond et al. (2006) Raymond, S. N., Quinn, T., & Lunine, J. I. 2006, Icarus, in press
- Ribas et al. (2005) Ribas, I., Guinan, E. F., Güdel, M., & Audard, M. 2005, ApJ, 622, 680
- Richter et al. (2002) Richter, M. J., Jaffe, D. T., Blake, G. A., & Lacy, J. H. 2002, ApJ, 572, L161
- Rieke et al. (2005) Rieke, G. H., Su, K. Y. L., Stansberry, J. A., Trilling, D., Bryden, G., Muzerolle, J., White, B., Gorlova, N., Young, E. T., Beichman, C. A., Stapelfeldt, K. R., & Hines, D. C. 2005, ApJ, 620, 1010
- Roberge et al. (2005) Roberge, A., Weinberger, A. J., Redfield, S., & Feldman, P. D. 2005, ApJ, 626, L105
- Sako et al. (2005) Sako, S., Yamashita, T., Kataza, H., Miyata, T., Okamoto, Y. K., Honda, M., Fujiyoshi, T., & Onaka, T. 2005, ApJ, 620, 347
- Savage & Sembach (1996) Savage, B. D. & Sembach, K. R. 1996, ARA&A, 34, 279
- Schmitt & Liefke (2004) Schmitt, J. H. M. M. & Liefke, C. 2004, A&A, 417, 651
- Scoville et al. (1986) Scoville, N. Z., Sargent, A. I., Sanders, D. B., Claussen, M. J., Masson, C. R., Lo, K. Y., & Phillips, T. G. 1986, ApJ, 303, 416
- Sheret et al. (2003) Sheret, I., Ramsay Howat, S. K., & Dent, W. R. F. 2003, MNRAS, 343, L65
- Shu et al. (1987) Shu, F. H., Adams, F. C., & Lizano, S. 1987, ARA&A, 25, 23
- Song et al. (2003) Song, I., Zuckerman, B., & Bessell, M. S. 2003, ApJ, 599, 342
- Spangler et al. (2001) Spangler, C., Sargent, A. I., Silverstone, M. D., Becklin, E. E., & Zuckerman, B. 2001, ApJ, 555, 932
- Sternberg & Neufeld (1999) Sternberg, A. & Neufeld, D. A. 1999, ApJ, 516, 371
- Su et al. (2005) Su, K. Y. L., Rieke, G. H., Misselt, K. A., Stansberry, J. A., Moro-Martin, A., Stapelfeldt, K. R., Werner, M. W., Trilling, D. E., Bendo, G. J., Gordon, K. D., Hines, D. C., Wyatt, M. C., Holland, W. S., Marengo, M., Megeath, S. T., & Fazio, G. G. 2005, ApJ, 628, 487
- Tagliaferri et al. (1994) Tagliaferri, G., Cutispoto, G., Pallavicini, R., Randich, S., & Pasquini, L. 1994, A&A, 285, 272
- Takeuchi & Artymowicz (2001) Takeuchi, T. & Artymowicz, P. 2001, ApJ, 557, 990
- Thi et al. (2001a) Thi, W. F., Blake, G. A., van Dishoeck, E. F., van Zadelhoff, G. J., Horn, J. M. M., Becklin, E. E., Mannings, V., Sargent, A. I., van den Ancker, M. E., & Natta, A. 2001a, Nature, 409, 60
- Thi et al. (2001b) Thi, W. F., van Dishoeck, E. F., Blake, G. A., van Zadelhoff, G. J., Horn, J., Becklin, E. E., Mannings, V., Sargent, A. I., van den Ancker, M. E., Natta, A., & Kessler, J. 2001b, ApJ, 561, 1074
- Valenti et al. (2003) Valenti, J. A., Fallon, A. A., & Johns-Krull, C. M. 2003, ApJS, 147, 305
- Valenti et al. (2000) Valenti, J. A., Johns-Krull, C. M., & Linsky, J. L. 2000, ApJS, 129, 399
- Voges et al. (1999) Voges, W., Aschenbach, B., Boller, T., Bräuninger, H., Briel, U., Burkert, W., Dennerl, K., Englhauser, J., Gruber, R., Haberl, F., Hartner, G., Hasinger, G., Kürster, M., Pfeffermann, E., Pietsch, W., Predehl, P., Rosso, C., Schmitt, J. H. M. M., Trümper, J., & Zimmermann, H. U. 1999, A&A, 349, 389
- Walter et al. (2003) Walter, F. M., Herczeg, G., Brown, A., Ardila, D. R., Gahm, G. F., Johns-Krull, C. M., Lissauer, J. J., Simon, M., & Valenti, J. A. 2003, AJ, 126, 3076
- Walter et al. (1994) Walter, F. M., Vrba, F. J., Mathieu, R. D., Brown, A., & Myers, P. C. 1994, AJ, 107, 692
- Weidenschilling (1977) Weidenschilling, S. J. 1977, Ap&SS, 51, 153
- White et al. (2006) White, R. J., Gabor, J., & Hillenbrand, L. A. 2006, AJ, submitted
- Wichmann et al. (2003) Wichmann, R., Schmitt, J. H. M. M., & Hubrig, S. 2003, A&A, 399, 983
- Wood et al. (2005) Wood, B. E., Redfield, S., Linsky, J. L., Müller, H.-R., & Zank, G. P. 2005, ApJS, 159, 118
- Wyatt et al. (1999) Wyatt, M. C., Dermott, S. F., Telesco, C. M., Fisher, R. S., Grogan, K., Holmes, E. K., & Piña, R. K. 1999, ApJ, 527, 918
- Zuckerman et al. (1995) Zuckerman, B., Forveille, T., & Kastner, J. H. 1995, Nature, 373, 494
- Zuckerman & Song (2004) Zuckerman, B. & Song, I. 2004, ARA&A, 42, 685
- Zuckerman et al. (2001) Zuckerman, B., Song, I., Bessell, M. S., & Webb, R. A. 2001, ApJ, 562, L87
- Zuckerman & Webb (2000) Zuckerman, B. & Webb, R. A. 2000, ApJ, 535, 959