Gemini/GMOS IFU stellar kinematics of the nuclear region of six nearby active galaxies
Abstract
We present two-dimensional (2D) mapping of the stellar velocity field within the inner 5″ of six nearby active galaxies, using spectra obtained with the Integral Field Unit of the GMOS instrument at the Gemini North telescope. The sampling of the observations is 02, corresponding at the galaxies to spatial extents ranging from 10 to 30 pc. The spatial resolution range from 20 to about 180 pc, and the observed field of view covers a few hundred parsecs around the nuclei. The Calcium II triplet absorption features at 8500Å were used to measure the stellar radial velocities and velocity dispersions. The radial velocity fields are dominated by rotation in all galaxies. A simple kinematical model assuming a purely rotating system with circular orbits in a plane was fitted to the radial velocity data. The turnover of the rotation curve is at only pc for NGC 4051 and between 200 and 700 pc for the other 5 galaxies. The velocity dispersion () maps show the largest values ( km s-1) at the centre. In the cases of NGC 2273 and NGC 3227, there is a decrease to km s-1 at pc from the nucleus, delineating partial rings of low values. A similar broken ring seems to be present at pc from the nucleus also in NGC 4593. We interpret these low rings as traces of recently formed stars that partially keep the cold kinematics of the original gas from which they have formed. In NGC 3516 there is a decrease of outwards with the steepest gradient observed along the direction of the galaxy major axis, where reaches km s-1 at pc from the nucleus.
The main novelty of the present work is the unprecedented spatial resolution reached by a 2D study of stellar kinematics of Seyfert galaxies using an IFU. The few similar IFU studies available in the literature for Seyfert galaxies have a much poorer spatial resolution and/or are restricted to the study of emission line kinematics.
keywords:
galaxies: active – galaxies: Seyfert – galaxies: nuclei – galaxies: starburst – galaxies: kinematics and dynamics – stellar dynamics1 Introduction
It is now widely accepted that active galactic nuclei (AGN) are powered by the accretion of material onto a central supermassive black-hole (SMBH). The present paradigm for the evolution of galaxies is that all galaxies which form bulges also form a SMBH at their centres (Ferrarese & Merritt 2000; Gebhardt et al. 2000). In this scenario, the active galaxies are those in which the SMBH is presently accreting material from its surroundings.
A problem still under investigation is the mechanisms by which the material is dragged to the nuclear regions to feed the AGN, as the galactic gas must loose almost all of its angular momentum in order to reach the central few parsecs. Signatures that such feeding is occurring include the frequent occurrence of recent star formation around AGN, which implies the existence of a gas reservoir close to the AGN (Schmitt et al., 1999; Cid Fernandes et al., 2001; Storchi-Bergmann et al., 2000; Boisson et al., 2000; Cid Fernandes et al., 2005; Storchi-Bergmann et al., 2005). Besides the signatures of young stars observed in spectra of AGN, kiloparsec scale kinematic studies (Nelson & Whittle, 1995, 1996) have suggested that Seyfert galaxies have lower mean mass-to-light ratios than normal galaxies, which also could be due to a younger near-nuclear stellar population (Oliva et al., 1995, 1999).
The presence of young stars near the nucleus seems also to be the explanation for the results of recent studies investigating the stellar kinematics on scales of hundred of parsecs (Emsellem et al., 2001; García-Lorenzo et al., 1999; Márquez et al., 2003). These studies have found a central drop in the stellar velocity dispersion (hereafter -drop) in a few galaxies with Seyfert nuclei. Wozniak et al. (2003) presented simulations showing that a new generation of stars formed at the centre of the galaxy from cold material would create such a drop which would remain visible for hundreds of Myrs. Nevertheless, a decrease in towards the nucleus has been recently observed also in late-type non-active galaxies Ganda et al. (2006), supporting its link to recent star-formation, but not necessarily to nuclear activity in galaxies.
Most studies available in the literature on kinematics of Seyfert galaxies are based on long-slit observations, which are restricted to only one axis of the host galaxies. In order to properly probe the galactic gravitational potential, as well as to investigate the nature and extent of the -drops, it is necessary to cover a 2D region, what we have done in the present work using the Integral Field Unit (IFU) of the Gemini Multi-object Spectrograph (GMOS).
The power of IFU observations to map the large scale kinematics of galaxies has been evidenced in recent studies (e.g. Ganda et al. 2006). For AGN, only few such studies are available (e.g. Emsellem et al. 2006 for NGC 1068). Most AGN kinematic studies have focused on gas emission-lines, as it is much easier to obtain kinematical data from emission lines than from stellar absorption features. Nevertheless, the gas in the nuclear region of AGNs is subject to non-gravitational effects, such as winds and jets, and in order to probe the gravitational potential, it is necessary to measure the stellar kinematics.
In this work, we use the IFU-GMOS to map the stellar kinematics in the inner few hundred parsecs of 6 of the closest Seyfert galaxies. The combination of the spatial resolution at the galaxies reached by the observations (down to a few tens of parsecs), 2D coverage, stellar kinematics, and a Seyfert sample is unique in the literature.
This paper is organized as follows. In Section 2 we present the criteria used to select the sample and discuss the relevant information for each galaxy. In Section 3 we describe the observations and reductions, in section 4 we present the methods used to analyze the data and in Section 5 we report and discuss our results. In section 6 we present a summary of the results and our conclusions.
2 Sample
We chose to map the stellar kinematics using the Ca II triplet absorption feature around 8500Å (hereafter Ca-T) due to the fact that this spectral region is not much affected by emission lines and the continuum of the active nucleus, and thus clearer measurements of the stellar kinematics can be made.
The sample galaxies were selected as the closest Seyfert galaxies for which previous spectra in the Ca-T region were available in the literature (Nelson & Whittle, 1995), so that we could check, in advance, if the absorption features to be used in the stellar kinematic measurements were clearly present in the spectra. In this work, we present the results for six Seyfert galaxies, whose properties are listed in Table 1.
Besides selecting the galaxies on the basis of their proximity and detectability of the stellar Ca-T, we also looked for the presence of strong [S iii] line emission, as this line could be included in the same observational set up used to observe the Ca-T. The results based on the measurements of this emission-line, such as intensity maps and gaseous kinematics, will be presented in a forthcoming paper.
We have also observed kinematic standard stars, to be used as references in the measurement of the radial velocities and velocity dispersions of the sample galaxies.
2.1 NGC 2273
From a 6 cm radio map, Ulvestad & Wilson (1984) found the nucleus to be resolved into two distinct components separated by 09 along E-W. Ferruit, Wilson & Mulchaey (2000), using HST, resolved the central ovoid of the galaxy, which shows two arc-like structures forming a partial nuclear ring, with semi-major axis of , observed both in a broad-band and in a [N ii]H emission-line image. They suggest that emission in the ring, also weakly observed in [O iii], comes from H ii regions.
The partial ring is also detected in a color map which presents lower values to NW suggesting this is the near side of the ring. The analysis of the [O iii] and [N ii]H emission line images reveals a jet-like structure which extends by 2″ to E of the nucleus and is aligned with the radio structures observed in 6 cm.
Subsequent investigation (Erwin & Sparke, 2003) based on HST images and colour maps led the authors to classify the nuclear ring as a star-forming ring. They also classified the structure internal to the ring as a luminous two-armed blue spiral in opposition to a previous bar-like interpretation (Mulchaey & Regan, 1997).
2.2 NGC 3227
This galaxy forms an interacting pair with the elliptical galaxy NGC 3226. Gonzalez Delgado & Perez (1997) reported traces of young stellar population in the nuclear optical spectrum. Mundell et al. (1995) studied the H i emission and found that the galaxy disk is inclined by 56°with major axis at PA and contains an H i mass of M⊙. H2 maps have been obtained by Quillen et al. (1999) from HST/NICMOS images and show elongated emission along PA. Meixner et al. (1990) obtained 12CO (1-0) maps showing a nuclear double peak aligned roughly E-W separated by 2″ and extended emission running from SE to NW at 30° from the major axis of the galaxy (the direction pointing to the companion galaxy NGC 3226). To explain these maps Fernandez et al. (1999) proposed a gas “disk” of 100 pc diameter with a major axis along PA. Better resolution 12CO (1-0) and 12CO (2-1) maps were obtained by Schinnerer, Eckart & Tacconi (2000) who find that the central region is resolved into an uneven ring-like structure with radius ″ and the E part six times brighter than the W part. These maps also show the SE-NW extended structures and a nuclear bar that connects the ring to the external NW component. The kinematical analysis led them to conclude that a warped gas disk provides a better description of the observed gas motions than a bar.
2.3 NGC 3516
This was the first Seyfert galaxy with detected line variability (Andrillat & Souffrin, 1968). More recently Weaver Gelbord & Yaqoob (2001) observed variability in both the X-ray continuum and K line. Regan & Mulchaey (1999), using HST images showed that a single dust spiral pattern dominates the nuclear morphology. Using J-band images Quillen et al. (1999) proposed that this galaxy has two bars. Nagar et al. (1999) found a radio jet along P.A. which corresponds to the near side of the galaxy, according to Malkan, Gorjian & Tam (1998), so this jet would be projected against the near side of the galaxy. H [N ii] and [O iii] images show a “Z”-shaped circumnuclear emission extended by ″ from SW to NE (Pogge, 1989; Miyaji, Wilson & Perez-Fournon, 1992). The gas velocities inside this structure cannot be reproduced by rotation, but can be explained by a nuclear outflow (Mulchaey et al., 1992; Veilleux, Tully, & Bland-Hawthorn, 1993). The galactic disc does not contain H ii regions, according to Gonzalez Delgado et al. (1997).
2.4 NGC 4051
Using [O iii] emission-line archival HST images, Schmitt & Kinney (1996) found an unresolved nuclear source and a low surface brightness component extending 12 from the nucleus along PA , approximately the same orientation as that connecting the two radio components at 6 cm detected by Ulvestad & Wilson (1984), which are separated by 04. In radio 6 and 20 cm but with a resolution of 1″ Ho & Ulvestad (2001) detected a larger scale component extending to SW and NE from the nucleus. Veilleux (1991) reported blue wings in the forbidden optical emission lines and proposed a model with outflow and obscuring dust. The mid and far infrared fluxes have been explained by Rodriguez Espinosa et al. (1996) and Contini & Viegas (1999) as due to hot dust emission. In X-rays Lawrence et al. (1985) found variability on time scales of hundreds of seconds and Salvati et al. (1993) reported a flux change by a factor 2 at 2.2 m in 6 months. Using X-ray maps of the nuclear region Singh (1999) proposed the existence of a component associated with the nuclear activity and other associated with a starburst extended by .
2.5 NGC 4593
This is a Seyfert 1 galaxy with detected nuclear variability in X-rays by Weaver Gelbord & Yaqoob (2001) and in the optical and infrared by Winkler et al. (1992), Kotilainen, Ward & Williger (1993) and Kotilainen & Ward (1994). The H map obtained by Gonzalez Delgado et al. (1997) shows ionized gas in a nuclear halo with radius 2-3″ elongated N to S, and at the border of the halo some patches of emission which they suggest to be a broken starburst ring with minor axis length running S to N. There are a number of H ii regions in the spiral arms but none in the large scale bar (Evans et al., 1996).
2.6 NGC 4941
According to the hard and soft X-rays spectra, Maiolino, Risaliti & Salvati (1999) calculated that the nucleus of this galaxy has a column density of cm-2. Extended [O iii] emission (Pogge, 1989) shows an halo shape extending up to ″ from the nucleus while H emission is concentrated in H ii regions along the spiral arms. Schmitt et al. (2001) found two resolved radio components separated by 15 pc along PA .
3 Observations and reductions
| Galaxy | Morph. | Seyfert | Scale | Image qualitya | |
|---|---|---|---|---|---|
| type | type | pc/(″) | (″) | pc | |
| NGC 2273 | SBa | 2 | 120 | 1.00 | 120 |
| NGC 3227 | SAB pec | 1.5 | 84 | 0.80 | 67 |
| NGC 3516 | S0 | 1.5 | 183 | 0.98 | 180 |
| NGC 4051 | SABbc | 1 | 45 | 0.50 | 23 |
| NGC 4593 | SBb | 1 | 174 | 0.49 | 85 |
| NGC 4941 | Sab | 2 | 72 | 0.40 | 29 |
a Although this has been obtained from the PSF measured in the acquisition image, we verified that the nuclear PSF measured in the reconstructed image of the Seyfert 1 galaxies is the same for NGC 4051 and only % larger for NGC 4593.
The data were obtained in queue mode over three semesters at the Gemini North telescope, using the GMOS IFU. The instrumental setup for each program is shown in Table 2. The spectral resolution was (FWHM km s-1) with a wavelength sampling of 0.692 Å/pix. The GMOS IFU consists of an hexagonal array of 1000 lenslets which send the light through optical fibers to the spectrograph. The lenslet array samples a field-of-view (FOV) of 7. The sky is sampled with a field which is displaced by 1 arcmin from the object and has one half of the size of the object field. The centres of contiguous lenses are separated by 02, which is also the distance between opposite faces of the hexagonal lenses. The effective slit aperture for every lens is, however, 031.
Each half of the fibres (corresponding to half of the FOV) is aligned to a separate pseudo-slit. The data can be obtained using both slits (full FOV) or one slit (half the FOV, or ) with twice the wavelength coverage. The spectra are projected into an array of three EEV chips disposed side by side with small gaps in between. The peaks of contiguous spectra are separated by pixels. In two-slit mode each pseudo-slit illuminates one side of the array, and the use of passband filters avoids spectral overlap.
| PROGID | Date | Observed | Field size | Exp Time | Grating/ | Spec. coverage |
|---|---|---|---|---|---|---|
| (MM/YYYY) | galaxies | (″) | (s) | Filter | (Å) | |
| GN-2002B-Q-15 | 12/2002 | NGC 3227 | 3.55 | 1440 | R400/RG610_G0307 | 6400 - 10400 |
| NGC 3516 | 1440 | R400/RG610_G0307 | ||||
| BD +31 22 14 | ||||||
| GN-2003A-Q-20 | 03/2003 | NGC 4051 | 75 | 1800 | R400/CaT_G0309 | 8250 - 9450 |
| NGC 4941 | 1800 | R400/CaT_G0309 | ||||
| BD +21 24 25 | ||||||
| GN-2004A-Q-1 | 02/2004 | NGC 2273 | 75 | 3600 | R400/CaT_G0309 | 7700 - 9500 |
| NGC 4593 | 3600 | R400/CaT_G0309 | ||||
| BD +31 22 14 |
Before the spectral observations, one direct image was obtained for centering purposes, allowing an evaluation of the image quality. This value, measured as the FWHM of the stellar PSFs in the field, is listed in Table 1.
Data reduction was accomplished using generic IRAF111 IRAF is distributed by the National Optical Astronomy Observatories, which is operated by the Association of Universities for Research in Astronomy, Inc. (AURA) under cooperative agreement with the National Science Foundation. tasks as well as specific tasks developed for GMOS data in the gemini.gmos package. The reduction process comprised trimming, bias subtraction, flat-fielding, cosmic rays cleaning, alignment and interpolation of the data across the chips to recover all the spectra in one frame, extraction of the spectra (the tracing is done using flat spectra), wavelength calibration, sky subtraction and co-addition of different exposures.

In Fig. 1 we show, for each galaxy, the spectra from selected lenses. The left panels show the nuclear spectra, defined as the one with the strongest flux in the continuum around 8500. The right panel shows the spectra corresponding to a lens located at 17 from the centre of the array, towards the left side of the IFU field.
The nuclear spectra of the Seyfert 1 galaxies NGC 4051 and NGC 4593 present too much contamination from the AGN continuum and emission lines. In the case of NGC 4051 these lines include the O i blend at , Ca-T in emission and a number of Paschen emission lines. In the case of NGC 4593 the O i emission is very broad and there are a number of other emission lines (e.g. N i ). These strong emission lines precluded the measurements of the stellar kinematics within from the nucleus in these galaxies. This effect was unexpected on the basis of the previously inspected integrated spectra (Nelson & Whittle, 1995), probably because it was diluted in their large aperture. In any case, the information we could obtain for these galaxies outside the contaminated region is still valuable and have been included in the present work. The spectra of the Seyfert 1.5 galaxies NGC 3227 and NGC 3516 (some authors classify the latter as Sy 1) present weak contamination from the broad O I line which, however, does not affect the measurements significantly, as the two strongest absorption lines of the Ca-T are unaffected.
Even after subtraction of the sky contribution, there remained some sky lines residuals in the extranuclear spectra, observed in Fig. 1. For these lines as well as for the faint emission lines in the nuclear spectra of NGC 4941, we have set the parameters of the xcsao task (used in the velocity dispersion measurements) to interpolate the continuum eliminating all data points with fluxes higher than 1 standard deviation of the average continuum flux within the cross-correlation window. We have checked that this procedure efficiently eliminated the residual emission lines.
4 Data analysis
4.1 Velocity measurements; cross-correlation technique
The kinematic measurements were performed by cross-correlating the spectra of individual lenslets with the spectrum of a kinematic standard star observed with the same setup as the galaxies. The cross-correlation was performed using the task xcsao of the package rvsao (Kurtz & Mink, 1998) in IRAF, over the spectral range 8430-8900 Å which includes the Ca-T features but avoids the noisy regions at the extremes of the spectra. The task uses the method of the quotient of the Fourier transforms applied to the spectra in velocity space and searches for the peak of the cross-correlation function, fitting a quartic function to the data with values above 50% of the peak and giving as outputs the peak velocity and the full width at half maximum (FWHM) of the cross-correlation function.
As the surface brightness of the galaxies decreases towards the borders of the field, in order to improve the signal-to-noise ratio at these locations, we replaced each individual spectrum by the average of itself and the 6 nearest spectra (which are closer than 03). This replacement was done for the spectra beyond a radius 1″ from the centroid of the 8500Å continuum brightness distribution.
In order to obtain the velocity dispersion values from the measured line widths we have convolved the spectrum of the kinematic standard star with Gaussian curves of known FWHM – where FWHM , and is the velocity dispersion – to create a set of synthetic spectra. We then performed the cross correlation between these synthetic spectra and that of the kinematic standard, measuring the FWHM of the cross correlation function as we did for the galaxies. By plotting the measured widths against the known Gaussian widths we obtain a very tight linear relation which is then used to obtain the real FWHM from the measured FWHM for each galaxy. Finally, as the radial velocities are measured relative to the kinematic standard star, the radial velocity obtained for each galaxy was corrected by the observatory motion relative to the local standard of rest and by the standard star radial velocity as determined from the shifts between the measured wavelengths of the Ca-T lines in the standard spectrum and their rest wavelengths.
4.2 Error calculation
The IRAF cross-correlation task xcsao calculates the error following the method of Tonry & Davis (1979), which is similar to that used by Nelson & Whittle (1995). This method uses the signal-to-noise ratio and the FWHM of the cross-correlation peak, assuming that the error in is the same as in :
| (1) |
For the spectra where the Ca-T lines are clearly detected and are not contaminated by emission lines, we obtain errors in the range 4-17 km s-1 for all galaxies. However, there is a loose correlation between the velocity dispersion measurements and the error calculated by this formula, due to a dependence in that is not fully canceled by , an effect also pointed out by Nelson & Whittle (1995). This led us to adopt a conservative approach regarding the error reported by the xcsao task. After inspecting some representative spectra and the calculated error values, we adopted km s-1 as the errors in our individual measurements for and . We note that this is actually an upper limit, which may overestimates the actual errors for some of the measurements, in particular the ones from the more central spectra.
4.3 Alternative velocity measurements; pixel fitting technique
In order to investigate the dependence of the velocity fields and in particular of the velocity dispersions on the measurement technique we have also carried out a kinematic analysis in pixel space (Barth et al., 2002; Cappellari & Emsellem, 2004).
Our implementation of the direct-fitting-method is essentially the one used in García-Rissmann et al. (2005), the only difference being that we rectified all spectra to account for the different slopes of stellar and galaxy spectra.
We have compared our cross-correlation results with results obtained with this method. We find that the radial velocity measurements are essentially unaltered. We also find that the patterns in the velocity dispersion maps remain the same. We do find a systematic difference in the velocity dispersion values obtained from the two methods but this difference varies from galaxy to galaxy. For example, for NGC 4051 there is no difference at all while for NGC 2273 we find the largest difference. This is illustrated in Fig. 2, where we compare the maps obtained with both techniques for NGC 2273. Note that the low dispersion ring (see discussion in Section 5.1) is clearly present in both maps, the only difference being that the values obtained with the direct pixel fitting method are larger by km s-1.
In order to investigate if this difference could be due to a template mismatch, we have performed velocity dispersion measurements using both techniques and a set of 28 stellar templates from the atlas of Cenarro et al. (2001). The stars were chosen to span a wide range of spectral types. For the cross-correlation technique the results did not vary much for template spectral types G, K and M. Nevertheless, as we moved to earlier spectral types the results began to vary but by simple visual inspection of these template spectra we verified that they are bad matches to the galaxy spectra. In the case of the direct pixel fitting method we made two tests. First we modeled each spectrum with a combination of all 28 templates, letting their proportions vary freely, thus accounting for variations in stellar populations (García-Rissmann et al., 2005). Then we repeated the fit using only our observed template star. The difference is negligible (at most a few km s-1), demonstrating that our kinematic measurements are not seriously affected by template mismatch.

4.4 Modeling of the radial velocity field
The radial velocity maps obtained from the measurements described above (see Fig. 3-8) show that a clear rotation pattern dominates the stellar kinematics. In order to obtain an analytical description of the radial velocity field, we have adopted a very simple approximation, assuming plane keplerian orbits for the stars, and representing the gravitational potential of the bulge by a Plummer potential:
| (2) |
which depends only on the scale length and bulge mass , and where is the radial distance in the plane of the galaxy.
We assume that the stars are in orbits close to a plane characterized by its inclination relative to the plane of the sky () and the position angle (PA) of the line of nodes . Although we do not expect that this simple approximation provides a robust determination of the bulge mass, inclination and bulge scale length, we can obtain reliable determination of the systemic velocity , PA of the line of nodes and the position of the kinematical centre.
Using the above potential, we calculate the rotation curve in the plane with coordinates of the origin . The 2D rotation curve is then projected onto the plane of the sky where the radial variable is now , the angular variable is and the correspondent scale length is . The relations between and , and between and are: and , where . The systemic velocity is added to the model as a zero point offset.
In summary, there are 7 free parameters to be determined by fitting the non-linear model
| (3) | |||||
to the data , what has been done using a Levenberg-Marquardt algorithm.
Before performing the fits, we have inspected the map of uncertainties in radial velocity generated by the cross-correlation routine, the individual spectra and the radial velocity maps in order to obtain an uncertainty threshold to discriminate between reliable data (or measurement) and noise. This threshold varied somewhat from galaxy to galaxy, ranging from 9 to 17 km s-1. Only reliable measurements were used in the data analysis and model fitting. The measurements considered unreliable have been masked in the velocity maps shown in Figs. 3-8.
The parameters obtained from the fits are shown in Table 3. The kinematical centre was used to calculate and where and are the coordinates of the centroid of the continuum brightness distribution.
| Galaxy | |||||||
|---|---|---|---|---|---|---|---|
| (km/s)a | (°) | (pc) | (pc) | () | (kpc) | (°) | |
| NGC 2273 | 1836 | 233.4 | -7 12 | -20 12 | 2.4 | 0.17 | 51 |
| NGC 3227 | 1201 | 149.7 | -2 9 | -10 9 | 1.4 | 0.11 | 43 |
| NGC 3516 | 2698 | 48.4 | -18 18 | 9 18 | 15 | 0.28 | 22 |
| NGC 4051 | 718 | 106.5 | 4 5 | 8 5 | 0.084 | 0.031 | 31 |
| NGC 4593 | 2531 | 88.5 | 1 17 | 4 17 | 18 | 0.41 | 25 |
| NGC 4941 | 1161 | -0.2 | 1 7 | -14 7 | 3.6 | 0.24 | 24 |
5 Results
In this section we present and discuss the kinematic measurements obtained from the spectra as well as the results of the modeling.
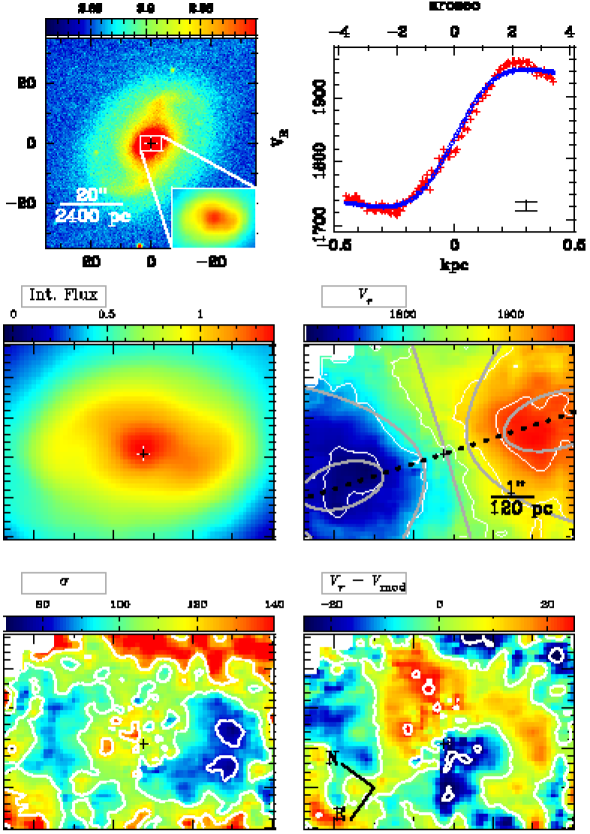
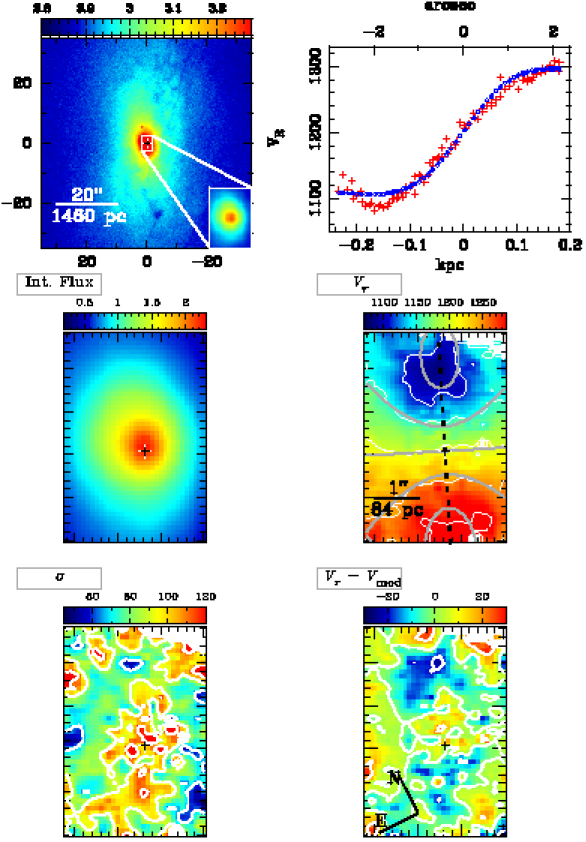
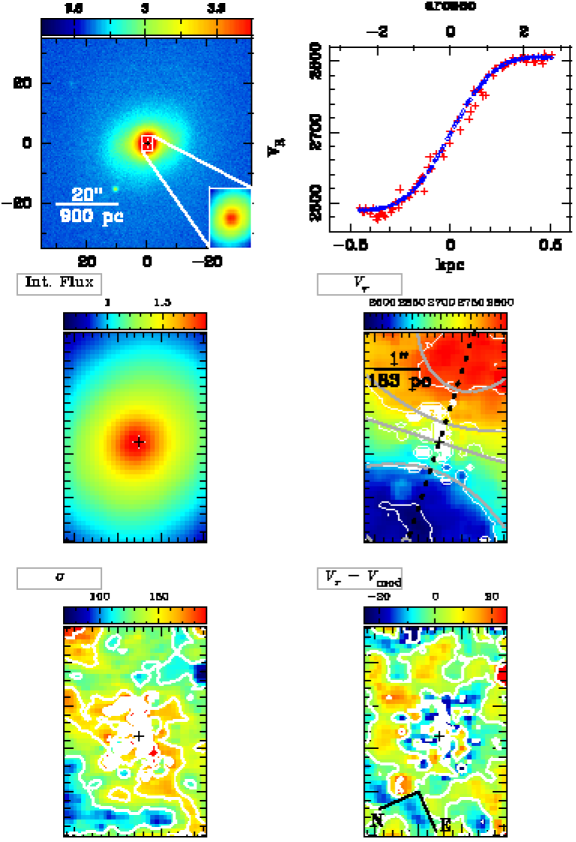
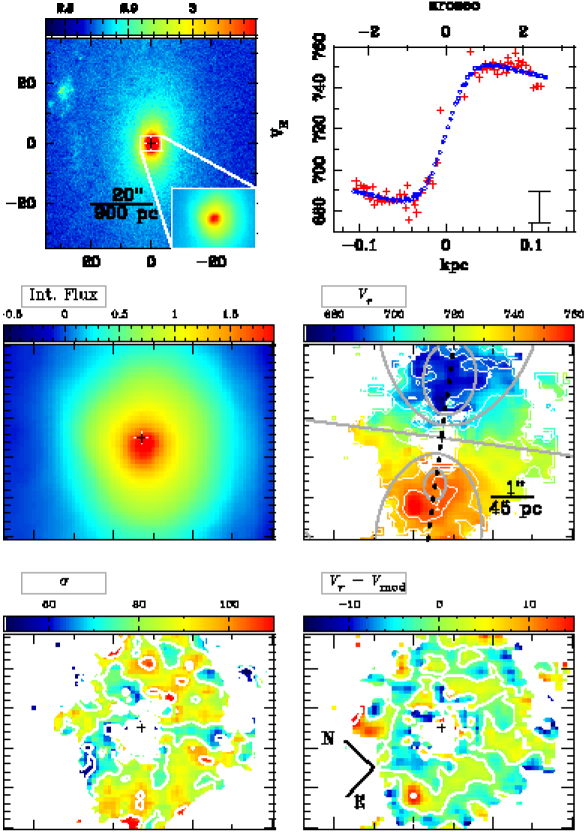
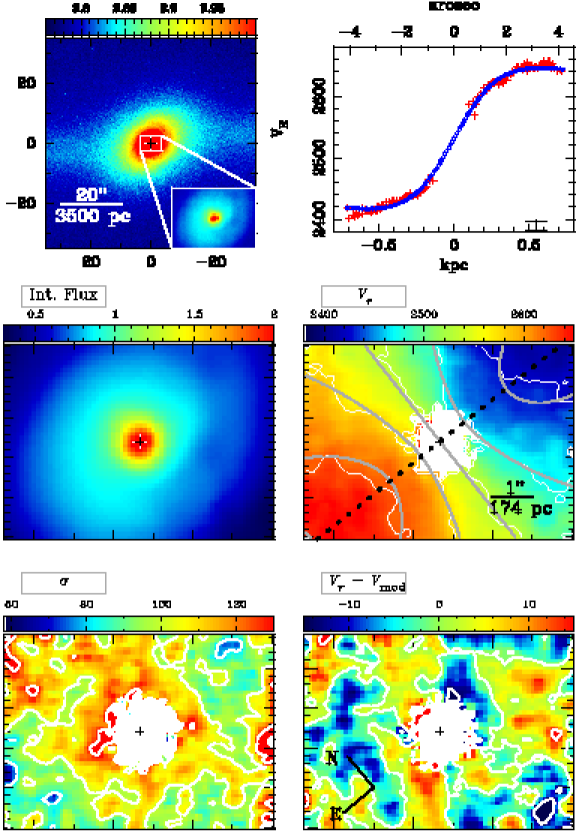
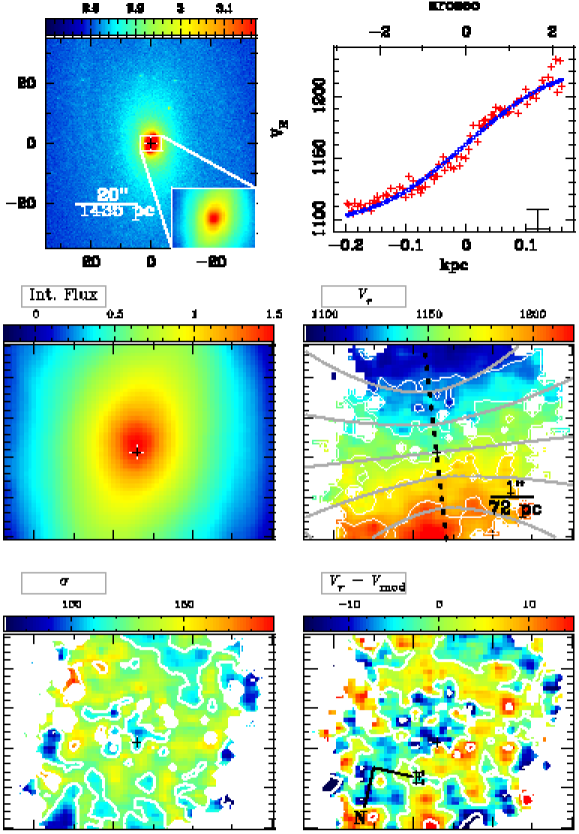
2D maps of the measurements, together with the acquisition image and residuals of the model fits for each galaxy, are presented in Figs. 3-8. Each figure comprises 6 panels, as described below.
-
1.
The top left panel shows a large scale I-band image with the IFU field drawn as a white box and the peak of the brightness distribution marked by the black cross. The small inset at the lower right corner details the morphology of the nuclear region covered by the IFU field.
-
2.
The top right panel shows the measured radial velocities (red crosses) along a virtual slit placed along the line of nodes and with width 06, together with the corresponding model values (blue circles), as a function of the projected distance from the nucleus222 Note that, due to the fact that the slit width includes more than one lens there may be more than one velocity value for each given radius at the slit, even for the model. . The error bar at the lower right corner represents the maximum uncertainty in the velocity values.
-
3.
The remaining panels show 2D maps of measured properties. The middle left panel shows the flux integrated over the wavelength range used in the cross-correlation measurements.
-
4.
The middle right panel shows the radial velocity map, with isovelocity contours superimposed; white contours correspond to the measurements, while grey contours correspond to the best fit model. The kinematic centre is identified by the black cross, and the line of nodes is indicated by the black dashed line.
-
5.
The bottom left panel shows the velocity dispersion map.
-
6.
The bottom right panel shows the residuals obtained from the subtraction of the kinematic model from the radial velocity map of panel (iii).
For display purposes, the kinematic maps of Figs. 3-8 have been interpolated over the original hexagonal array to generate a rectangular grid uniformly sampled, with pixel size . The scale (shown in panel (iii)) and orientation (shown in panel (v)) are the same for all the maps for a given galaxy.
Table 4 lists the velocity dispersions measured from the integrated nuclear spectra inside circular333Actually the combined spectra from all hexagonal elements with centres within the circular aperture radii. apertures with diameters 06 and 1″ for those galaxies with reliable nuclear data, as discussed in Section 3. Comparing our values with those from Nelson & Whittle (1995), we conclude that they are compatible given the uncertainties and our smaller apertures. The value given by Terlevich et al. (1990) for NGC 3516 is significantly larger than ours, but these authors also present higher values than those of Nelson & Whittle (1995) for other galaxies in common. For NGC 4051 and NGC 4593 the central velocity dispersions are unreliable due to the strong contribution from the AGN continuum.
| (06) | (1″) | (NW95) | Aperture | |
|---|---|---|---|---|
| (km/s) | (km/s) | (km/s) | (″) | |
| NGC 2273 | 104 | 105 | 136 22 | 1.5 x 1.4 |
| NGC 3227 | 114 | 109 | 128 13 | 1.5 x 2.1 |
| NGC 3516 | 192 | 178 | 235a | 2.1 |
| NGC 4051 | 85b | 88 13 | 1.5 x 2.1 | |
| NGC 4593 | 105b | 124 28 | 1.5 x 3.5 | |
| NGC 4941 | 138 | 136 | 109 13 | 1.5 x 2.1 |
We now discuss the results obtained for each galaxy.
5.1 NGC 2273
The radial velocity map (central right panel of Fig. 3) shows a rotation pattern which deviates from the classical spider diagram, evidenced by the fact that the observed kinematic minor and major axes are not perpendicular to each other, indicating deviations from axial symmetry. The residuals map show indeed deviations from the model above the noise level, which seem to be co-spatial with the star-forming ring (see discussion below).
The rotation curve (upper right panel of Fig. 3) along the kinematic major axis seems to have reached the turnover at only 250 pc from the nucleus. In addition, the data turnover seems to be more pronounced than that of the model, suggesting a more concentrated mass distribution.
The velocity dispersion map (bottom left panel of Fig. 3) presents a ring-like structure with values of about 60-80 km s-1 while in the centre the velocity dispersion reaches values of up to 100 km s-1. In Fig. 9 we present one-dimensional cuts of the velocity dispersion map along the major and minor axis of the galaxy which helps the visualization of the ring-like structure. This structure is co-spatial with the nuclear partial ring observed in the HST line emission images and color maps of Ferruit, Wilson & Mulchaey (2000). The lower velocity dispersion can be interpreted as a signature of recently formed stars, which still keep – at least partially – the kinematics of the gas from which they have been formed (Wozniak et al., 2003) and thus map the location of a starburst ring with semi-major axis of pc.

5.2 NGC 3227
Our radial velocity map (central right panel of Fig. 4) also shows a rotation pattern, where the redshifted side is to SE of the nucleus, in agreement with the H i radial velocity data of Schinnerer, Eckart & Tacconi (2000). The line of nodes PA obtained from the model () agrees within 4 with the values found by Mundell et al. (1995) and Schinnerer, Eckart & Tacconi (2000).
The residuals of the model fitting, shown in the bottom right panel of Fig. 4, are mostly below km s-1, except for two blueshifted regions approximately along the line of nodes, which deviate from the model by more than 20 km s-1. The rotation curve (upper right panel) suggests that to NW the turnover has been reached already at pc from the nucleus, while this does not happen to the SE.
The velocity dispersion map (bottom left panel of Fig. 4) is characterized by a nuclear region with above 100 km s-1 which drops in all directions but towards SE reaching values of km s-1 or less. The values increase again towards E, N and NW as evidenced in Fig. 10 by two one-dimensional cuts of the map. The loci of low regions have a good correspondence to the loci of high CO emission reported by Schinnerer, Eckart & Tacconi (2000) and referred to as a gas ring. In particular, the loci with the lowest velocity dispersions correspond to those with highest CO emission. The loci of low is also coincident with a ring of blue colour reported by Chapman et al. (2000). Although our FOV seems to be too small to clearly reveal the rise of beyond the ring in all directions, the coincidence of the low loci with both the CO and rings supports also the existence of a low ring structure in our data. As in the case of NGC 2273 our interpretation is that we are observing a ring of recent star formation where the low of the stars is due to the low velocity dispersion of the cool gas from which they have formed.

5.3 NGC 3516
The radial velocity map (central right panel of Fig. 5) shows a rotation pattern which seems to reach the turnover at the edge of the field, corresponding to a distance of 500 pc from the nucleus, as can be also seen in the rotation curve (top right panel of Fig. 5). The velocity field is in good agreement with the 2D velocity map of Arribas et al. (1997). The kinematic major axis orientation of also agree with the values found by these authors. The above value for is also the orientation of the photometric major axis obtained by fitting ellipses to the most external isophotes in the i′-band acquisition image (corresponding to an ellipse of semi-major axis ).
From the rotation curve in the top right panel of Fig. 5 we obtain a peak-to-peak amplitude in the velocity field of km s-1, significantly larger than the one measured by Arribas et al. (1997) (160 km s-1). This discrepancy can be understood if we recall that those authors applied a 15 smoothing to the data, which would flatten the rotation curve. We note that the peak-to-peak amplitude of the stellar rotation is well below the one obtained from the gas kinematics (592 km s-1), by Mulchaey et al. (1992).
Our velocity dispersion map (bottom left panel of Fig. 5) shows typical values in the central region larger than 150 km s-1 surrounded by a region with lower (as low as km s-1). From measurements of the Mg i b absorption band, Arribas et al. (1997) reported a central of km s-1 (within an aperture of 3″), which is consistent with our data, but a 2D distribution of line widths does not show any clear structure. In our data we can see lower values at locations surrounding the kinematic major axis direction at an average distance from the nucleus of pc.
The residuals from the radial velocity fit (bottom right panel of Fig. 5) are mostly within the adopted error of km s-1.
5.4 NGC 4051
In this galaxy the nuclear continuum and broad Ca-T emission lines preclude reliable measurements of the stellar kinematics using the Ca-T absorption lines within 05 from the nucleus. This region has thus been masked for the model fitting.
The radial velocity map (central right panel of Fig. 6) is dominated by the typical rotation pattern observed in all galaxies so far. The rotation curve (upper right panel of Fig. 6) has a peak-to-peak amplitude of only 130 km s-1 for an inclination of the galaxy (assuming where and are the major and minor axis photometric lengths obtained from NED) and the turnover seems to occur very close to the nucleus, at 50 pc.
The residuals from the model fit are within the km s-1 error limits (bottom right panel of Fig. 6) and do not show any well defined structure.
The velocity dispersion map (bottom left panel of Fig. 6), is also irregular with values ranging from a minimum of km s-1 to a maximum of km s-1. Nevertheless it was not possible to extend the measurements closer to the nucleus than , making it difficult to draw any conclusion on the distribution.
5.5 NGC 4593
For this galaxy, as for NGC 4051, the continuum from the Seyfert nucleus precludes reliable measurements of the stellar kinematics in the central region.
The radial velocity map (central right panel of Fig. 7) shows a clear rotation pattern in which the kinematical major axis runs approximately along E-W with the redshifted side to the E.
The peak-to-peak amplitude of the velocity field is 255 km s-1, but the rotation curve (top right panel of Fig. 7) suggests that the maximum velocity may occur beyond the edges of the observed FOV, which corresponds to pc from the nucleus along the kinematic major axis.
The velocity dispersion map (bottom left panel of Fig. 7) hints on a rise of the observed values towards the nucleus. At the most central but usable region we find values as high as 120 km s-1. At from the nucleus ( pc), the measured values drop to 80-90 km s-1, most notably along the kinematic major axis as in the case of NGC 3516. In the directions approximately perpendicular to the above the velocity dispersion is found to decrease slower, then rise again, reaching up to 130 km s-1 at the edges of the field. The map thus hints at the presence of a partial ring structure also for this galaxy. This is supported by the one-dimensional cuts along the major and minor axis of the velocity dispersion map shown in Fig. 11. Alternatively this region of low values can be associated with a tightly wound spiral arm which can be observed in an HST F547M image from Malkan, Gorjian & Tam (1998).

Gonzalez Delgado et al. (1997) have reported the presence of a broken starburst ring in an H narrow band imaging. But a comparison of our data with theirs shows that our low partial ring is nevertheless internal to their H ring.
The radial velocity residuals (bottom right panel of Fig. 7) are within the km s-1 error limits, but show some resemblance to the map, suggesting systematic departures from circular rotation in association with the apparent partial ring of lower velocity dispersion.
5.6 NGC 4941
A rotation pattern is again observed in the stellar kinematics (central right panel of Fig. 8). The rotation curve (top right panel of Fig. 8) indicates that the maximum amplitude is located beyond the observed region, which corresponds to a radial distance from the nucleus of only 200 pc for this galaxy.
The velocity dispersion map (bottom left panel of Fig. 8) is almost flat within 100 pc from the nucleus, with central values 135 km s-1, decreasing to 100 km s-1 at the edges of the field ( 200 pc).
The radial velocity residuals (bottom right panel of Fig. 8) are within the km s-1 error limit and show no obvious pattern.
6 Summary and Conclusions
In this work we have obtained 2D maps of the stellar kinematics of the inner few hundred parsecs of 6 nearby Seyfert galaxies at sub-arcsecond angular resolution, corresponding to spatial resolutions ranging from 30 to 180 parsecs at the galaxies.
The stellar velocity field is dominated by rotation, well represented by a simple model where the stars follow plane circular orbits under a Plummer potential. The residuals between measured and modeled radial velocities are always smaller than km s-1.
In most cases, the turnover of the rotation curve seems to occur within or close to the edges of the observed field, at radial distances ranging from pc for NGC 4051 to pc for NGC 3516 and NGC 4593. Only for NGC 4941, for which our observations reach only as far as pc from the nucleus, the turnover was not observed within the IFU FOV.
The case of NGC 4051 is particularly interesting because the turnover is at only pc from the nucleus, suggesting that the stellar motions are dominated by a highly concentrated gravitational potential. Indeed, the scale length of the Plummer potential obtained for this galaxy is the smallest of the the sample, pc. Adopting km s-1 for the nuclear velocity dispersion (the mean value of innermost usable pixels), and the Tremaine et al. (2002) relation, we infer a black hole mass of M⊙, which implies a sphere of influence of only pc radius. These values are consistent with those by Peterson et al. (2004), who obtained a black hole mass of M⊙ corresponding to a sphere of influence of pc radius. Such concentrated potential is unlikely to be responsible for the small potential-scale size we have found. A more likely interpretation is that the bulge is itself compact and concentrated. Indeed, unlike most Seyferts, this galaxy is late type (Scd), with a small bulge effective radius.
The velocity dispersion maps are featureless for NGC 4051 and NGC 4941. For the other galaxies the velocity dispersion maps show higher values at the centre and smaller values at pc from the nucleus. In the case of NGC 3516 the lowest values are observed towards the border of the IFU field, at location close to the kinematic major axis. For NGC 2273, the spatial distribution of lower values defines a ring-like morphology which is co-spatial with partial nuclear ring structures seen in line emission images and color maps of previous works. For NGC 3227, the velocity dispersion map shows a very good correspondence between the region of low values – which seems to delineates a partial ring structure – and regions of high 12CO (2-1) emission and blue colours observed in previous works. A partial ring of low values is also hinted in NGC 4593. As for the nuclear -drops found by previous authors (e.g. Emsellem et al. 2001; García-Lorenzo et al. 1999; Márquez et al. 2003) the circumnuclear -drops we found in the present study can be interpreted as regions of higher (past or present) gas concentration, harboring younger stars which still preserve the lower velocity dispersion of the original gas from which they have formed.
Acknowledgments
We thank the referee, Eric Emsellem, for useful suggestions which helped to improve the paper. We acknowledge support from the Brazilian funding agencies CNPq and CAPES, the US Naval Research Laboratory, where basic research is supported by the Office of Naval Research.
The PI is very grateful to Dr. Roberto Maiolino, Dr. Alessandro Marconi and the Arcetri group for the hospitality during his permanence at the Observatory of Arcetri where part of the work has been developed.
We thank also Natalia Vale Asari for helpful discussions.
Based on observations obtained at the Gemini Observatory, which is operated by the Association of Universities for Research in Astronomy, Inc., on behalf of the international Gemini partnership of Argentina, Australia, Brazil, Canada, Chile, the United Kingdom, and the United States of America (observing programmes GN-2002B-Q-15, GN-2003A-Q-20, and GN-2004A-Q-1).
We have used the Levenberg-Marquardt non-linear least squares algorithms from M.I.A. Lourakis available from http://www.ics.forth.gr/lourakis/levmar/.
References
- Andrillat & Souffrin (1968) Andrillat Y., Souffrin S., 1968, ApL, 1, 111
- Arribas et al. (1997) Arribas S., Mediavilla E., Garcia-Lorenzo B., del Burgo C., 1997, ApJ, 490, 227
- Barth et al. (2002) Barth A.J., Ho, L.C., Sargent W.L.W., 2002, AJ, 124, 2607
- Boisson et al. (2000) Boisson C., Joly M., Moultaka J., Pelat D., Serote Roos M., 2000, A&A, 357, 850
- Cappellari & Emsellem (2004) Cappellari M., Emsellem E., 2004, PASP, 116, 138
- Cenarro et al. (2001) Cenarro A.J., Cardiel N., Gorgas J., Peletier R.F., Vazdekis A., Prada F., 2001, MNRAS, 326, 959
- Chapman et al. (2000) Chapman S.C., Morris S.L., Walker G.A.H., 2000, MNRAS, 319, 666
- Cid Fernandes et al. (2001) Cid Fernandes R., Heckman T., Schmitt H., Delgado R.M.G., Storchi-Bergmann T., 2001, ApJ, 558, 81
- Cid Fernandes et al. (2005) Cid Fernandes R., González Delgado R.M., Storchi-Bergmann T., Martins L.P., Schmitt H., 2005, MNRAS, 356, 270
- Contini & Viegas (1999) Contini M., Viegas S.M., 1999, ApJ, 523, 114
- Devereux (1989) Devereux N.A., 1989, ApJ, 346, 126
- Emsellem et al. (2001) Emsellem E., Greusard D., Combes F., Friedli D., Leon S., Pécontal E., Wozniak H., 2001, A&A, 368, 52
- Emsellem et al. (2006) Emsellem E., Fathi K., Wozniak H., Ferruit P., Mundell C.G., Schinnerer E., 2006, MNRAS, 365, 367
- Erwin & Sparke (2003) Erwin P., Sparke L.S., 2003, ApJS, 146, 299
- Evans et al. (1996) Evans I.N., Koratkar A.P., Storchi-Bergmann T., Kirkpatrick H., Heckman T.M., Wilson A.S., 1996, ApJS, 105, 93
- Fernandez et al. (1999) Fernandez B.R., Holloway A.J., Meaburn J., Pedlar A., Mundell C.G., 1999, MNRAS, 305, 319
- Ferrarese & Merritt (2000) Ferrarese L., Merritt, D., 2000, ApJL, 539, L9
- Ferruit, Wilson & Mulchaey (2000) Ferruit P., Wilson A.S., Mulchaey J., 2000, ApJS, 128, 139
- Ganda et al. (2006) Ganda K., Falcón-Barroso J., Peletier R.F., Cappellari M., Emsellem E., McDermid R.M., Tim de Zeeuw P., & Carollo C.M., 2006, MNRAS, 367, 46
- García-Lorenzo et al. (1999) García-Lorenzo B., Mediavilla E., Arribas S., 1999, ApJ, 518, 190
- García-Rissmann et al. (2005) Garcia-Rissmann A., Vega L.R., Asari N.V., Cid Fernandes R., Schmitt H., González Delgado R.M., Storchi-Bergmann T., 2005, MNRAS, 359, 765
- Gebhardt et al. (2000) Gebhardt K., et al., 2000, ApJL, 539, L13
- Gonzalez Delgado & Perez (1997) Gonzalez Delgado R.M., Perez E., 1997, MNRAS, 284, 931
- Gonzalez Delgado et al. (1997) Gonzalez Delgado R.M., Perez E., Tadhunter C., Vilchez J.M., Rodriguez-Espinosa J.M., 1997, ApJS, 108, 155
- Ho & Ulvestad (2001) Ho L.C., Ulvestad J.S., 2001, ApJS, 133, 77
- Kotilainen, Ward & Williger (1993) Kotilainen J.K., Ward M.J., Williger G.M., 1993, MNRAS, 263, 655
- Kotilainen & Ward (1994) Kotilainen J.K., Ward M.J., 1994, MNRAS, 266, 953
- Kurtz & Mink (1998) Kurtz M.J., Mink D.J., 1998, PASP, 110, 934
- Lawrence et al. (1985) Lawrence A., Watson M.G., Pounds K.A., Elvis M., 1985, MNRAS, 217, 685
- Maiolino, Risaliti & Salvati (1999) Maiolino R., Risaliti G., Salvati M., 1999, A&A, 341, L35
- Malkan, Gorjian & Tam (1998) Malkan M.A., Gorjian V., Tam R., 1998, ApJS, 117, 25
- Márquez et al. (2003) Márquez I., Masegosa J., Durret F., González Delgado R.M., Moles M., Maza J., Pérez E., Roth M., 2003, A&A, 409, 459
- Meixner et al. (1990) Meixner M., Puchalsky R., Blitz L., Wright M., Heckman T., 1990, ApJ, 354, 158
- Miyaji, Wilson & Perez-Fournon (1992) Miyaji T., Wilson A.S., Perez-Fournon I., 1992, ApJ, 385, 137
- Mulchaey et al. (1992) Mulchaey J.S., Tsvetanov Z., Wilson A.S., Perez-Fournon I., 1992, ApJ, 394, 91
- Mulchaey & Regan (1997) Mulchaey J.S., Regan M.W., 1997, ApJL, 482, L135
- Mundell et al. (1995) Mundell C.G., Pedlar A., Axon D.J., Meaburn J., Unger S.W., 1995, MNRAS, 277, 641
- Nagar et al. (1999) Nagar N.M., Wilson A.S., Mulchaey J.S., Gallimore J.F., 1999, ApJS, 120, 209
- Nelson & Whittle (1995) Nelson C.H. Whittle M., 1995, ApJS, 99, 67
- Nelson & Whittle (1996) Nelson C.H., Whittle M., 1996, ApJ, 465, 96
- Oliva et al. (1995) Oliva E., Origlia L., Kotilainen J.K., Moorwood A.F.M., 1995, A&A, 301, 55
- Oliva et al. (1999) Oliva E., Origlia L., Maiolino R., Moorwood A.F.M., 1999, A&A, 350, 9
- Peterson et al. (2004) Peterson B.M., et al., 2004, ApJ, 613, 682
- Pogge (1989) Pogge R.W., 1989, ApJS, 71, 433
- Quillen et al. (1999) Quillen A.C., Alonso-Herrero A., Rieke M.J., Rieke G.H., Ruiz M., Kulkarni V., 1999, ApJ, 527, 696
- Regan & Mulchaey (1999) Regan M.W. Mulchaey J.S., 1999, AJ, 117, 2676
- Rodriguez Espinosa et al. (1996) Rodriguez Espinosa J.M., Perez Garcia A.M., Lemke D., Meisenheimer K., 1996, A&A, 315, L129
- Salvati et al. (1993) Salvati M., et al., 1993, A&A, 274, 174
- Schinnerer, Eckart & Tacconi (2000) Schinnerer E., Eckart A., Tacconi L.J., 2000, ApJ, 533, 826
- Schmitt & Kinney (1996) Schmitt H.R., Kinney A.L., 1996, ApJ, 463, 498
- Schmitt et al. (1999) Schmitt H.R., Storchi-Bergmann T., Fernandes R.C., 1999, MNRAS, 303, 173
- Schmitt et al. (2001) Schmitt H.R., Ulvestad J.S., Antonucci R.R.J., Kinney A.L., 2001, ApJS, 132, 199
- Singh (1999) Singh K.P., 1999, MNRAS, 309, 991
- Storchi-Bergmann et al. (2000) Storchi-Bergmann T., Raimann D., Bica E.L.D., Fraquelli H.A., 2000, ApJ, 544, 747
- Storchi-Bergmann et al. (2005) Storchi-Bergmann T., Nemmen R.S., Spinelli P.F., Eracleous M., Wilson A.S., Filippenko A.V., Livio M., 2005, ApJL, 624, L13
- Terlevich et al. (1990) Terlevich E., Diaz A.I. Terlevich R., 1990, MNRAS, 242, 271
- Tonry & Davis (1979) Tonry J.L. Davis M., 1979, AJ, 84, 1511
- Tremaine et al. (2002) Tremaine S., et al., 2002, ApJ, 574, 740
- Ulvestad & Wilson (1984) Ulvestad J.S., Wilson A.S., 1984, ApJ, 285, 439
- Veilleux (1991) Veilleux, S. 1991, ApJS, 75, 383
- Veilleux, Tully, & Bland-Hawthorn (1993) Veilleux S., Tully R.B., Bland-Hawthorn J., 1993, AJ, 105, 1318
- Weaver Gelbord & Yaqoob (2001) Weaver K.A., Gelbord J., Yaqoob T., 2001, ApJ, 550, 261
- Winkler et al. (1992) Winkler H., Glass I.S., van Wyk F., Marang F., Jones J.H.S., Buckley D.A.H., Sekiguchi K., 1992, MNRAS, 257, 659
- Wozniak et al. (2003) Wozniak H., Combes F., Emsellem E., Friedli D., 2003, A&A, 409, 469
- Young & Devereux (1991) Young J.S., Devereux N.A., 1991, ApJ, 373, 414