An upper limit to the photon fraction in cosmic rays above eV from the Pierre Auger Observatory
Abstract
An upper limit of 16% (at 95% c.l.) is derived for the photon fraction in cosmic rays with energies greater than eV, based on observations of the depth of shower maximum performed with the hybrid detector of the Pierre Auger Observatory. This is the first such limit on photons obtained by observing the fluorescence light profile of air showers. This upper limit confirms and improves on previous results from the Haverah Park and AGASA surface arrays. Additional data recorded with the Auger surface detectors for a subset of the event sample support the conclusion that a photon origin of the observed events is not favored.
1 Introduction
The origin of ultra-high energy (UHE) cosmic rays above eV is still unknown [1]. Their energy spectrum, arrival directions and composition can be inferred from air shower observations. However, agreement has not yet been reached on whether there is a break in the energy spectrum around eV (= 60 EeV). Such a steepening in the energy spectrum is expected if UHE cosmic rays come from cosmologically distant sources [2], as is suggested by their overall isotropy. There have been claims, as yet unconfirmed, for clustering on small angular scales, and correlations with possible classes of sources. Moreover, results concerning the nuclear composition are still inconclusive.
While this deficit of robust observational results is partly due to the extremely small fluxes and, correspondingly, small numbers of events at such high energies, discrepancies might arise also from the different experimental techniques used. For instance, the determination of the primary energy from the ground array alone relies on the comparison with air shower simulations and is thus prone to uncertainties in modelling high energy interactions. Therefore it is essential to test results from air shower observations independently. The present work provides just such a cross-check for the upper limit derived previously from ground arrays on the photon fraction in UHE cosmic rays. An upper limit is set on the photon fraction above 10 EeV which is twice as strong as those given previously.
Photons are expected to dominate over nucleon primaries in non-acceleration (“top-down”) models of UHE cosmic-ray origin [3, 4, 5] which have been invoked in particular to account for a continuation of the flux above without a spectral feature as indicated by AGASA data [6]. Thus, the determination of the photon contribution is a crucial probe of cosmic-ray source models. Separating photon-induced showers from events initiated by nuclear primaries is experimentally much easier than distinguishing light and heavy nuclear primaries. As an example, average depths of shower maxima at 10 EeV primary energy are predicted to be about 1000 g cm-2, 800 g cm-2, and 700 g cm-2 for primary photons, protons, and iron nuclei, respectively. Moreover, analyses of nuclear composition are uncertain due to our poor knowledge of hadronic interactions at very high energies. Photon showers, being driven mostly by electromagnetic interactions, are less affected by such uncertainties and can be modelled with greater confidence. To avoid the uncertainty from modelling hadronic interactions, we adopt an analysis method that does not require the simulation of nuclear primaries but compares data to photon simulations only.
So far limits on the UHE photon fraction in cosmic rays have been set by ground arrays alone. By comparing the rates of near-vertical showers to inclined ones recorded by the Haverah Park shower detector, upper limits (95% c.l.) of 48% above 10 EeV and 50% above 40 EeV were deduced [7]. Based on an analysis of muons in air showers observed by the Akeno Giant Air Shower Array (AGASA), the upper limits (95% c.l.) to the photon fraction were estimated to be 28% above 10 EeV and 67% above 32 EeV [8]. An upper limit of 67% (95% c.l.) above 125 EeV was derived in a dedicated study of the highest energy AGASA events [9].
In this work, we obtain a photon limit from the direct observation of the shower profile with fluorescence telescopes, using the depth of shower maximum as the discriminating observable. To achieve a high accuracy in reconstructing the shower geometry, we make use of the “hybrid” detection technique, i.e. we select events observed by both the ground array and the fluorescence telescopes [10]. For a subset of the event sample, a sufficient number of ground detectors were also triggered, yielding a variety of additional shower observables. Considering as example the signal risetime measured with the ground array, we demonstrate the discrimination power of these independent observables to photon-induced showers.
The plan of the paper is as follows. In Section 2, predictions for the UHE photon fraction in cosmic-ray source models and features of photon-initiated air showers are summarized. Section 3 contains the description of the data and of photon simulations. In particular, the data selection criteria are discussed. A careful choice of the quality and fiducial volume cuts is required to control a possible experimental bias for photon primaries. In Section 4, the method for deriving a photon fraction is described and applied to the data. An example of the discrimination power of observables registered by the surface array is shown in Section 5. Finally in Section 6, we discuss the prospects for improving the bound on UHE photons.
2 Photons as cosmic-ray primaries
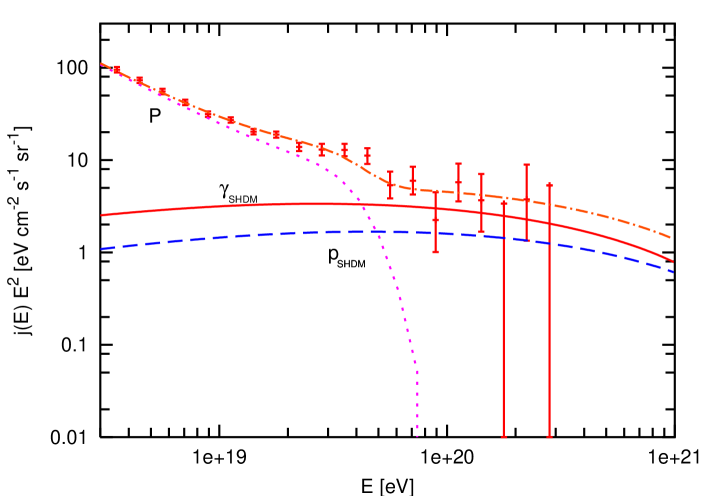
The theoretical challenge of explaining acceleration of protons to the highest energies is circumvented in non-acceleration models [3]. A significant fraction of the UHE cosmic rays are predicted by these models to be photons (see e.g. [4, 5]). For instance, UHE photons may be produced uniformly in the universe by the decay/annihilation of relic topological defects (TD) [11]. During propagation to Earth, they interact with background radiation fields and most of them cascade down to GeV energies where the extragalactic photon flux is constrained by the EGRET experiment; the remaining UHE photons can contribute to the cosmic-ray flux above 10 EeV. By contrast in the Super Heavy Dark Matter (SHDM) model [12], the UHE photons are generated in the decay of relic metastable particles (such as “cryptons” [13]) which are clustered as cold dark matter in our Galaxy. Since the halo is believed to be effectively transparent to such UHE photons, they would be directly observed at Earth with little processing. In the Z-Burst (ZB) scenario [14], photons are generated from the resonant production of Z bosons by UHE cosmic neutrinos annihilating on the relic neutrino background. A distinctive feature of all these models is the prediction of a large photon flux at high energies, as is expected from considerations of QCD fragmentation [15]. As an illustration, Figure 1 (taken from [5]) shows a SHDM model fit to the highest energy AGASA events; photons are the dominant particle species above eV.
Photons can also be produced in “conventional” acceleration models by the GZK-type process from decays. Typically, the corresponding photon fluxes are relatively small. For instance, based on the spectrum obtained by the HiRes experiment [16], the expected photon fraction is only of order 1% or below [5].
It should be noted that the photon flux arriving at Earth for a specific source model is subject to uncertainties arising from photon propagation: assumptions concerning the very low frequency (few MHz) radio background and inter-galactic magnetic fields must be made [4, 5]. The typical range of energy loss lengths usually adopted for photons are 7–15 Mpc at 10 EeV and 5–30 Mpc at 100 EeV.
Ultra-high energy photons can be detected by the particle cascades they initiate when entering the atmosphere of the Earth. Compared to air showers initiated by nuclear primaries, photon showers at energies above 10 EeV are in general expected to have a larger depth of shower maximum and to contain fewer secondary muons. The latter is because the mean free paths for photo-nuclear interactions and direct muon pair production are more than two orders of magnitude larger than the radiation length. Consequently, only a small fraction of the primary energy in photon showers is generally transferred into secondary hadrons and muons.
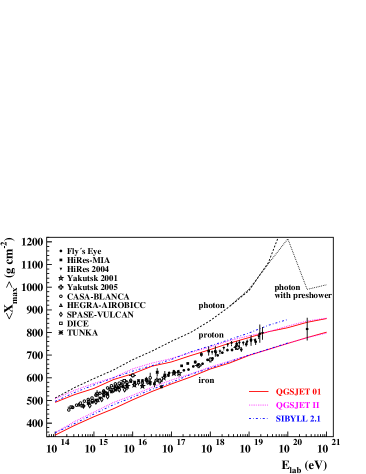
In Figure 2, simulated values for showers initiated by primary photons, protons and iron nuclei are shown as a function of the primary energy. The large values for photon showers at 10 EeV are essentially due to the small multiplicity in electromagnetic interactions, in contrast to the large number of secondaries produced in inelastic interactions of high-energy hadrons. Secondly, because of the LPM effect [21], the development of photon showers is even further delayed above 10 EeV. Another feature of the LPM effect is an increase of shower fluctuations: fluctuations for photon showers are 80 g cm-2 at 10 EeV, compared to 60 g cm-2 and 20 g cm-2 for primary protons and iron nuclei, respectively.
At higher energies, cosmic-ray photons may convert in the geomagnetic field and create a pre-shower before entering the atmosphere [22]. The energy threshold for geomagnetic conversion is 50 EeV for the Auger southern site. Conversion probability and pre-shower features depend both on primary energy and arrival direction. In the case of a pre-shower, the subsequent air shower is initiated as a superposition of lower-energy secondary photons and electrons. For air showers from converted photons, the values and the fluctuations are considerably smaller than from single photons of same total energy. From the point of view of air shower development, the LPM effect and pre-shower formation compete with each other.
In this work, cascading of photons in the geomagnetic field is simulated with the PRESHOWER code [23] and shower development in air, including the LPM effect [21], is calculated with CORSIKA [24]. For photo-nuclear processes, we assume the extrapolation of the cross-section as given by the Particle Data Group [25], and we employed QGSJET 01 [17] as a hadron event generator.
3 The Data Set
The Auger data used in this analysis were taken with a total of 12 fluorescence telescopes situated at two different sites [26], during the period January 2004 to February 2006. The number of surface detector stations deployed [27] grew during this period from about 150 to 950. A detailed description of the Auger Observatory is given in [28].
For the present analysis, we selected hybrid events, i.e. showers observed both with (one or more) surface tanks and telescopes. Even when only one tank is triggered, the angular accuracy improves from for observation with one telescope alone to 0.6∘ for hybrid detection [10, 29], thus reducing significantly the corresponding uncertainty in the reconstruction of .
The reconstruction of the shower profiles [26, 30] is based on an end-to-end calibration of the fluorescence telescopes [31]. Monthly models for the atmospheric density profiles are used which were derived from local radio soundings [32]. An average aerosol model is adopted based on measurements of the local atmospheric aerosol content [33]. Cloud information is provided by IR monitors, positioned at the telescope stations [33]. Cross-checks on clouds are obtained from measurements with LIDAR systems (near the telescopes) and with a laser facility near the center of the array [33, 34]. The Cherenkov light contribution of the shower is calculated according to [35]. An energy deposit profile is reconstructed for each event. A Gaisser-Hillas function [36] is fitted to the profile to obtain the depth of shower maximum, and the calorimetric shower energy is obtained by integration. It has been checked that this function provides a reasonable description of the simulated shower profiles independent of the primary particle, provided all four parameters of the Gaisser-Hillas fit are allowed to vary.
A correction for missing energy, the “invisible” energy fraction carried by neutrinos and high-energy muons, has to be applied. The fraction of missing energy depends on the primary particle type. In case of nuclear primaries, the correction amounts to 7–14%, with a slight dependence on primary energy and the hadronic interaction model used [37, 38]. For photon primaries, the missing energy fraction is much smaller and amounts to 1% [38]. We applied the correction assuming photon primaries, so that the energy threshold chosen in the analysis corresponds to the effective energy of primary photons.
For the current analysis, the differences between the energy estimates for different primaries are relatively small ( 10%) due to the near-calorimetric measurement of the primary energy by the fluorescence technique. Moreover, relative to photon showers, the energies of nuclear primaries are slightly underestimated. This would slightly deplete an event sample from showers ascribed to nuclear primaries or, correspondingly, increase the number ascribed to photons. Thus, the limit derived here for photons is conservative with respect to the missing energy correction. It seems worthwhile to mention that for ground array studies, where the energy of photons can be underestimated by more than 30% (see, for instance, [8]), such corrections to the primary energy which depend on the unknown primary particle type must be treated with particular caution.
The following quality cuts are applied for event selection (in Appendix A, distributions of cut variables are displayed):
-
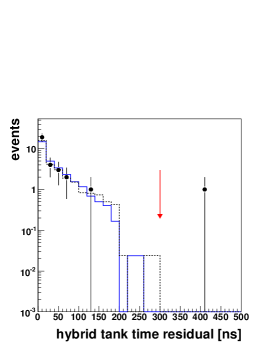
Quality of hybrid geometry: distance of closest approach of the reconstructed shower axis to the array tank with the largest signal 1.5 km, and difference between the reconstructed shower front arrival time at this tank and the measured tank time 300 ns;
-
Primary energy E1019 eV;
-
observed;
-
Number of phototubes in the fluorescence detector triggered by shower 6;
-
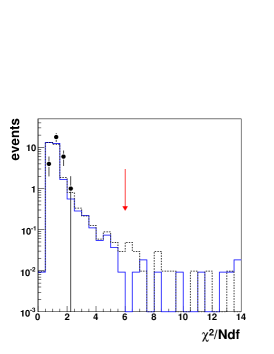
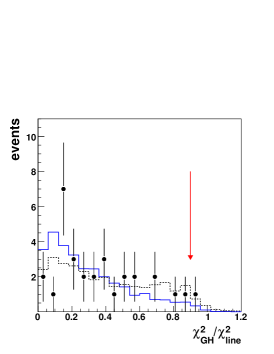
Quality of Gaisser-Hillas (GH) profile fit: (GH) per degree of freedom 6, and (GH)/(line)0.9, where (line) refers to a straight line fit;
-
Minimum viewing angle of shower direction towards the telescope 15∘;
-
Cloud monitors confirm no disturbance of event observation by clouds.
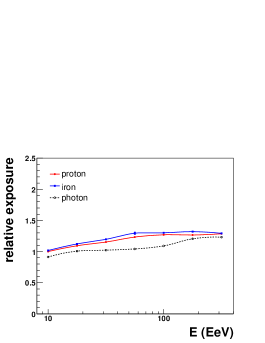
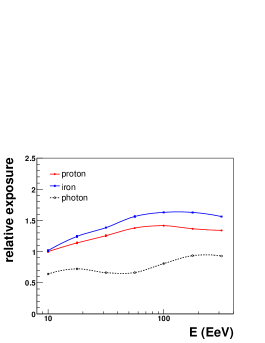
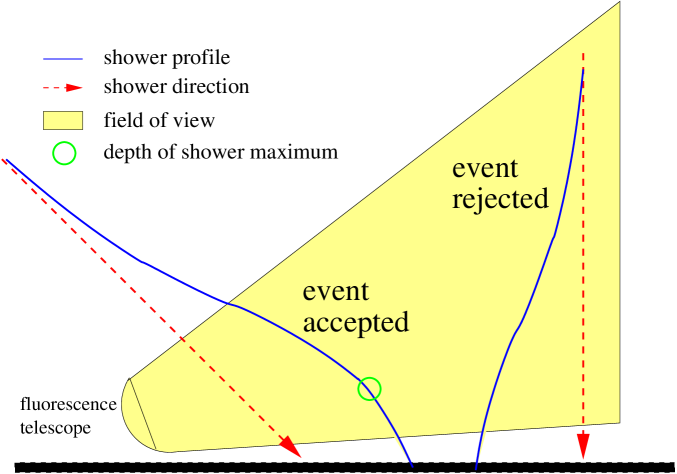
Care must be taken about a possible bias against photon primaries of the detector acceptance. In Figure 3 we show the acceptance for photons and nuclear primaries at different steps of the analysis, computed using shower simulations with the CONEX code [39] which reproduces well the CORSIKA predictions for shower profiles. Light emission and propagation through the atmosphere and the detector response were simulated according to [40]. As can be seen from the Figure, the acceptances are comparable for all types of primaries after trigger (top plot). However, after profile quality cuts (middle plot) the detection efficiency for photons is smaller by a factor 2 than for nuclear primaries, because primary photons reach shower maximum at such large depths (of about 1000 g cm-2, see Figure 2) that for a large fraction of showers the maximum is outside the field of view of the telescopes. This holds, in particular, for near-vertical photon showers: since the Auger Observatory is located at an average atmospheric depth of 880 g cm-2 (measured at a point close to the centre of the array) near-vertical photon showers reach the ground before being fully developed. Such photon showers are rejected by the quality cuts, while most of the showers generated by nuclear primaries (with their smaller ) are accepted. An illustration of the effect of this cut on photon showers is given in Figure 4. To reduce the corresponding bias against photons, near-vertical events are excluded in the current analysis. Since the average depth of shower maximum increases with photon energy before the onset of pre-shower, a mild dependence of the minimum zenith angle with energy is chosen (see below).
For similar reasons, a cut on distant events is introduced. The telescopes do not observe shower portions near the horizon, as the field of view is elevated by 1.5∘. Thus, the atmospheric depth which corresponds to the lower edge of the field of view of a telescope decreases with distance. Another source of a bias against photon showers is due to fluorescence light absorption. The brightest parts of the shower profile, i.e. those around shower maximum, are for photon showers generally closer to the ground. The line of sight towards the shower maximum traverses regions of higher air density. Hence, for similar geometrical distances to the shower maximum, the light signal of the deeper photon showers is more attenuated than for nuclear primaries. The consequence is that the distance range below which the telescopes are fully efficient for detecting showers of a given energy, is smaller for photon primaries than for nuclear primaries. This range increases with primary energy. Thus, an energy-dependent distance cut is applied for the data selection, in addition to excluding showers at small zenith angles:
-
Zenith angle 35, with eV for eV and for eV19.7;
-
Maximum distance of telescope to shower impact point 24 km + , with eV km.
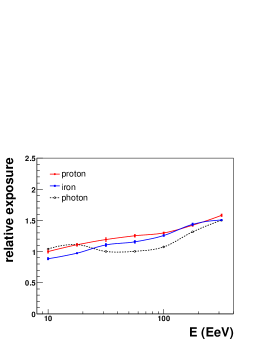
The acceptances after the fiducial volume cuts are applied are shown in Figure 3 (bottom plot). The differences between photons and nuclear primaries are now significantly reduced, with the acceptances being comparable at energies 10–20 EeV. With increasing energy, the acceptance for nuclear primaries shows a modest growth, while the photon acceptance is quite flat in the investigated energy range. Only a minor dependence on the nuclear particle type (proton or iron) is seen. Comparing photons to nuclear primaries, the minimum ratio of acceptances is at energies 50–60 EeV. At even higher energies, the pre-shower effect becomes increasingly important, and acceptances for photons and nuclear primaries become more similar.
The acceptance curves shown in Figure 3 can be used to correct for the detector acceptance when comparing a measured photon limit to model predictions, using the model energy spectra as an input. Since the acceptance ratios after the fiducial volume cuts are not far from unity, and since the photon acceptance is quite flat in the energy range below 100 EeV, the corresponding corrections are expected to be relatively small and to differ very little between typical model predictions. In this work, to obtain an experimental limit to the photon fraction without relying on assumptions on energy spectra of different primaries, a correction to the photon limit is applied by conservatively adopting the minimum ratio of acceptances (a detailed derivation of the approach is given in Appendix B).

Applying the cuts to the data, 29 events with energies greater than 10 EeV satisfy the selection criteria. Due to the steep cosmic-ray spectrum, many events in the sample do not exceed 20 EeV. The main shower characteristics are summarised for all events in Table 1. Figure 5 shows the longitudinal profile of an event reconstructed with 16 EeV and g cm-2. The distribution of the selected events is displayed in Figure 6.
| Event ID | Energy | ||||
|---|---|---|---|---|---|
| [x eV] | [g cm-2] | [g cm-2] | [g cm-2] | [std. dev.] | |
| 668949 | 17 | 765 | 985 | 71 | 2.9 |
| 673409 | 12 | 760 | 996 | 82 | 2.7 |
| 705583 | 11 | 678 | 973 | 77 | 3.6 |
| 737165 | 202 | 821 | 948 | 27 | 3.3 |
| 828057 | 13 | 805 | 978 | 68 | 2.4 |
| 829526 | 12 | 727 | 996 | 85 | 3.0 |
| 850018 | 54 | 774 | 1050 | 120 | 2.2 |
| 931431 | 24 | 723 | 1022 | 89 | 3.2 |
| 935108 | 14 | 717 | 992 | 68 | 3.8 |
| 986990 | 15 | 810 | 1000 | 87 | 2.1 |
| 1109855 | 16 | 819 | 1019 | 95 | 2.0 |
| 1171225 | 15 | 786 | 993 | 74 | 2.6 |
| 1175036 | 17 | 780 | 1001 | 100 | 2.1 |
| 1257649 | 10 | 711 | 971 | 76 | 3.2 |
| 1303077 | 13 | 709 | 992 | 85 | 3.1 |
| 1337921 | 18 | 744 | 1029 | 93 | 2.9 |
| 1421093 | 25 | 831 | 1028 | 93 | 2.0 |
| 1535139 | 15 | 768 | 998 | 77 | 2.8 |
| 1539432 | 12 | 787 | 975 | 76 | 2.3 |
| 1671524 | 13 | 806 | 978 | 77 | 2.1 |
| 1683620 | 20 | 824 | 1035 | 80 | 2.5 |
| 1683856 | 18 | 763 | 981 | 92 | 2.3 |
| 1684651 | 12 | 753 | 991 | 79 | 2.8 |
| 1687849 | 16 | 780 | 1001 | 71 | 2.9 |
| 1736288 | 10 | 726 | 981 | 71 | 3.3 |
| 1826386 | 17 | 747 | 994 | 84 | 2.8 |
| 1978675 | 10 | 740 | 978 | 76 | 2.9 |
| 2035613 | 11 | 802 | 998 | 90 | 2.1 |
| 2036381 | 27 | 782 | 1057 | 101 | 2.6 |
For the conditions of the highest-energy event in the sample, event 737165 (see also [41]) with a reconstructed energy of 202 EeV assuming primary photons, the probability of photon conversion in the geomagnetic field is 100%. Consequently, the simulated value of the average depth of shower maximum is relatively small, and shower fluctuations are considerably reduced.
It should be noted that the event list given in Table 1 results from selection criteria optimized for the current primary photon analysis. These data cannot be used for studies such as elongation rate measurements without properly accounting for acceptance biases. For instance, the minimum zenith angle required in this analysis depletes the data sample from showers with relatively small depths of shower maximum, with the effect being dependent on primary energy.

The uncertainty of the reconstructed depth of shower maximum is composed of several contributions, some of which may vary from event to event. In this work, we adopt conservative, overall estimates for the current statistical and systematic uncertainties which are applied to all selected events. These uncertainties are expected to decrease significantly in the future. However, even when adopting conservative estimates, the present analysis is not limited by the measurement uncertainties but by event statistics. This is due to the fact that shower fluctuations for photons are considerably larger than the measurement uncertainties.
Main contributions to are the uncertainties in the profile fit, in shower geometry and in atmospheric conditions (see Table 2). Uncertainties in the reconstruction from atmospheric conditions arise from using average models of the density profiles (monthly averages) and of the aerosol content. The effect on is studied by changing the atmospheric models and repeating the event reconstruction. The statistical uncertainty in the determination of the average model results in a systematic uncertainty of the reconstruction; it amounts to g cm-2 ( g cm-2 from density profiles, g cm-2 from aerosol model). A larger uncertainty comes from the spread around the averages due to time variations of atmospheric conditions (a detailed discussion of the density profile variations can be found in [32]). This results in a statistical uncertainty of the reconstructed value of g cm-2 ( g cm-2 from density profiles, g cm-2 from aerosol model).
An uncertainty in the values predicted from photon simulations results from the uncertainty in the reconstructed primary energy. Currently, the systematic uncertainty in energy is 25% [26]. For an elongation rate of 130 g cm-2 per energy decade for photons above 10 EeV, this corresponds to a systematic uncertainty of 13 g cm-2. The elongation rate for primary photons (see Figure 2) is relatively large here due to the LPM effect. At highest energies, the elongation rate decreases with the onset of photon pre-shower in the geomagnetic field.
It should be noted that this contribution to the systematic uncertainty from the energy reconstruction does not refer to the observed value itself. Rather, it enters indirectly in the analysis since the primary energy is needed as simulation input.
Another uncertainty comes from the extrapolation of the photo-nuclear cross-section to high energy. Larger values than adopted here for the cross-section would make showers initiated by photons more similar to nuclear primaries and reduce the predicted values for . Based on recent theoretical work on the maximum possible rise of the photo-nuclear cross-section with energy [42] an uncertainty of 10 g cm-2 is estimated for the predicted depths of shower maximum for photons [43].
Contrary to the case of nuclear primaries, uncertainties from modelling high-energy hadron interactions are much less important in primary photon showers. From simulations using different hadron event generators, an uncertainty of 5 g cm-2 is adopted.
Adding in quadrature the individual contributions (see Table 2) gives a statistical uncertainty 28 g cm-2 and a systematic uncertainty 23 g cm-2.
| Data | [g cm-2] | [g cm-2] |
| Profile fit | 20 | 10 |
| Atmosphere | 12 | 8 |
| Geometry reconstruction | 10 | 5 |
| Others | 10 | 5 |
| Simulation | ||
| Reconstructed energy of event | 5 | 13 |
| Photo-nuclear cross-section | - | 10 |
| Hadron generator | - | 5 |
| Total | 28 | 23 |
For each event, 100 showers were simulated as photon primaries. Since photon shower features can depend in a non-trivial way on arrival direction and energy, the specific event conditions were adopted for each event. Results of the photon simulations are also listed in Table 1.
4 Results
In Figure 7 the predictions for for a photon primary are compared with the measurement of g cm-2 for event 1687849 (Figure 5). With g cm-2, photon showers are on average expected to reach maximum at depths considerably greater than that observed for real events. Shower-to-shower fluctuations are large due to the LPM effect. For this event, the expectation for a primary photon differs by +2.9 standard deviations from the data, where is calculated from
| (1) |

For all events, the observed is well below the average value expected for photons (see Table 1). The differences between photon prediction and data range from +2.0 to +3.8 standard deviations, see Figure 8 and Table 1. It is extremely unlikely that all 29 events were initiated by photons (probability 10-10), so an upper limit to the fraction of cosmic-ray photons above 10 EeV can be reliably set.

Due to the limited event statistics, the upper limit cannot be smaller than a certain value. The relation between the minimum possible fraction of photons that could be excluded for a given number of events (or: the minimum number of events required to possibly exclude a fraction ) is given by
| (2) |
with being the confidence level of rejection. This holds for the case that no efficiency correction has to be applied (). For 29 events and , the minimum possible value for an upper limit to be set at a 95% confidence level is 12%. The theoretical limit is reached only if a photon origin is basically excluded for all events.
The calculation of the upper limit is based on the statistical method introduced in [9] which is tailor-made for relatively small event samples. For each event, trial values are calculated with according to Eq. (1). We distinguish between statistical and systematic uncertainties for the depths of shower maximum. The method in [9] is extended to allow for a correlated shift of the observed values for all selected events, where the shifted value is drawn at random from a Gaussian distribution with a width = 23 g cm-2. For the shifted data, new values are calculated from Eq. (1). Many such “shifted” event sets are generated from the data and compared to artificial data sets using photon simulations. The chance probability is calculated to obtain artificial data sets with values larger than observed as a function of the hypothetical primary photon fraction . Possible non-Gaussian shower fluctuations are accounted for in the method, as the probability is constructed by a Monte Carlo technique. The upper limit , at a confidence level , is then obtained from , where the factor accounts for the different detector acceptance for photon and nuclear primaries (Section 3).
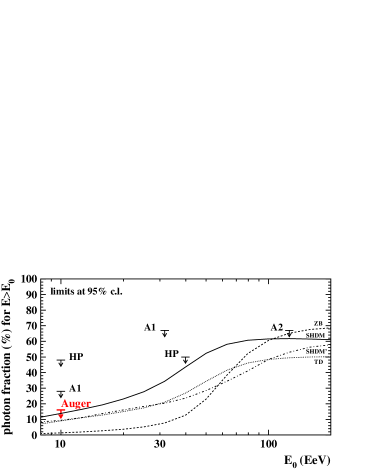
For the Auger data sample, an upper limit to the photon fraction of 16% at a confidence level of 95% is derived. In Figure 9, this upper limit is plotted together with previous experimental limits and some illustrative estimates for non-acceleration models. We have shown two different expectations for SHDM decay [5, 13] to illustrate the sensitivity to assumptions made about the decay mode and the fragmentation, as well as the normalisation of the spectrum (see Figure 1). The derived limit is the first one based on observing the depth of shower maximum with the fluorescence technique. The result confirms and improves previous limits above 10 EeV that came from surface arrays. It is worth mentioning that this improved limit is achieved with only 29 events above 10 EeV, as compared to about 50 events in the Haverah Park analysis and about 120 events in the AGASA analysis.
5 Discrimination power of surface array observables
In the current analysis, data from the surface array are used only to achieve a high precision of reconstructed shower geometry in hybrid events. A single tank was sufficient for this. However, observables registered by the surface array are also sensitive to the primary particle type and can be exploited for studies of primary photon showers. In spite of the incomplete coverage of the array during the data taking period considered here (which means many events were poorly contained), for about half of the selected events a standard array reconstruction [27] can be performed. Several observables can then be used for primary photon discrimination, for instance the lateral distribution or the curvature of the shower front [44].
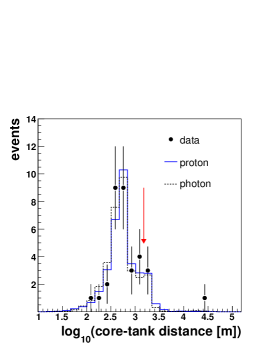
An example for another observable is given by the risetime of the shower signal in the detectors, one measure of the time spread of particles in the shower disc. For each triggered tank, we define a risetime as the time for the integrated signal to go from 10% to 50% of its total value. By interpolation between risetimes recorded by the tanks at different distances to the shower core, the risetime at 1000 m core distance is extracted after correcting for azimuthal asymmetries in the shower front. The risetime is sensitive to the primary particle type because of its correlation with shower muons and the depth of shower maximum: contrary to the shower muons, electrons undergo significant deflections with corresponding time delays. Thus, larger values for the risetime are observed if the signal at ground is dominated by the electromagnetic shower component. Primary photon showers generally have fewer muons and, additionally, the shower maximum is closer to ground compared to showers from nuclear primaries. Correspondingly, risetimes are expected to be relatively large for photon primaries.

For the specific event shown in Figure 5, the measured risetime is compared to the simulated distribution in Figure 10. For this and the other hybrid events with array reconstruction, the observed risetime does not agree well with the predictions for primary photons, supporting the conclusion that a photon origin of the observed events is not favored. In future photon analyses, the independent information on the primary particle from the Auger ground array and fluorescence telescope data can be used to cross-check each other. Combining the different shower observables will further improve the discrimination power to photons.
6 Outlook
The upper limit to the photon fraction above 10 EeV derived in this work from the direct observation of the shower maximum confirms and reduces previous limits from ground arrays. The current analysis is limited mainly by the small number of events. The number of hybrid events will considerably increase over the next years, and much lower primary photon fractions can be tested. Moreover, the larger statistics will allow us to increase the threshold energy above 10 EeV where even larger photon fractions are predicted by some models.
As an example, let us consider an increase in data statistics above 10 EeV by about an order of magnitude compared to the current analysis, as is expected to be reached in 2008/2009. From Eq. (2), a sensitivity to photon fractions down to 1.5% can be inferred. More realistically, let us assume for the measured values a distribution similar to the one currently observed as in Figure 8. Then, an upper limit of 5% could be achieved. With the increased run time, a comparable number of events as for the present analysis would be reached above 30–35 EeV. If an upper limit similar to that reached here was found, but at this higher energy, it would be well below existing limits and severely constrain non-acceleration models.111A 36% upper limit above 100 EeV has been claimed recently from combining AGASA and Yakutsk data [45]; however, the energies reconstructed for the AGASA events in that work are in conflict with those given by the AGASA group.
The sensitivity of the hybrid analysis might be further improved in the future by combining different shower observables measured in the same event, such as depth of shower maximum, risetime and curvature. We did not include ground array observables for the limit derived in this analysis since we wanted to independently check previous ground array results. Further information, e.g. the width of the shower profile, might also be added in future work to achieve better separation of deeply penetrating nuclear primaries and primary photons.
If only surface detector data is used and hybrid detection is not required then the event statistics are increased by about an order of magnitude. Care must however be taken about a possible bias against photons in an array-only analysis because of the different detector acceptance for photon and nuclear primaries. Also, compared to the near-calorimetric energy determination in the fluorescence technique, the energy estimated from array data shows a stronger dependence on the primary type and is more strongly affected by shower fluctuations. Ways to reduce a possible photon bias and to place robust limits to photons are being investigated. For instance, the technique introduced in [7] of comparing event rates of near-vertical and inclined showers can be further exploited.
Acknowledgements:
We are very grateful to the following agencies and organisations for financial support: Gobierno de Mendoza, Comisión Nacional de Energia Atómica y Municipalidad de Malargüe, Argentina; the Australian Research Council; Fundacao de Amparo a Pesquisa do Estado de Sao Paulo, Conselho Nacional de Desenvolvimento Cientifico e Tecnologico and Fundacao de Amparo a Pesquisa do Estado de Rio de Janeiro, Brasil; National Science Foundation of China; Ministry of Education of the Czech Republic (projects LA134 and LN00A006); Centre National de la Recherche Scientifique, Institut National de Physique Nucléaire et Physique des Particules (IN2P3/CNRS), Institut National des Sciences de l’Univers (INSU/CNRS) et Conseil Régional Ile de France, France; German Ministry for Education and Research and Forschungszentrum Karlsruhe, Germany; Istituto Nazionale di Fisica Nucleare, Italy; Consejo Nacional de Ciencia y Tecnologia, Mexico; the Polish State Committee for Scientific Research (grant numbers 1P03D 01430, 2P03B 11024 and 2PO3D 01124), Poland; Slovenian Research Agency; Ministerio de Educación y Ciencia (FPA2003-08733-C02, 2004-01198), Xunta de Galicia (2003 PXIC20612PN, 2005 PXIC20604PN) and Feder Funds, Spain; Particle Physics and Astronomy Research Council, UK; the US Department of Energy, the US National Science Foundation, USA, and UNESCO.
Appendix A Distributions of quality cut variables
In Figure 11, distributions of cut variables are plotted. For each graph, all quality cuts (see Section 3) except the one for the variable shown were applied.
Appendix B Acceptance correction
The fraction of photons in the cosmic-ray flux integrated above an energy threshold is given by
| (3) |
where denotes the differential flux of photons and the fluxes of nuclear primaries.
The fraction of photons as registered by the detector is given by
| (4) |
with and being the detector acceptances to photons and nuclear primaries, respectively. denotes the effective threshold energy for primary nucleus .
Thus, the upper limit obtained to the registered data, , needs to be corrected to resemble an upper limit to the fraction of photons in the cosmic-ray flux. For the present analysis, a conservative and model-independent correction is applied as follows.
corresponds to the analysis threshold energy assuming primary photons. is related to by the ratios of the missing energy corrections (for photons) and (for nuclear primaries),
| (5) |
Since and , . Thus, replacing by ,
| (6) |
In the last step, the acceptance ratio was introduced.
From the fiducial volume cuts shown in Figure 3, it can be seen that in the energy range of interest. Also, from Figure 3 the minimum acceptance ratio can be extracted (in the current analysis, ). Hence, it follows:
| (7) |
where it was used that .
Consequently, an upper limit to the fraction of photons in the cosmic-ray flux can conservatively be calculated as
| (8) |
The upper limit obtained this way does not depend on assumptions for the differential fluxes and .
References
- [1] M. Nagano, A.A. Watson, Rev. Mod. Phys. 72, 689 (2000); “Ultimate energy particles in the Universe”, eds. M. Boratav and G. Sigl, C.R. Physique 5, Elsevier, Paris (2004); J. Cronin, Nucl. Phys. B, Proc. Suppl. 138 (2005), 465.
- [2] K. Greisen, Phys. Rev. Lett. 16, 748 (1966); G.T. Zatsepin, V.A. Kuzmin, JETP Lett. 4 78 (1966).
- [3] P. Bhattacharjee, G. Sigl, Phys. Rep. 327, 109 (2000).
- [4] S. Sarkar, Acta Phys. Polon. B35, 351 (2004).
- [5] G. Gelmini, O.E. Kalashev, D.V. Semikoz, [arXiv:astro-ph/0506128].
- [6] M. Takeda et al., Astropart. Phys. 19, 447 (2003).
- [7] M. Ave et al., Phys. Rev. Lett. 85, 2244 (2000); Phys. Rev. D65, 063007 (2002).
- [8] K. Shinozaki et al., Astrophys. J. 571, L117 (2002).
- [9] M. Risse et al., Phys. Rev. Lett. 95, 171102 (2005).
- [10] Pierre Auger Collaboration, Proc. 29th Intern. Cosmic Ray Conf., Pune, 7, 369 (2005).
- [11] C.T. Hill, Nucl. Phys. B224, 469 (1983); M.B. Hindmarsh, T.W.B. Kibble, Rep. Prog. Phys. 58, 477 (1995).
- [12] V. Berezinsky, M. Kachelrieß, A. Vilenkin, Phys. Rev. Lett. 79, 4302 (1997); M. Birkel, S. Sarkar, Astropart. Phys. 9, 297 (1998).
- [13] J. Ellis, V. Mayes, D.V. Nanopoulos, [arXiv:astro-ph/0512303].
- [14] T.J. Weiler, Phys. Rev. Lett. 49, 234 (1982); T.J. Weiler, Astropart. Phys. 11, 303 (1999); D. Fargion, B. Mele, A. Salis, Astrophys. J. 517, 725 (1999).
- [15] Z. Fodor, S.D. Katz, Phys. Rev. Lett. 86, 3224 (2001); S. Sarkar, R. Toldra, Nucl. Phys. B621, 495 (2002); C. Barbot, M. Drees, Astropart. Phys. 20, 5 (2003); R. Aloisio, V. Berezinsky, M. Kachelrieß, Phys. Rev. D69, 094023 (2004).
- [16] R.U. Abbasi et al., Phys. Lett. B 619, 271 (2005).
- [17] N.N. Kalmykov, S.S. Ostapchenko, A.I. Pavlov, Nucl. Phys. B (Proc. Suppl.) 52B, 17 (1997).
- [18] S. Ostapchenko, Nucl. Phys. B (Proc. Suppl.) 151, 143 (2006).
- [19] R. Engel, T.K. Gaisser, P. Lipari, T. Stanev, Proc. 26th Intern. Cosmic Ray Conf., Salt Lake City, 415 (1999).
- [20] J. Knapp et al., Astropart. Phys. 19, 77 (2003).
- [21] L.D. Landau, I.Ya. Pomeranchuk, Dokl. Akad. Nauk SSSR 92, 535 & 735 (1953); A.B. Migdal, Phys. Rev. 103, 1811 (1956).
- [22] T. Erber, Rev. Mod. Phys. 38, 626 (1966); B. McBreen, C.J. Lambert, Phys. Rev. D 24, 2536 (1981); T. Stanev, H.P. Vankov, Phys. Rev. D 55, 1365 (1997).
- [23] P. Homola et al., Comp. Phys. Comm. 173, 71 (2005).
- [24] D. Heck et al., Reports FZKA 6019 & 6097, Forschungszentrum Karlsruhe (1998).
- [25] S. Eidelmann et al., Particle Data Group, Phys. Lett. B592, 1 (2004).
- [26] Pierre Auger Collaboration, Proc. 29th Intern. Cosmic Ray Conf., Pune, 7, 13 (2005), [arXiv:astro-ph/0508389].
- [27] Pierre Auger Collaboration, Proc. 29th Intern. Cosmic Ray Conf., Pune, 7, 1 (2005), [arXiv:astro-ph/0508466].
- [28] J. Abraham et al., P. Auger Collaboration, Nucl. Instrum. Meth. A 523, 50 (2004).
- [29] Pierre Auger Collaboration, Proc. 29th Intern. Cosmic Ray Conf., Pune, 7, 17 (2005).
- [30] Pierre Auger Collaboration, Proc. 29th Intern. Cosmic Ray Conf., Pune, 8, 343 (2005).
- [31] Pierre Auger Collaboration, Proc. 29th Intern. Cosmic Ray Conf., Pune, 8, 5 (2005), [arXiv:astro-ph/0507347].
- [32] Pierre Auger Collaboration, Proc. 29th Intern. Cosmic Ray Conf., Pune, 7, 123 (2005), [arXiv:astro-ph/0507275].
- [33] Pierre Auger Collaboration, Proc. 29th Intern. Cosmic Ray Conf., Pune, 8, 347 (2005).
- [34] Pierre Auger Collaboration, Proc. 29th Intern. Cosmic Ray Conf., Pune, 8, 335 (2005).
- [35] Pierre Auger Collaboration, Proc. 29th Intern. Cosmic Ray Conf., Pune, 7, 127 (2005), [arXiv:astro-ph/0507251]; M. Unger, in preparation (2006).
- [36] T.K. Gaisser, A.M. Hillas, Proc. 15th Intern. Cosmic Ray Conf., Plovdiv, 8, 353 (1977)
- [37] H.M.J. Barbosa et al., Astropart. Phys. 22, 159 (2004).
- [38] T. Pierog et al., Proc. 29th Intern. Cosmic Ray Conf., Pune, 7, 103 (2005).
- [39] T. Bergmann et al., Astropart. Phys., in print (2006), [arXiv:astro-ph/0606564].
- [40] L. Prado et al., Nucl. Instr. Meth. A545, 632 (2005).
- [41] Pierre Auger Collaboration, Proc. 29th Intern. Cosmic Ray Conf., Pune, 7, 283 (2005).
- [42] T.C. Rogers, M.I. Strikman, [arXiv:hep-ph/0512311].
- [43] M. Risse et al., Czech. J. Phys. 56 (2006) A327, [arXiv:astro-ph/0512434].
- [44] X. Bertou, P. Billoir, S. Dagoret-Campagne, Astropart. Phys. 14, 121 (2000).
- [45] G.I. Rubtsov et al., Phys. Rev. D 73, 063009 (2006).