The compact circumstellar material around OH 231.8+4.2111 Based on observations made with the VLT and the VLTI (Project numbers 065.L-0395, 072.D-0766 and 074.D-0405)
Abstract
We have observed the bipolar post-AGB candidate OH 231.8+4.2, using the mid-infrared interferometer MIDI and the infrared camera with the adaptive optics system NACO on the Very Large Telescope. An unresolved core (200 mas in FWHM) is found at the center of the OH 231.8+4.2 in the 3.8 m image. This compact source is resolved with the interferometer. We used two 8-meter telescopes with four different baselines, which cover projected baseline lengths from 62 to 47 meters, and projected position angles from 112 to 131 degrees that are almost perpendicular to the bipolar outflow. Fringes from 8 to 9 m and from 12 to 13.5 m were clearly detected, whilst the strong silicate self-absorption allows only marginal detection of visibilities between 9 and 12 m. The fringes from the four baselines consistently show the presence of a compact circumstellar object with an inner radius of 30–40 mas, which is equivalent to 40–50 AU at 1.3 kpc. This clearly shows that the mid-infrared compact source is not the central star (3 AU) but circumstellar material. The measured size of the circumstellar material is consistent with the size of such disks calculated by hydrodynamic models, implying the circumstellar material may have a disk configuration.
1 Introduction
Low and medium mass stars (1–8 on the main sequence) experience an intensive mass-loss phase during the Asymptotic Giant Branch (AGB) phase. Typically, the AGB wind is spherically symmetric. However, during the next evolutionary stages, i.e., the post-AGB phase and the planetary nebula (PN) phase, a high fraction of stars show asymmetric shapes in their circumstellar envelopes, such as elliptical and bipolar. One of the hypotheses about the formation of the bipolar shape invokes a binary disk scenario (Balick & Frank, 2002; Van Winckel, 2003). Part of the material lost during the intensive AGB mass-loss wind is trapped in the binary system, and a circumbinary disk is formed in the plane of the binary orbit. The disk restricts the direction of the low density but high velocity post-AGB and PN wind in the equatorial plane, and focuses the wind towards two poles. The size of the binary disk will be small (less than 100 AU (80 mas for our target); Mastrodemos & Morris, 1999), and so requires interferometric observations to be resolved.
OH 231.8+4.2 (catalog ) (IRAS 073991435; RA 07h42m16.83s Dec 14d42m52.1s; hereafter OH 231) is one of the well studied post-AGB candidates. TiO bands are detected from the central region, suggesting the central star exhibits a M9 spectral type (Cohen, 1981). Sánchez Contreras et al. (2004) claimed the presence of a spectroscopic binary from optical spectra, because in addition to TiO and VO bands from the M-type star, Balmer lines and continuum excess are detected. OH 231 is probably located in the open cluster, M 46 (Jura et al., 1985), thus the distance is relatively well determined (1.3 kpc).
The outflow is strongly bipolar, and bubbles and shocked regions are found in the outflow (e.g. Bujarrabal et al., 2002). L-, N- and Q-band seeing-limited images show an unresolved core at the center of this object (Kastner et al., 1992; Jura et al., 2002). The infrared color of this compact source is extremely red, and it is believed to be a dusty disk (Jura et al., 2002). The velocity structure of SiO masers also suggest the presence of a rotating disk around this compact source (Sánchez Contreras et al., 2002). The OH masers appear to be associated with an expanding torus (Zijlstra et al., 2001).
In this paper we present both high resolution infrared (IR) images and and mid-IR interferometeric visibilities of the central compact source, so as to resolve the compact source at the center and so as to determine if this source is a disk.
2 Observations and Analysis
OH 231 was observed with the MID-infrared Interferometric instrument (MIDI; Leinert et al., 2003) on the Very Large Telescopes (VLTs) on 2005 March 2nd (UT), using the telescopes Melipal and Yepun. The observing log is summarized in Table 1. From these observing runs, we also obtained acquisition images (single dish) with the adaptive optics (AO) system, spectro-photometric data, and visibilities (correlated fluxes) for each baseline.
The data reduction software packages MIA and EWS (Jaffe, 2004; Chesneau et al., 2005) were used to reduce the spectra and visibilities. To estimate errors in the visibility data the MIA visibilities were extracted with three different thresholds of noise level, and the difference in the visibilities between these thresholds are counted as errors. The difference between visibilities due to the choice of the calibration data was counted as a systematic error, and added to the errors derived above. The EWS visibilities are slightly higher than the MIA ones but well within error bars.
For spectro-photometry, we used Cohen et al. (1999)’s templates of HD 139127 (K4.5III) for HD 50778 (K4III) and of HD 180711 (G9III) for HD 61935 (G9III), and scaled the flux to IRAS 12 m measurements. The spectro-photometric error bars were estimated from eight calibrated spectra recorded.
We observed OH 231 with the AO system and the infrared camera NACO (Rousset et al., 2003; Lenzen et al., 2003) on theVLT on the 2004 March 6th (UT). The exposure time was 7.5 min for NB2.12 and 4.8 min (positive image only) for L’-band, respectively. Both filters measure continuum emission. The NB2.12 filter (=2.122 m and =0.022 m) is designed to detect H2 1–0 S(1) line, however, our spectroscopic observations using ISAAC/VLT show no detection of this line, and the NB2.12 band measured continuum emission, probably scattered light. We used the S27 and L27 cameras (a pixel scale of 27 mas). The central wavelength is 3.80 m and the width is 0.62 m for L’-band. The wave-front sensor was used in visible light provided by an AO reference star (=14.2 mag) approximately 35 arcsec away from the central compact object, giving a Strehl ratio of about 30 % at 2.12 m. An ND filter was used for the L’-band observations, which reduces the energy by 1.5–2 %. The jitterring technique was used to minimize the effect of hot pixels and the sky background was estimated from a medium of jitterred frames with different positions. A chopping technique was used during the L’-band observations with a throw of 10 arcsec to the east and the west.
MERLIN Phase-referenced observations of the 1667 MHz OH maser line have been obtained on the 2005 April 25th, using a velocity resolution of 0.7 km s-1. The observations covered the velocity range, from =20 to +80 km s-1. The angular resolution is about 0.2 arcsec. The data were reduced using AIPS. Velocity maps were obtained by calculating moment maps. The systemic velocity is about 35 km s-1 (Zijlstra et al., 2001).
3 Data description and interpretation
Fig. 1 shows NACO NB2.12 and L’-band images of OH 231. The central region is still obscured in NB2.12 image and the bipolar outflow is brighter. On the other hand, in L’-band the central region is brighter than the outflow. This shows that this central region has a very red color, because this region is obscured by extremely high optical depth and/or because it has a very cold temperature, as suggested by previous infrared observations (Kastner et al., 1992; Bujarrabal et al., 2002).
In the NB2.12-band image, the central region consists of patchy clouds (blobs) which were also seen in the near-infrared HST images (Bujarrabal et al., 2002; Meakin et al., 2003). A smooth 1 arcsec2 trapezium-shape cloud with a bright central core is found in the L’-band image (Fig. 1 (c)). This trapezium has an elongation towards the north-west direction. This shape resembles images at 11.7 and 17.9 m obtained with the Keck I (Jura et al., 2002).
Inside the trapezium cloud in the L’-band image, there is a bright point-like source. The NACO observations were unable to resolve the source, suggesting the source size arcsec2 (FWHM). This provides a more stringent limit than Jura et al. (2002), who reported an unresolved source with a dimension of arcsec2 at 11m. We also our MIDI single-dish acquisition images at 8.7m using the AO system (about 0.25 arcsec resolution) also did not resolve the bright point-like source.
Fig. 2 shows mid-infrared spectra of OH 231.8+4.2, obtained with MIDI. This spectrum shows the flux detected from the compact source only. There is a strong silicate absorption from 9–11 m, however, the flux is not completely zero and is 1 Jy. The silicate absorption band is broad for this source. Gillett & Soifer (1976) and IRAS LRS observations show 43 and 30 Jy at 8 m, respectively and Meixner et al. (1999) reported 25 Jy at 8.8 m, while our flux is 9 Jy at 8 m. Our spectra are from small core region (about 0.50.3 arcsec2), whereas other measurements for this object are from more extended regions, up to 25 arcsec2 (Jura et al., 2002). Variability at mid-infrared is known for this object (Jura et al., 2002) but is not the major reason of the flux discrepancy.
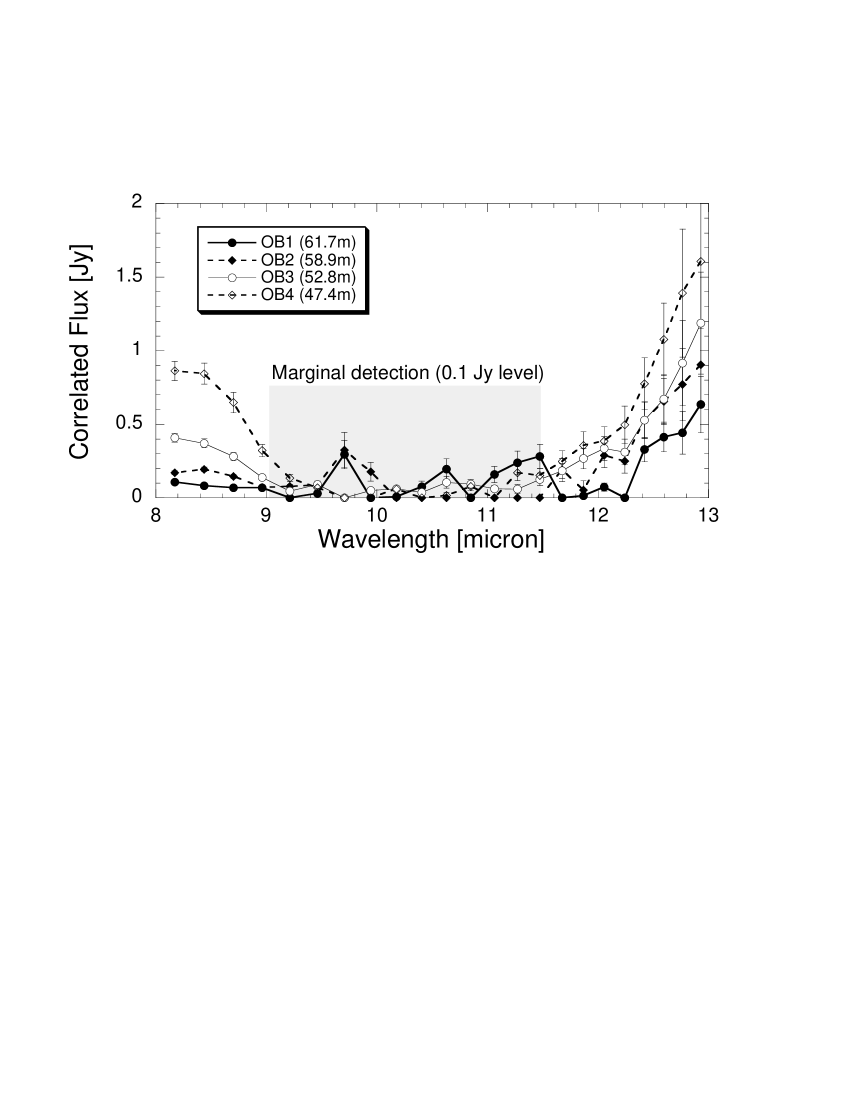
We detected fringes with MIDI from ‘the red and point-like source’ found in the near- and mid-infrared images. Fig. 3 shows the correlated flux obtained with MIDI. Correlated flux is clearly recorded below 9 m and above 11 m, but there is only a marginal detection (0.1 mJy) at 9–11 m. At the wavelength covering the silicate absorption, the visibilities are small, either because the flux level from this infrared source is too low or because the source is extended at this wavelength range.
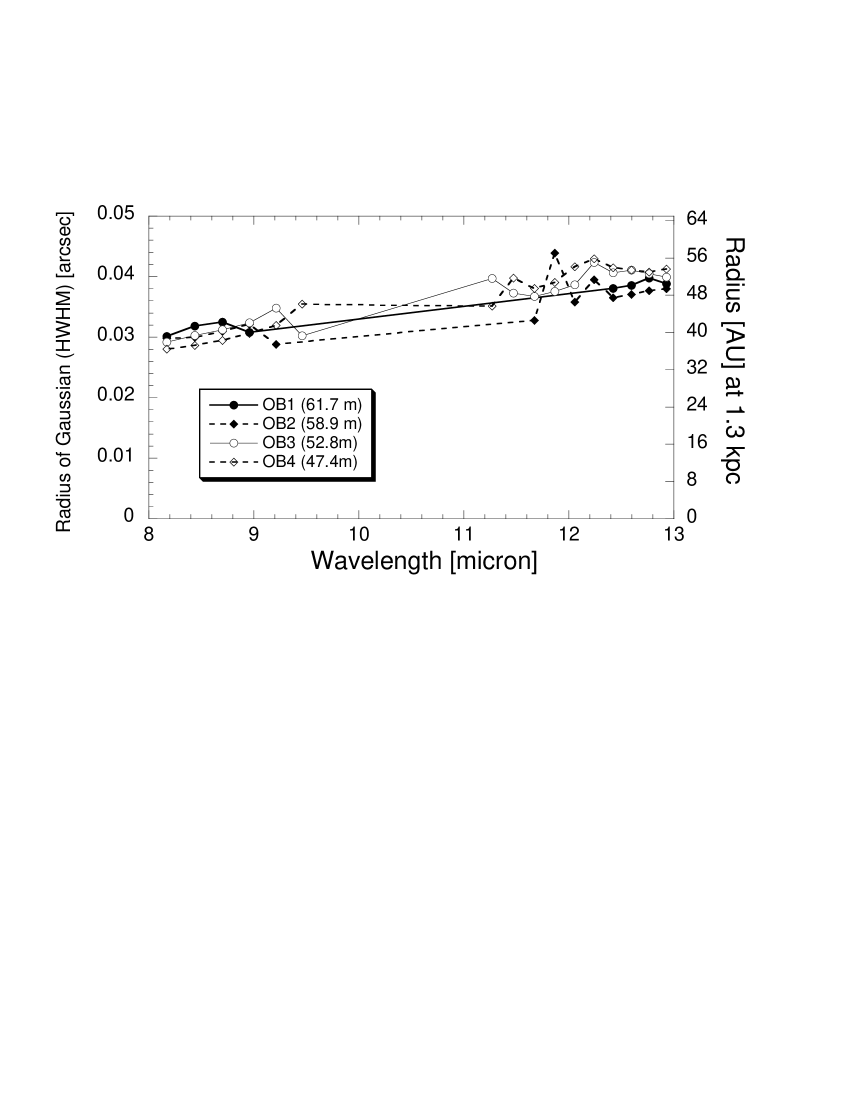
The visibility data are interpreted in the frame of a smooth Gaussian profile, as described by Leinert et al. (2004). The assumption of a Gaussian profile is appropriate if the object is optically thin or mildly optically thick. Fig. 4 shows radii for the Gaussian (given in terms of the ‘half’ width of the half maximum; HWHM) required to reproduce the observed visibilities at each wavelength. We clearly see that the structure is resolved on the 30–45 mas scale. At the distance of 1.3 kpc (Jura et al., 2002), the radii are about 40–50 AU, as displayed on the right side of the y-axis in Fig. 4.
The position angles of these four baselines vary by only 15 degrees. The observed differences in the correlated flux between the four baselines as seen in Fig. 3 are mainly due to the baseline length, rather than any asymmetry in the object. This is confirmed by the absence of a significant dependence of the Gaussian radii on the baseline lengths at each wavelength point (Fig. 4). These correlated fluxes are therefore resolving structures on scales of 60–80 mas in FWHM.
Fig. 1 (d) presents the velocity distribution of the 1667 MHz maser emission in m s-1 detected by MERLIN. The OH maser data are overplotted on the ISAAC/VLT L’-band image It shows a clear velocity gradient along the torus-like maser distribution. Only blue shifted velocities were detected by MERLIN.
4 Discussion
Our L’-band and N-band images using the AO system find an unresolved compact object in the center with dimension less than 200 mas. This object has a red color and consists of circumstellar material. This circumstellar material is responsible for the fringes detected by mid-infrared interferometer.
There are other emission mechanisms which can cause correlated flux in the mid-infrared, such as (1) the central star and (2) the central star + binary companion(s), but we can exclude these possibilities. First, the correlated flux of a single star with a radius 3 AU (Sánchez Contreras et al., 2002) at 1.3 kpc (2.3 mas) is almost 100 % of the total flux (i.e. unresolved) with current baseline lengths. The observed fringes indicate a much larger source size. Using the parameters of the central star from Jura et al. (2002) ( K, radius of cm), the flux of the central star is 6 Jy at 10 m, thus the correlated flux should also be 6 Jy on any baseline. The measured values are inconsistent with the expected correlated flux; the flux drops to 0.1–0.2 Jy for the longest baseline. Thus, the measured visibilities are not from the central star. Second, the silicate absorption is detected in correlated flux, which shows the circumstellar origin of the mid-infrared compact source. Although the presence of a binary companion has been suggested by Sánchez Contreras et al. (2004), it is unlikely that we measured the orbit of the binary companion around the central star, nor the radius of the binary companion. A sharp angular dependence of visibilities would be expected in the orbit case, which is not detected (Fig. 4). The possibility of the binary companion radius is ruled out because the flux would be 1 mJy level at 1.3 kpc if the companion is an A0V star (Sánchez Contreras et al., 2004). Therefore, the MIDI visibilities are due to dusty circumstellar material. The absence of stellar emission in the correlated flux suggests this material is still optically thick at 10 m.
Jura et al. (2002) analyzed the spectral energy distribution of this object and argued that the mid-infrared unresolved source is a disk. Sánchez Contreras et al. (2002) measured the velocity distribution of SiO maser lines. The SiO masers show the presence of a rotating disk, within 4 mas from the star. Zijlstra et al. (2001) find that OH velocity structure could be viewed as an expanding torus, with an additional component from a bipolar, ballistic outflow.
Our NACO images also suggest the presence of a disk or torus. The central region in the L’-band shows a trapezium shape: this may be interpreted as a flared outflow from a torus or a disk. The trapezium shape is also seen in the NB2.12 image. The small blobs seen in the trapezium cloud of NB2.12 image, is probably due to non-uniform extinction within the flared disk, or an illusion caused by scattered light. The north part of the ‘trapezium region’ is brighter than other regions in NB2.12, possibly because the disk is slightly inclined with the northern part nearer to the earth.
The obtained size of the dense circumstellar material is at least 40–50 AU. The optical depth from our preliminary analysis using DUSTY (Ivezić & Elitzur, 1997) suggests =1.6 and =2.7, showing the actual inner radius is smaller than the values which we measured. Nevertheless, if the density distribution is where –2, the optical depth increases dramatically for closer inner radii, and the measured size need not be that different from the actual inner radius of the dusty shell or torus. The hydrodynamic model of Mastrodemos & Morris (1999) shows that an accretion disk with a radius of 40–50 AU can be formed in a binary disk. The co-incidence of the radii from the theory and the observations implies that the circumstellar material is shaped as a disk or torus in this object.
On the other hand, Jura et al. (2002) assumed a binary companion with an orbit of 3– 5 AU for OH 231, and the inner radius of the disk might be larger than the companion orbit, which should be 5–9 AU. Our measured inner radius is much larger than Jura et al. (2002)’s assumption. This may be because the companion is actually further out than expected because the central star is larger than expected by Jura et al. (2002), or because our mid-infrared measurements observe the radius at which disk has cooled down enough to allow dust to condense out of the gas phase. An alternative solution could be that the disk is gradually expanding and losing momentum, and at the time of the formation, the disk could be much smaller than the current size. In conclusion, we measured the angular size of the circumstellar material in OH 231to be 40–50 AU, and this material is probably in a disk or toroidal configuration. Future MIDI observations with different baseline angles are required to confirm the presence of a disk like structure and to measure its inclination angle.
The OH masers are located to the south and east, within the darker lane seen in the L’-band image, and trace the waist of the trapezium, allowing for orientation effects. Only foreground (blue-shifted) OH is seen: the red emission appears to be more extended and is not picked up by the MERLIN interferometer, while the blue emission consist of more compact components. The velocity field shows a clear gradient in the southern part of the maser spots, with =20–30 km s-1 on the east and west edge and the bluest component (=10 km s-1) in the middle. It is inconsistent with an expanding torus, but is consistent if we observe the blue-shifted rim of a biconical outflow tilted towards us. Thus, the dynamics of the source change from a rotating disk in the very centre, within a few stellar radii, to a conical outflow at 1000 AU. The stellar position estimated by the the SiO maser tracing an equatorial rotating torus (Sánchez Contreras et al., 2002) coincides with the central position of the blue-shifted (0–5 km s-1) biconical distribution seen in OH.
All the components of the binary disk hypothesis (Balick & Frank, 2002; Van Winckel, 2003) may therefore be present in OH 231.8+4.2: a rotating SiO maser disk very close to the central star, a compact circumstellar material at 40–50 AU which may have a disk-like distribution, and a bipolar outflow.
References
- Balick & Frank (2002) Balick, B., & Frank, A., 2002, ARA&A 40, 439
- Bujarrabal et al. (2002) Bujarrabal, V., Alcolea, J., Sánchez-Contreras, C., & Sahai, R., 2002, A&A 389, 271, 2002
- Chesneau et al. (2005) Chesneau, O., Min, M., Herbst, T., et al., 2005, A&A 435, 1043
- Cohen (1981) Cohen, M., 1981, PASP 93, 288
- Cohen et al. (1985) Cohen M., Dopita M.A., Schwartz R.D., & Tielens A.G.G.M., 1985, ApJ 287, 702
- Cohen et al. (1999) Cohen, M., Walker R.G., Carter B., Hammersley P., Kidger M., & Noguchi K., 1999, AJ 117, 1864
- Gillett & Soifer (1976) Gillett F.C., & Soifer B.T., 1976, ApJ 207, 780
- Gómez & Rodríguez (2001) Gómez, Y., & Rodríguez, L.F. 2001, ApJ 557, L109
- Ivezić & Elitzur (1997) Ivezić, Z., & Elitzur, M., 1997, MNRAS 287, 799
- Jaffe (2004) Jaffe, W.J., 2004, SPIE 5491, 715
- Jura et al. (2002) Jura, M., Chen, C., & Plavchan, P., 2002, ApJ 574, 963
- Jura et al. (1985) Jura, M., & Morris, M., 1985, ApJ, 292, 487
- Kastner et al. (1992) Kastner, J.H., Weintraub, D.A., Zuckerman, B., Becklin, E.E., McLean, I., & Gatley, I., 1992, ApJ, 398, 552
- Leinert et al. (2003) Leinert Ch., et al., 2003, Msngr, 112, 13
- Leinert et al. (2004) Leinert Ch., et al., 2004, A&A 423, 537
- Lenzen et al. (2003) Lenzen R., et al. 2003, SPIE 4841, 944
- Mastrodemos & Morris (1998) Mastrodemos N., & Morris M., 1998 ApJ 497, 303
- Mastrodemos & Morris (1999) Mastrodemos N., & Morris M., 1999 ApJ 523, 357
- Meakin et al. (2003) Meakin C.A., Bieging J.H., Latter W.B., Hora J.L., & Tielens A.G.G.M., 2003 ApJ 585, 482
- Meixner et al. (1999) Meixner M., Ueta T., & Dayal A., 1999, ApJS 122, 221
- Rousset et al. (2003) Rousset, G., et al. 2003, SPIE 4839, 140
- Sánchez Contreras et al. (2002) Sánchez Contreras C., Desmurs J.F., Bujarrabal J., Alcolea J., & Colomer F., 2002, A&A 385, L1
- Sánchez Contreras et al. (2004) Sánchez Contreras C., de Paz, G., & Sahai, R., 2004, ApJ 616, 519
- Van Winckel (2003) Van Winckel, H., 2003, ARA&A, 41, 391
- Zijlstra et al. (2001) Zijlstra A.A., et al., 2001, MNRAS 322, 280
| OB | UT time | Airmass | Projected baseline | size | |
|---|---|---|---|---|---|
| Length | PA | ||||
| [meters] | [degrees] | [mas] | |||
| OB1 (OH 231) | 02:04–02:07 | 1.02 | 61.7 | 112.0 | |
| OB2 (OH 231) | 02:53–02:55 | 1.06 | 58.9 | 116.2 | |
| OB3 (OH 231) | 03:55–03:57 | 1.19 | 52.8 | 123.8 | |
| OB4 (OH 231) | 04:38–04:40 | 1.35 | 47.4 | 131.2 | |
| Calibrations | |||||
| Cal1 (HD 50778) | 02:29–02:31 | 1.11 | 56.2 | 117.8 | 3.760.04 |
| Cal2 (HD 61935) | 03:12–03:14 | 1.12 | 56.0 | 116.4 | 2.210.01 |
| Cal3 (HD 61935) | 04:14–04:16 | 1.30 | 48.3 | 123.8 | |