HCN and HNC mapping of the protostellar core Cha-MMS1 ††thanks: Based on observations collected at the European Southern Observatory, La Silla, Chile, and at the Parkes Observatory operated by the Australia Telescope National Facility (ATNF).
Abstract
Aims. The purpose of this study is to investigate the distributions of the isomeric molecules HCN and HNC and estimate their abundance ratio in the protostellar core Cha-MMS1 located in Chamaeleon i.
Methods. The core was mapped in the rotational lines of , , and . The column densities of , , and were estimated towards the centre of the core.
Results. The core is well delineated in all three maps. The kinetic temperature in the core, derived from the (1,1) and (2,2) inversion lines, is K. The / column density ratio is between 3 and 4, i.e. similar to values found in several other cold cores. The / column density ratio is . In case no 15N fractionation occurs in (as suggested by recent modelling results), the / abundance ratio is in the range , which indicates a high degree of 13C fractionation in . Assuming no differential 13C fractionation the and abundances are estimated to be and , respectively, the former being nearly two orders of magnitude smaller than that of . Using also previously determined column densities in Cha-MMS1, we can put the most commonly observed nitrogenous molecules in the following order according to their fractional abundances: .
Conclusions. The relationships between molecular abundances suggest that Cha-MMS1 represents an evolved chemical stage, experiencing at present the ’late-time’ cyanopolyyne peak. The possibility that the relatively high HNC/HCN ratio derived here is only valid for the 13C isotopic substitutes cannot be excluded on the basis of the present and other available data.
1Observatory, P.O. Box 14, FI-00014 University of Helsinki, Finland
2Julius Institute, Utrecht University, The Netherlands
3Max-Planck-Institut für Astronomie (MPIA), Königstuhl 17, 69117 Heidelberg, Germany
4Department of Astronomy of the Loránd Eötvös University, Pázmány Péter sétány 1, 1117 Budapest, Hungary
1 Introduction
Hydrogen cyanide, , and its metastable isomer hydrogen isocyanide, , are commonly used tracers of dense gas in molecular clouds. The column density has been observed to be similar or larger than that of in cold regions, whereas in warm GMC cores the [HNC]/[HCN] ratio is typically much smaller than unity (e.g., [Goldsmith et al. 1981]; [Churchwell et al. 1984]; [Irvine & Schloerb 1984]; [Schilke et al. 1992]; [Hirota et al. 1998]).
Gas-phase chemistry models, including both ion-molecule and neutral-neutral reactions, predict that the / abundance ratio should be close to unity in cold gas (see e.g. [Herbst et al. 2000], where also previous work is reviewed). The two isomers are thought to form primarily via the dissociative recombination of HCNH+, which in turn is produced by a reaction between and C+. The recombination reaction regulates the abundance ratio despite the initial production mechanisms of the two isomers, provided that they are efficiently protonated via reactions with ions, such as H and HCO+ ([Churchwell et al. 1984]; [Brown et al. 1989]). Recent theoretical studies corroborate the equal branching ratios for and in dissociative recombination ([Hickman et al. 2005]; [Ishii et al. 2006]).
/ column density ratios clearly larger than unity have been reported: [Churchwell et al. 1984] find that []/[] may be as high as in some dark clouds cores, and [Hirota et al. 1998] find a ratio of in L1498. The first result quoted is uncertain because it depends on the assumed degree of 13C fractionation in HNC, whereas the second value refers to and measurements. Nevertheless, both results suggest that the / chemistry is not fully understood. Further determinations of the relative abundances of these molecules towards cores with well-defined chemical and physical characteristics seem therefore warranted.
In this paper we report on observations of and and some of their isotopologues towards the dense core Cha-MMS1, which is situated near the reflection nebula Ced 110 in the central part of the Chamaeleon I dark cloud. We also derive the gas kinetic temperature in the core by using the (1,1) and (2,2) inversion lines of . Cha-MMS1 was discovered in the 1.3 mm dust continuum by [Reipurth et al. 1996], and was studied in several molecules by [Kontinen et al. 2000]. The object is embodied in one of the most massive ’clumps’ in Chamaeleon i identified in the large scale survey of [Haikala et al. 2005] (clump no. 3, ). [Reipurth et al. 1996] suggested that Cha-MMS1 contains a Class 0 protostar. A FIR source (Ced 110 IRS10) was detected near the centre of the core by [Lehtinen et al. 2001]. However, no centimetre continuum nor near-infrared sources have been found in its neighbourhood ([Lehtinen et al. 2003] and references therein), and the core therefore represents a very early stage of star formation. At the same time, its chemical composition has probably reached an advanced stage ([Kontinen et al. 2000]).
In Sect. 2 of this paper we describe the observations. In Sect. 3 we present the direct observational results in the form of spectra and maps, and derive the , , and column densities. By combining our results with previous observations we derive in Sect. 4 the fractional abundances of several nitrogen containing molecules in Cha-MMS1, and discuss briefly the chemical state of the core. In Sect. 5 we summarize our results.
2 Observations
The transitions of , , , and at about 90 GHz were observed with the Swedish-ESO-Submillimeter-Telescope, SEST, located on La Silla in Chile. The observations took place in December 1990. A 3 mm dual polarization Schottky receiver was used in the frequency switching mode. The backend was a 2000 channel acousto optical spectrometer with an 86 MHz bandwidth. The velocity resolution with this configuration is about at 90 GHz. Typical values for the single sideband system temperatures ranged from 350 K to 450 K. The half-power beam width of the SEST is about at the frequencies observed. Calibration was achieved by the chopper wheel method. Pointing was checked every 2-3 hours towards a nearby SiO maser source. We estimate the pointing accuracy to have been better than during the observations. The focusing was done using a strong SiO maser.
The (1,1) and (2,2) inversion lines of at about 23 GHz were observed with the Parkes 64-m radio telescope of the Australian Telescope National Facility (ATNF) in April 2000. The FWHM of the telescope is about at this frequency. The two lines were observed simultaneously in two orthogonal polarizations in the frequency switching mode, using the 8192 channel autocorrelator. The calibration was checked by observing standard extragalactic calibration sources at different elevations, and by comparing the ammonia line intensities towards some strong galactic sources also visible from the Effelsberg 100-m telescope, taking the different beam sizes into account.
The electric dipole moments of the molecules and the line
frequencies used in this paper are listed in
Table 1. Except for the frequencies of the
and hyperfine transitions adopted from
[Frerking et al. 1979], the parameters are obtained from the Jet
Propulsion Laboratory molecular spectroscopy data base
(http://spec.jpl.nasa.gov), where also the original references
are given. The hyperfine components of are not
listed. The frequencies given represent the centre frequencies of 18
and 21 individual components of the (1,1) and (2,2) lines,
respectively, distributed over a range of about 4 MHz.
| molecule | transition | |||
|---|---|---|---|---|
| (Debye) | (MHz) | |||
| 2.98 | 88630.416 | |||
| 88631.847 | ||||
| 88633.936 | ||||
| 2.98 | 86338.767 | |||
| 86340.184 | ||||
| 86342.274 | ||||
| 3.05 | 90663.656 | |||
| 90663.574 | ||||
| 90663.450 | ||||
| 2.70 | 87090.942 | |||
| 87090.859 | ||||
| 87090.735 | ||||
| 2.70 | 88865.715 | |||
| 1.48 | 23694.495 | |||
| 23722.633 | ||||
a http://spec.jpl.nasa.gov
b Frequencies from [Frerking et al. 1979]
3 Maps and column densities
3.1 Maps
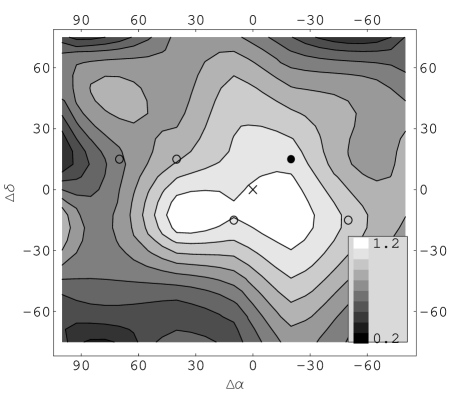
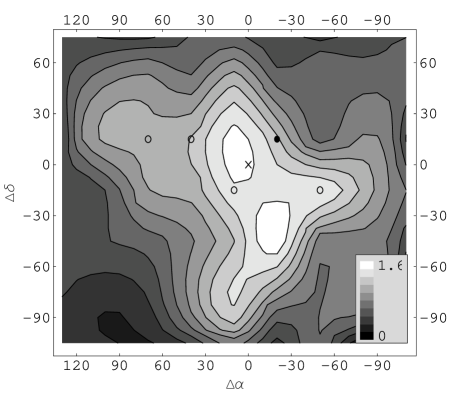
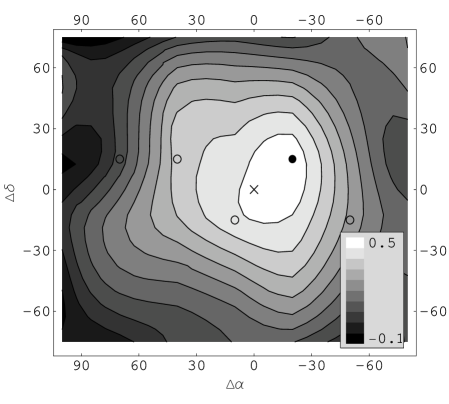
The integrated , and intensity maps of Cha-MMS1 are presented as contour plots in Figs. 1, 2 and 3, respectively. The values of the contour levels are given in the bottom right of each figure. The position of the 1.3 mm dust emission maximum, Cha-MMS1a ([Reipurth et al. 1996]), is chosen as the map centre. The coordinates of Cha-MMS1a are , . The grid spacing used in the maps was . Also indicated in these figures are the location of the maximum (, black dot), and the positions used for the () excitation temperature estimates in the LTE method (open circles, see below). Long integrations towards the maximum were made besides and also in the lines of and . The five spectra obtained towards this position are shown in Fig. 5.
The three maps have differences, but they all show a relatively compact distribution peaking near the position of Cha-MMS1. The emission with the lowest opacity reflects probably best the distribution dense gas.
3.2 LTE column densities
The column densities of the molecules have been determined with two different methods. First, we have derived the optical thicknesses of the lines and the total column densities of the molecules by assuming local thermodynamic equilibrium, LTE. The LTE method involves idealistic assumptions about the homogenity of the cloud. In the next subsection we present modelling of the observed spectra with a Monte Carlo program using a realistic density distribution.
In the following, we assume that the rotational levels of all five isotopologues are characterized by the same , and that the core is homogeneous, i.e. the same is valid for different locations. The former assumption can be justified by the similar dipole moments and rotational constants of the molecules. The second assumption infers that the excitation conditions remain constant along the line of sight and also between close-lying positions in the core.
The excitation temperature is derived by fitting first the optical thickness, , to the observed hyperfine ratios of a “clean” spectrum, i.e. a spectrum with a good S/N and hyperfine intensity ratios in accordance with the LTE assumption. The is solved from the antenna equation using observed peak main beam brightness temperature, and assuming uniform beam filling. The fit is possible towards the four positions listed in Table 2. In other positions with strong signal, like the maximum , or the maximum at the spectra show ’anomalous’ hyperfine ratios. The smallest error is obtained towards the offset () near the edge of the core with K. This spectrum is shown in Fig. 4. The other positions listed in Table 2 give similar values of but the errors are larger. Also column density estimates using the values for and obtained from hyperfine fits are given in Table 2.
| (′′) | (′′) | (K) | (kms-1) | (cm-2) | |
|---|---|---|---|---|---|
| 40 | 20 | ||||
| -50 | -10 | ||||
| 10 | -10 | ||||
| 70 | 20 |

The , , and column densities towards the maximum, , have been derived from the integrated line intensities and the estimate derived from the spectrum shown in Fig. 4. For the weakest of the well separated hyperfine components, , with the least optical thickness has been used in this calculation by taking its relative strength into account. For we did not attemp to do a similar estimate because the hyperfine components overlap and are very likely optically thick. Overlapping hyperfine components hamper also the column density estimate, but their optical thicknesses should be lower than those of by an order of magnitude or more. has no hyperfine structure due to zero nuclear spin of 15N. The results of these calculations are presented in Table 3.

| Molecule | ||
|---|---|---|
| () | () | |
| 0.370.03 | ||
| 1.170.03 | ||
| 0.190.03 | ||
| 0.520.02 | ||
| 0.070.01 |
The following column density ratios can be derived from Table 3:
The / column density ratio, 17, is much lower than the isotopic 12C/13C ratios usually observed in nearby molecular clouds or local diffuse ISM (, e.g. [Lucas & Liszt 1998]; the terrestrial value is 89), and is likely to be affected by absorption or scattering in the less dense envelope of the core. Radiative transfer effects are even more obvious in the case of the / intensity ratio, 1.7. We do not use therefore the values derived from the and spectra towards the core centre. The and spectra are discussed at the end of Sect. 4.
The ammonia column density, , and the gas kinetic temperature, , were derived using hyperfine fits to the inversion lines arising from the rotational states and . The spectra are shown in Fig. 6. The standard method of analysis described e.g. in [Ho et al. 1979] gave the following values: and K. Here it is assumed that the relative populations of all metastable levels of both ortho- and para- are determined by thermal equilibrium at the rotational temperature.

3.3 Monte Carlo modelling
, , and spectra were calculated with the Monte Carlo radiative transfer program of [Juvela 1997]. A constant kinetic temperature and a spherically symmetric density distribution, n, were assumed. The selected density power law conforms with observational results towards star-forming cores (e.g., [Tatematsu et al. 2004]). In order to avoid divergence in the cloud centre, we assume a constant density within a distance corresponding to 6% of the outer radius of the model cloud. Compared with the beam size, the constant density region is small and the results are not very sensitive to the selected value of its radius. The spectra were convolved with a gaussian that corresponds to the size of the beam used in the observations.The simulated spectra were fitted to observations by adjusting four parameters: the outer radius of the core, the scaling of gas density, and the fractional abundances of and . The fit was optimized for the weakest hyperfine component . The abundances of the other species were determined by assumed fixed ratios [12C]/[13C]=20, as suggested by the LTE column density determination, and [14N]/[15N]=280 (terrestrial). The resulting fractional and abundances do not, however, depend on these assumptions about isotopic ratios. The calculations were done with =12 K, which was derived from the ammonia observations, and =20 K.The lower temperature resulted in better fit although the difference in the values was no more than 25%. The results for the 12 K are shown in Fig. 7. The outer radius of the model is . The volume density increases from cm-3 at the outer edge to cm-3 in the centre, and the molecular hydrogen column density towards the centre is cm-2.
The fractional and abundances resulting from the fit are and , respectively. The / abundance ratio obtained from the simulations is thus 3.8, i.e. close to the value obtained from the LTE method.
The largest discrepancy between the observed and modelled profiles is seen in . It can be explained if the optical depth is larger than in this particular model. For example, a foreground layer of cold gas would readily decrease the intensity of the lines and would bring the ratios between the hyperfine components closer to the observed values. The hyperfine ratios are, however, sensitive to the actual structure of the source ([Gonzáles-Alfonso & Cernicharo 1993]).
The optical thickness of the main component is . This moderate value suggests that the method used in the previous subsection results in a slight underestimatation of column densities. The and column densities (fractional abundances multiplied by ) are indeed about two times larger than those presented in the previous section: , . These results suggest, however, that the LTE method does not lead to crude underestimates of the column densities of rarer isotopologues of HCN and HNC.

4 Discussion
4.1 Fractional abundances
The present observations and the LTE method give reasonable estimates for the column densities of , , and near the centre of Cha-MMS1. Unfortunately the column densities of the common isotopologues of and cannot be directly determined because of the large optical thickness of their lines. is, however, likely to be useful for this purpose. According to the modelling results of [Terzieva & Herbst 2000] hardly any 15N fractionation occurs in dense interstellar clouds. The isotopic 14N/15N ratio lies probably between 240 and 280, i.e. the values derived for the local ISM ([Lucas & Liszt 1998]), and the terrestrial atmosphere. Using this range and the column density listed in Table 3 we obtain . Assuming that no differential 13C fractionation occurs, we get from the / ratio derived above that .
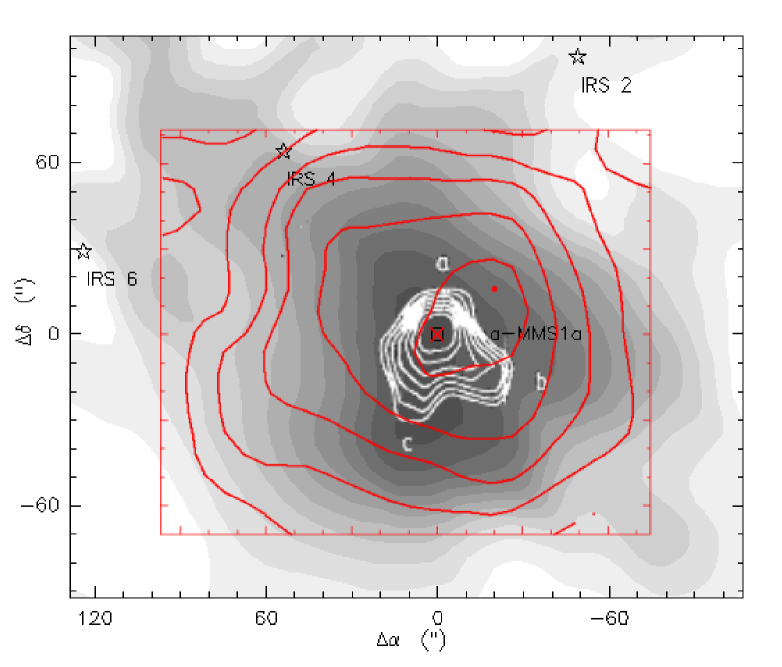
The dust continuum emission provides the most reliable estimate for the column density. [Reipurth et al. 1996] measured towards Cha-MMS1 a total 1.3 mm flux density of 950 mJy from a nearly circular region with a diameter of about (bordered by the lowest white contour in Fig. 8). As this size is similar to the SEST beamsize at 3 mm, the resulting average intensity and average can be compared with the column densities derived here. The dust temperature as derived from ISO observations by [Lehtinen et al. 2001] is 20 K (Cha-MMS1 = Ced 110 IRS10). Due to crowding of sources in this region and the limited angular resolution of ISOPHOT, this value may be affected by emission from other sources in its vicinity (see Fig. 2 of [Lehtinen et al. 2001]). Therefore, value 20 K is probably an upper limit. A lower limit is provided by the gas kinetic temperature K derived above. By using the two temperatures and Eq. (1) of [Motte et al. 1998] with g appropriate for circumstellar envelopes around Class 0 and Class I protostars, we get . The corresponding mass range of the dust core obtained from the total flux given by [Reipurth et al. 1996] is .
The median of the reasonable H2 column density range, , yields the following values for the fractional , and abundances: , , and . The column densities of two other nitrogen bearing molecules towards Cha-MMS1 were determined by [Kontinen et al. 2000]: , and , which imply the fractional abundances and .
We find that both and are about 100 times less abundant than , whereas is almost equally abundant as . The derived / column density ratio is in accordance with previous observational results (e.g., [Tafalla et al. 2002]; [Hotzel et al. 2004]). The abundance ratios are discussed in Sect. 4.3. The column density in this direction is ([Haikala et al. 2005]). The fractional abundance is therefore or smaller. This upper limit falls below the ’standard’ value of [Frerking et al. 1982], and suggests CO depletion.
4.2 Comparison with previous maps
The superposition of our map, the map of [Kontinen et al. 2000], and the 1.3 mm dust continuum map of [Reipurth et al. 1996] is shown in Fig. 8. The two molecular line maps have similar angular resolution (about ) whereas the resolution of the continuum map is . Both molecules show rather compact, symmetric distributions around the dust continuum source, agreeing slightly better with dust than . Nevertheless, the dense core can be clearly localized with the aid of as well as and . This is in contrast with SO, which shows two peaks on both sides of the core ([Kontinen et al. 2000]), and with C18O which has a flat distribution in this region ([Haikala et al. 2005]), probably due to depletion. This result agrees with the results of [Hirota et al. 2003] and [Nikolić et al. 2003], which suggest that and are less affected by the accretion onto dust grains than some other commonly observed molecules.
4.3 The chemical state of Cha-MMS1 and the HNC/HCN abundance ratio
CO depletion and a large abundance point towards an advanced stage of chemical evolution. The / abundance ratio agrees with model predictions for dense cores, but does not put severe constraints on the evolutionary stage ([Aikawa et al. 2005]). According to the observational results of [Hotzel et al. 2004] this value should be more appropriate for a star-forming than for a prestellar core. However, due to slightly different beamsizes the accuracy of the present determination of the / ratio is not sufficient for distinguishing between the two cases. [Kontinen et al. 2000] suggested that the large abundance observed in Cha-MMS1 indicates either a so called ’late-time’ cyanopolyyne peak associated with a large degree of depletion according to the model of [Ruffle et al. 1997], or carbon chemistry revival by the influence of a newly born, so far undetected star. A large ammonia abundance can be understood in either case. Ammonia production benefits from the diminishing of CO and can resist depletion longer (e.g. [Nejad & Wagenblast 1999]). On the other hand, ammonia can possibly form on grain surfaces and be released into the gas phase in shocks ([Nejad et al. 1990]; [Aikawa et al. 2003]). As there is no clear evidence for star-cloud interaction in Cha-MMS1, the alternative that the core - or the portion traced by the present observations - represents matured pre-stellar chemistry is more likely.
The behaviour of and under these circumstances is not clear. The main gas-phase production pathway via the HCNH+, which is effective especially at later stages, requires and C+ ions. The latter can be produced also in deep interiors of molecular clouds via the cosmic ray ionization of C atoms, or in the reaction between CO and the He+ ion, the latter mechanism becoming less important with CO depletion ([Nejad & Wagenblast 1999]). To our knowledge the production of and on interstellar grains and their desorption has not been studied.
The models of [Aikawa et al. 2005] for collapsing prestellar cores include the gas-phase production of , , , and . Although the order of fractional abundances, , and the / abundance ratio derived from the present observations are well reproduced by this model, especially for the gravity-to-pressure ratio impying a rapid collapse and less marked depletion, the predicted column densities relative to and are an order of magnitude larger than those observed here. A likely explanation is that is not as centrally peaked than and (see Fig. 3 of [Aikawa et al. 2005]). Therefore a large fraction of resides in on the outskirts of the core, where the density is not sufficient for the collisional excitation of its rotational levels, and the molecule is not seen in emission (see also the next section). Another discrepancy is that the model predicts much lower column densities relative to ammonia than observed here. The agreement is slightly better for the model with overwhelmingly large gravitational potential () than for the slowly evolving model near hydrostatic equilibrium () which results in very high degrees of depletion. Unfortunately the spectral resolution and S/N ratio of the present data do not allow to study the core kinematics.
As compared to the ’principal’ N-bearing molecules and , and have clearly smaller abundances, and probably only marginal importance to the nitrogen chemistry in the core. Nevertheless, the fact that / abundance ratio is once again observed to be larger than unity remains a problem. [Talbi & Herbst 1998] have shown that even though the reaction between and C+ may produce a significant amount of the metastable ion , which should produce only in electron recombination, the energy released in the former reaction leads to the efficient transformation into the linear isomer before the recombination. Likewise, according to [Herbst et al. 2000], the vibrational energies of and formed in the neutral reactions , and are sufficient to overcome the isomerization barrier, and roughly equal amounts of both isomers are produced.
The theoretical results presented in [Talbi & Herbst 1998] and [Herbst et al. 2000], and more recently by [Hickman et al. 2005] and [Ishii et al. 2006], show quite convincingly that the / abundance ratio resulting from the chemical reactions known to be effective in dark clouds cannot differ significantly from unity. There are two possible explanations for the discrepancy between the observations and theoretical predictions. Either so far unknown processes favour in the cost of , or then the derived / column density ratio is affected by different degrees of 13C fractionation in and . In the latter case 13C would about three times more enhanced in than in in Cha-MMS1.
The / column density ratio 7.4 together with the above quoted range of 14N/15N ratios imply that the / ratio in Cha-MMS1 is in the range . As the typical 12C/13C isotopic ratio observed in nearby clouds is 60 ([Lucas & Liszt 1998]) the result suggests considerable 13C enhancement in . An column density determination would readily show, according to the results of [Terzieva & Herbst 2000], whether also has a similar degree of 13C fractionation.
In the only survey so far including all these isotopologues, [Irvine & Schloerb 1984] found very similar / and / intensity ratios () towards TMC-1. This observation suggests similar 13C fractionation in and . On the other hand, this result might not be universally valid. [Ikeda et al. 2002] determined substantially different / column density ratios in the starless dark cloud cores L1521E, TMC-1, and L1498, listed in order of increasing / ratio (2.6, 6.7, and 11). The / column density ratios in these sources increase in the same order (0.54, 1.7, and 4.5; [Hirota et al. 1998]). The values obtained towards TMC-1 are consistent with those of [Irvine & Schloerb 1984], but the results towards L1521E and L1498 suggest (if the possibility of 15N fractionation is neglected) that the 13C fractionation in changes from source to source, and perhaps the variation in the case of is even larger. L1521E is suggested to represent youthful chemistry with little molecular depletion ([Hirota et al. 2002]; [Tafalla & Santiago 2004]) whereas the position observed in L1498 is known to be heavily depleted ([Willacy et al. 1998]). Thus, it appears that the freeze-out of molecules favour the 13C substituted isotopologues of and . It seems warranted to further examine the possibility of their differential 13C fractionation, although no theoretical arguments are in favour of different gas-phase production and destruction rates of and , or their different freezing rates. As no empirical data on this matter is currently available, the best way to proceed is probably to perform similar observations as those done by [Irvine & Schloerb 1984] towards a sample of cores with different degree of depletion.
4.4 Scattering envelope
The low / and / intensity ratios and the line shapes in the and spectra observed towards the centre of the core require some attention. The intensity ratios suggest very large optical thicknesses for the and lines, and consequently, deep self-absorption features and ’anomalous’ hyperfine component ratios are to be expected. A clear absorption feature can be seen in the simulated spectrum shown in Fig. 7, although a very low 12C/13C isotopic ratio is used in order to avoid inverted hyperfine ratios, which would disagree with the observations. The observed and spectra are, however, free from absorption dips, and they look more like weakened ’normal’ lines.
This weakening can probably be attributed to less dense gas surrounding the core. The and molecules in the envelope, where the density lies below the critical density of their lines, function as scatterers of line emission arising from the core, i.e. they re-emit absorbed photons (into random directions) before colliding with other particles. The effect is less marked for 13C isotopologues, and the resulting / and / intensity ratios decrease, without and loosing their characteristic line patterns. This model was used by [Cernicharo et al. 1984] to explain hyperfine anomalies, particularly the intesity of the intrinsically weakest component observed towards dark clouds. The spectrum shown in Fig. 5 conforms with this explanation: the component on the left is stronger than component on the right, although the optically thin LTE ratio is .
The scattering of emission from the core has probably lead to underestimation of the excitation temperature and column densities derived using the LTE method in Sect. 3.2. For example, an increase of 1 K in , would mean 30 % larger column densities, and 3 K would correspond to a 100% increase in the column density. Quantitative estimates of the scattering effects are, however, beyond the scope of this paper, and here we merely note this additional source of error.
5 Summary
A mapping in the rotational lines of , and shows a compact structure in the direction of the protostellar core Cha-MMS1. The map agrees best with the previous 1.3 mm dust continuum map of [Reipurth et al. 1996], and the map of [Kontinen et al. 2000].
The column density determinations of , , and , and the results of the quoted two studies allow us to estimate that the fractional and abundances are and , respectively. These are slightly larger than that of , but clearly smaller than the and abundances ( and , respectively). In accordance with recent results in other dense cores we find that is about 100 times more abundant than . The kinetic temperature derived from the lines is about 12 K. The derived fractional abundances conform with the previous suggestion of [Kontinen et al. 2000], that Cha-MMS1 represents an advanced chemical state, although it has a large abundance, which usually is thought to indicate early times. This situation is likely to have developed under the circumstances of CO depletion ([Ruffle et al. 1997]).
The following column density ratios are found: and . Using the latter ratio, and the assumption based on the modelling results of [Terzieva & Herbst 2000], we estimate that the []/[] ratio is between 30 and 40. As there is no column density determination available towards this source, the possibility that differential 13C fractionation causes the observed relatively high []/[] ratio cannot be entirely ruled out.
The and lines are not much brighter than those of the 13C substituted species, but still show no absorption dips. These lines are probably weakened by scattering by and molecules residing in less dense gas around the core. As suggested by [Cernicharo et al. 1984], the same process can cause the so called hyperfine anomalies in dark clouds, and is probably also responsible for the ’too’ bright component of HCN() towards the centre of Cha-MMS1. The evidence for scattering and the relatively low and column densities derived towards the core suggest that the and distributions are less centrally peaked than those of and , which would be in agreement with the model of [Aikawa et al. 2005] for a rapidly collapsing core.
We thank Wolf Geppert for useful discussions and the anonymous referee for valuable comments on the manuscript. This project was supported by the Academy of Finland, grant Nos. 173727 and 174854. P.P.T. thanks the ERASMUS programme of the European Union, Olga Koningfonds, Utrecht, and Kapteyn Fonds, Groningen.
References
- [Aikawa et al. 2003] Aikawa, Y., Ohashi, N., & Herbst, E. 2003, ApJ, 593, 906
- [Aikawa et al. 2005] Aikawa, Y., Herbst, E., Roberts, H., & Caselli, P. 2005, ApJ, 620, 330
- [Brown et al. 1989] Brown, R.D., Burden, F.R., & Cuno, A. 1989, ApJ, 347,855
- [Cernicharo et al. 1984] Cernicharo, J., Castets, A., Duvert, G., & Guilloteau, S. 1984, A&A, 139, L13
- [Churchwell et al. 1984] Churchwell, E., Nash, A. G., & Walmsley, C. M. 1984, ApJ, 287, 681
- [Frerking et al. 1982] Frerking, M. A., Langer, W. D., & Wilson, R. W. 1982, ApJ, 262, 590
- [Frerking et al. 1979] Frerking, M. A., Langer, W. D., & Wilson, R. W. 1979, ApJ, 232, L65
- [Goldsmith et al. 1981] Goldsmith, P.F., Langer, W.D., Ellder, J., Irvine W., & Kollberg E. 1981, ApJ, 249, 524
- [Gonzáles-Alfonso & Cernicharo 1993] Gonzalez-Alfonso, E., & Cernicharo, J. 1993, A&A, 279, 506
- [Haikala et al. 2005] Haikala, L. K., Harju, J., Mattila, K., & Toriseva M. 2005, A&A, 431, 149
- [Herbst et al. 2000] Herbst, E., Terzieva, R., & Talbi, D. 2000, MNRAS, 311, 869
- [Hickman et al. 2005] Hickman, A.P., Miles, R.D., Hayden, C., Talbi, D. 2005, A&A, 438, 31
- [Hirota et al. 1998] Hirota, T., Yamamoto, S., Mikami, H., & Ohishi, M. 1998, ApJ, 503, 717
- [Hirota et al. 2002] Hirota, T., Ito, T, & Yamamoto, S. 2002, ApJ, 565, 359
- [Hirota et al. 2003] Hirota, T., Ikeda, M., & Yamamoto, S. 2003, ApJ, 594, 859
- [Ho et al. 1979] Ho, P. T. P., Barrett, A. H., Myers, P. C., et al. 1979, ApJ, 234, 912
- [Hotzel et al. 2004] Hotzel, S., Harju, J., & Walmsley, C.M. 2004, A&A, 415, 1065
- [Ikeda et al. 2002] Ikeda, M., Hirota, T., Yamamoto, S. 2002, ApJ 575, 250
- [Irvine & Schloerb 1984] Irvine, W. M. & Schloerb, F. P. 1984, ApJ, 282, 516
- [Ishii et al. 2006] Ishii, K., Tajima, A., Taketsugu, T., Yamashita, K. 2006, ApJ 636, 927
- [Juvela 1997] Juvela, M. 1997, A&A, 322, 943
- [Kontinen et al. 2000] Kontinen, S., Harju, J., Heikkilä, A., & Haikala, L. K. 2000, A&A, 361, 704
- [Lehtinen et al. 2001] Lehtinen, K., Haikala, L. K., Mattila, K., & Lemke, D. 2001, A&A, 367, 311
- [Lehtinen et al. 2003] Lehtinen, K., Harju, J., Kontinen, S., & Higdon, J.L. 2003, A&A, 401, 1017
- [Lucas & Liszt 1998] Lucas, R. & Liszt, H. 1998, A&A, 337, 246
- [Motte et al. 1998] Motte, F., Andre, P., & Neri, R. 1998, A&A, 336, 150
- [Nejad & Wagenblast 1999] Nejad, L. A. M. & Wagenblast, R. 1999, A&A, 350, 204
- [Nejad et al. 1990] Nejad, L. A. M., Williams, D. A., & Charnley, S. B. 1990, MNRAS, 246, 183
- [Nikolić et al. 2003] Nikolić, S., Johansson, L.E.B., & Harju, J. 2003, A&A, 409, 941
- [Rawlings et al. 2002] Rawlings, J. M. C., Hartquist, T. W., Williams, D. A., & Falle, S. A. E. G. 2002, A&A, 391, 681
- [Reipurth et al. 1996] Reipurth, B., Nyman, L.-A., & Chini, R. 1996, A&A, 314, 258
- [Ruffle et al. 1997] Ruffle, D. P., Hartquist, T. W., Taylor, S. D., & Williams, D. A. 1997, MNRAS, 291, 235
- [Schilke et al. 1992] Schilke, P., Walmsley C.M., Pineau des Forêts, G., Flower, D., Guilloteau, S. 1992, A&A 256, 595
- [Talbi & Herbst 1998] Talbi, D. & Herbst, E. 1998, ApJ
- [Tafalla & Santiago 2004] Tafalla, M., Santiago, J. 2004, A&A 414, L53
- [Tafalla et al. 2002] Tafalla, M., Myers, P. C., Caselli, P., Walmsley, C. M., & Comito, C. 2002, ApJ, 569, 815
- [Tatematsu et al. 2004] Tatematsu, K., Umemoto, T., Kandori, R., Sekimoto, Y. 2004, ApJ 606, 333
- [Terzieva & Herbst 2000] Terzieva, R. & Herbst, E. 2000, MNRAS, 317, 563
- [Willacy et al. 1998] Willacy, K., Langer, W.D., Velusamy, T. 1998, ApJ 507, L171