The Virial Mass Function of Nearby SDSS Galaxy Clusters
Abstract
We present a new determination of the cluster mass function and velocity dispersion function in a volume 10Mpc-3 using data from the Fourth Data Release of the Sloan Digital Sky Survey (SDSS) to determine virial masses. We use the caustic technique to remove foreground and background galaxies. The cluster virial mass function agrees well with recent estimates from both X-ray observations and cluster richnesses. Our determination of the mass function lies between those predicted by the First-Year and Three-Year WMAP data. We constrain the cosmological parameters and and find good agreement with WMAP and constraints from other techniques. With the CIRS mass function alone, we estimate and , or 0.03 when holding fixed. We also use the WMAP parameters as priors and constrain velocity segregation in clusters. Using the First and Third-Year results, we infer velocity segregation of 0.940.05 or 1.280.06 respectively. The good agreement of various estimates of the cluster mass function shows that it is a useful independent constraint on estimates of cosmological parameters. We compare the velocity dispersion function of clusters to that of early-type galaxies and conclude that clusters comprise the high-velocity end of the velocity dispersion function of dark matter haloes. Future studies of galaxy groups are needed to study the transition between dark matter haloes containing individiual galaxies and those containing systems of galaxies. The evolution of cluster abundances provides constraints on dark energy models; the mass function presented here offers an important low redshift calibration benchmark.
1 Introduction
Clusters of galaxies are the most massive gravitationally relaxed systems in the universe, so the observed cluster mass function is a sensitive probe of cosmological parameters. Galaxy cluster abundances are most sensitive to the matter density of the universe and , the rms fluctuations in spheres of radius 8 and the usual normalization of the linear power spectrum (Henry & Arnaud, 1991; Bahcall & Cen, 1993). The evolution of the mass function is an excellent probe of the growth of structure, and thus can constrain the properties of dark energy (e.g., Haiman et al., 2001; Hu, 2003; Vikhlinin et al., 2003; Henry, 2004; Majumdar & Mohr, 2004; Voevodkin & Vikhlinin, 2004). Robust constraints from cluster evolution are only possible with an accurate determination of the cluster mass function in the nearby universe.
Most recent estimates of from the local cluster mass function find values of 0.6-0.8 for =0.3 (Pierpaoli et al., 2001; Reiprich & Böhringer, 2002; Seljak, 2002; Viana et al., 2002; Pierpaoli et al., 2003; Schuecker et al., 2003; Viana et al., 2003; Bahcall et al., 2003; Voevodkin & Vikhlinin, 2004; Eke et al., 2005; Dahle, 2006) (there is a strong degeneracy between and ). Estimates based on cosmic shear usually find larger values of 0.8-1.0 (Massey et al., 2005; Hoekstra et al., 2005; Semboloni et al., 2006), although some investigators find smaller values (Hamana et al., 2003; Heymans et al., 2005). Recent attempts to model the relation between dark matter haloes and galaxies (van den Bosch et al., 2003; Tinker et al., 2005) suggest that smaller values of 0.6-0.8 are required to match cluster mass-to-light ratios (Carlberg et al., 1996; Bahcall et al., 2000; Rines et al., 2004). Various estimates based on bulk flow models seem to be converging on intermediate values (see Table 3 of Pike & Hudson, 2005). The WMAP satellite has produced tight constraints on many cosmological parameters (Spergel et al., 2003, 2006). Among the largest changes between the First-Year and Three-Year WMAP results (hereafter WMAP1 and WMAP3) was a decrease in both and (Spergel et al., 2006). The WMAP3 results provide a much better fit to the mass function of X-ray clusters from the ROSAT HIghest X-ray FLUx Galaxy Cluster Survey (HIFLUGCS, Reiprich & Böhringer, 2002) than the WMAP1 results (Reiprich, 2006).
The greatest difficulty in measuring the cluster mass function is obtaining sufficiently accurate mass estimates. Three well-established methods exist for measuring cluster masses. The dynamics of cluster galaxies provided the first evidence for dark matter when Zwicky (1933, 1937) applied the virial theorem to the Coma cluster. The second method is to use the properties of the hot intracluster medium (ICM), whose distribution and temperature probe the gravitational potential of the cluster. Finally, gravitational lensing can provide very accurate mass estimates in the centers of clusters and somewhat less accurate estimates at large radii.
All three techniques have been used extensively, but they are each subject to potentially large systematic uncertainties. There may be velocity bias between cluster galaxies and dark matter particles, although the magnitude and direction of this bias is under debate (e.g., Kauffmann et al., 1999b; Diemand et al., 2004; Faltenbacher et al., 2005; Benatov et al., 2006). Chandra and XMM-Newton observations show that the physical properties of the ICM are complex and involve significant interaction with AGN (e.g., McNamara et al., 2000; Markevitch et al., 2000; Fabian et al., 2000; Vikhlinin et al., 2001; Fabian et al., 2006). Finally, mass estimates from gravitational lensing (especially at large radii) are subject to significant uncertainties due to lensing by other structures along the line-of-sight (e.g., Metzler et al., 2001), although these might be overcome by combining information from strong and weak lensing (Natarajan et al., 2002; Bradač et al., 2004). These potential systematics have led some investigators to invert the problem and determine cluster properties by matching the mass function predicted by a cosmological model to the observed richness function or luminosity function (Berlind et al., 2006; Stanek et al., 2006).
Despite these challenges, the cluster mass function is the subject of much study. Most recent measurements of the cluster mass function have been made with either X-ray data (Reiprich & Böhringer, 2002; Allen et al., 2003; Voevodkin & Vikhlinin, 2004) or optical richness data (Bahcall et al., 2003). The most significant uncertainty in determining from X-ray observations is the normalization of scaling relations, either the or the relation. The normalizations are often determined from hydrodynamical simulations (e.g., Borgani et al., 2001), but different simulations produce a range of normalizations (Pierpaoli et al., 2003; Viana et al., 2003). Another potential concern in determining scaling relations is Malmquist bias (Stanek et al., 2006). Voevodkin & Vikhlinin (2004) avoid these scaling relations by estimating the mass of the intracluster medium (ICM) and measuring the baryonic mass function (a similar analysis was presented by Shimasaku, 1997). This method requires assumptions about: the relative contribution of stars and gas to the total baryon mass, the ratio of the baryon fraction in clusters to the global value, and the mass dependence of this ratio. A potentially large systematic uncertainty in all of these X-ray studies is a possible offset between the temperature measured by X-ray satellites and the emission-weighted temperature calculated in hydrodynamical simulations (Rasia et al., 2005). This effect can be understood as the excess contribution of line emission from cooler gas in an ICM with a variety of temperatures, thus causing to be an underestimate of . Correcting for this effect would increase the estimated cluster masses and thus increase the best-fit values of (Rasia et al., 2005; Shimizu et al., 2006). A similar systematic effect is suggested by the higher normalization of the mass-temperature relation found by Vikhlinin et al. (2006) from a study of relaxed clusters with temperature profiles from Chandra data. An increase in this normalization would increase the inferred cluster masses and hence the overall mass function, shifting the constraints towards higher values of and .
Viana et al. (2002) use a hybrid approach of combining the X-ray luminosity function of clusters with a mass-luminosity relation determined from weak lensing (Sheldon et al., 2001). They find results consistent with other X-ray studies, but note that large systematic uncertainties are possible. Recently, Dahle (2006) used weak lensing mass estimates of an X-ray selected cluster sample to measure the mass function. He found good agreement with many of the constraints from X-ray estimates but lower values of and than recent cosmic shear studies.
To our knowledge, the most recent cluster virial mass function is that of Girardi et al. (1998a). The advent of large-scale redshift surveys, especially the Sloan Digital Sky Survey (SDSS, Stoughton et al., 2002), enables more accurate virial mass estimates due to their size and uniformity. Compared to X-ray studies, virial mass estimates are sensitive to larger scales ( rather than , where is the radius within which the enclosed density is times the critical density), which allow for comparison with theoretical mass functions with significantly less extrapolation (White, 2002). Also, virial masses can be estimated for poor clusters and rich groups, whereas X-ray mass estimates of these systems are complicated by possible energy input from supernovae and AGN (e.g., Loewenstein, 2000). Probing these smaller masses enables a direct constraint on fluctuations on the scale 8, rather than the 14 scales probed by 10 clusters (Pierpaoli et al., 2001). Eke et al. (2005) used a simplified version of the virial theorem to estimate the group mass function from an optically-selected group catalog in the Two Degree Field Galaxy Redshift Survey (Colless et al., 2001). Differences in our analysis include: X-ray selection rather than optical selection of clusters, use of the full virial theorem with corrections for the surface pressure term, much better sampling of individual systems (the average number of cluster members is 50), and more conservative rejection of interlopers (thus significantly reducing scatter in the mass estimates). Estimates of the group mass function using virial masses are usually limited by systematics in group selection, mass estimation, and cosmic variance (Girardi & Giuricin, 2000; Martínez et al., 2002; Heinämäki et al., 2003).
Here we use the virial theorem to estimate cluster masses of an X-ray selected sample of clusters with data from the Sloan Digital Sky Survey. The use of X-ray selection reduces the impact of projection effects on cluster selection. Perhaps the greatest advantage of X-ray selection of our sample is that the selection function is well understood and can be computed directly. The cluster sample we use is the Cluster Infall Regions in SDSS (CIRS) sample of Rines & Diaferio (2006) with some minor modifications described below.
We describe the data and the cluster sample in 2. In 3, we estimate the mass function using both virial masses and caustic masses and discuss potential systematic effects. We compute the velocity dispersion function of clusters in 4 and compare it to the velocity dispersion function of early-type galaxies in SDSS. We discuss our results and conclude in . We assume , and a flat CDM cosmology () throughout. Where not stated explicitly, we assume for initial calculations.
2 The CIRS Cluster Sample
2.1 Sloan Digital Sky Survey
The Sloan Digital Sky Survey (SDSS, Stoughton et al., 2002) is a wide-area photometric and spectroscopic survey at high Galactic latitudes. The Fourth Data Release (DR4) of SDSS includes 6670 square degrees of imaging data and 4783 square degrees of spectroscopic data (Adelman-McCarthy et al., 2006).
The spectroscopic limit of the main galaxy sample of SDSS is =17.77 after correcting for Galactic extinction (Strauss et al., 2002). Assuming the luminosity function of Blanton et al. (2003), the spectroscopic limit of SDSS corresponds to at . The Cluster And Infall Region Nearby Survey (CAIRNS Rines et al., 2003) found that well-sampled clusters contain dense envelopes known as caustics (Diaferio, 1999) which provide a direct means of determining cluster membership. CAIRNS sampled all galaxies brighter than about and often fainter. Figure 7 of Rines et al. (2005) shows the infall patterns for galaxies brighter than in the CAIRNS clusters. These patterns are readily apparent, but less well-defined than the full CAIRNS samples (Rines et al., 2003). Thus, we expect that infall patterns of clusters with masses similar to CAIRNS clusters should be apparent to 0.1, though not much further. Rines & Diaferio (2006) show the infall patterns of the clusters at 0.1 in SDSS and compute the mass profiles from the caustic technique and the virial theorem.
Note that the SDSS Main Galaxy Survey is 85-90% complete to the spectroscopic limit. The survey has 7% incompleteness due to fiber collisions (Strauss et al., 2002), which are likely more common in dense cluster fields. Because the target selected in a fiber collision is determined randomly, this incompleteness can theoretically be corrected for in later analysis. From a comparison of SDSS with the Millennium Galaxy Catalogue, Cross et al. (2004) conclude that there is an additional incompleteness of 7% due to galaxies misclassified as stars or otherwise missed by the SDSS photometric pipeline. For our purposes, the incompleteness is not important provided sufficient numbers of cluster galaxies do have spectra.
2.2 X-ray Cluster Surveys
Because SDSS surveys primarily low-redshift galaxies, the best sampled clusters are both nearby and massive. We therefore search X-ray cluster catalogs derived from the ROSAT All-Sky Survey for clusters in DR4. RASS (Voges et al., 1999) is a shallow survey but it is sufficiently deep to include nearby, massive clusters. RASS covers virtually the entire sky and is thus the most complete X-ray cluster survey for nearby clusters.
Published cluster catalogs derived from the RASS include the X-ray Brightest Abell Cluster Survey (XBACS Ebeling et al., 1996), the Bright Cluster Survey and its extension (BCS and eBCS Ebeling et al., 1998, 2000), the NOrthern ROSAT All-Sky galaxy cluster survey (NORAS Böhringer et al., 2000), and the ROSAT-ESO flux limited X-ray galaxy cluster survey (REFLEX Böhringer et al., 2001). We refer the reader to the individual catalog papers for detailed descriptions of the construction of the catalogs (Rines & Diaferio, 2006, contains a summary). When combined, these catalogs cover virtually the entire sky at high Galactic latitudes (20∘) to a flux limit of 3erg cm-2 s-1. None of these catalogs is complete, so by combining them, we create a substantially more complete composite catalog.
2.3 Definition of the Mass Function Sample
When multiple X-ray fluxes are available for a cluster, we use the most recently published value. The order of preferences is therefore: REFLEX, NORAS, BCS/eBCS, XBACs. The details of the flux determinations in the different catalogs vary somewhat: NORAS and REFLEX both measure fluxes with Growth Curve Analysis, while BCS/eBCS uses Voronoi Tessellation and Percolation. Despite these differences, the derived fluxes agree fairly well (see Figure 21 of Böhringer et al., 2000, for a direct comparison of NORAS and BCS/eBCS), so combining the catalogs is a reasonable procedure. By using the most recently published flux value, we use the GCA flux if available and the VTP flux only when no GCA flux is available.
We define a flux-limited and redshift-limited sample of clusters with the criteria erg s-1cm-2 (0.1-2.4 keV) and 0.10. Note that variations in the method of determining flux in different catalogs may affect the precise flux limit. The only cluster in XBACS but not in any other catalog is A1750b: XBACS identifies two X-ray sources (A1750a/b), whereas other catalogs treat them as one source. We follow Böhringer et al. (2004) and treat A1750 as a single source rather than two separate sources as in XBACs. Similarly, the galaxy NGC5813 is bound to the NGC5846 group (Mahdavi et al., 2005). Because the dynamics of NGC5813 are dominated by the NGC5846 system, we eliminate NGC5813 from the sample (both are eliminated by our minimum redshift cutoff below). We inspect the redshift data around each cluster to confirm the cluster redshift and find that A2064 has an incorrect redshift (and X-ray luminosity) listed in NORAS. The correct redshift is 0.0738 instead of 0.1076. We correct the X-ray luminosity accordingly. Our final flux and volume limited sample contains 72 clusters within the SDSS DR4 spectroscopic footprint. We will refer to this sample as the CIRS (Cluster Infall Regions in SDSS) clusters in the rest of this paper. The completeness of the CIRS sample is limited by the completeness of the underlying cluster catalogs. However, by combining clusters from the various catalogs we should be more complete than any one of the catalogs. The local nature of the sample (0.1) likely improves the completeness of the CIRS sample relative to a flux-limited sample. We discuss the modest potential incompleteness in more detail in 3.3. The clusters are an unbiased sample: the selection of the CIRS sample is based purely on X-ray flux and the footprint of the SDSS DR4 spectroscopic survey. We confirm this claim with a test: we find =0.5180.035 compared to an expected value of 0.5 for a complete, uniform sample (see 3.3). A homogeneous, complete, all-sky catalog of extended X-ray sources in RASS would allow a significant improvement in the determination of the mass function. Unfortunately, no such catalog currently exists.
For computing the mass function, we omit three clusters (Virgo, NGC4636, and NGC5846) with because their peculiar velocities are likely large compared to their redshifts. From our analysis of individual systems in CIRS (see 6 of Rines & Diaferio, 2006), we eliminate A1035A/B and A1291A/B as superpositions which would lie below the flux limit if they were resolved in the catalogs. Finally, we eliminate A2249 because its center lies 2′ off the edge of the SDSS DR4 spectroscopic footprint. After eliminating these six clusters, our mass function sample includes 66 clusters. We test the effects of returning these clusters to the mass function sample in 3.3.
3 The Cluster Mass Function
3.1 Estimating the Mass Function
We compute both the standard cluster mass function and the cumulative mass function n(M), the number density of clusters more massive than M. To compute the mass functions, we use the 1/ estimator (Schmidt, 1968), where is the maximum (comoving) volume a cluster with X-ray luminosity would lie within our flux and redshift limited sample. In each logarithmic mass bin, we sum the clusters
| (1) |
where the sum is over clusters within the mass bin. By using rather than , we avoid the need to know the slope, normalization, and scatter of the scaling relation to properly calculate (Reiprich & Böhringer, 2002). Figure 1 shows the maximum volume probed by CIRS as a function of X-ray luminosity. Although CIRS covers a much smaller area than HIFLUGCS, is larger for CIRS for because of the smaller flux limit. We calculate assuming a flat =0.3 cosmology. We repeated our analysis using =0.1 and =1 to calculate and find that this has a negligible effect due to the local nature of the sample. We correct our mass functions for a 5% incompleteness (see 3.3.1) which we assume applies uniformly to the sample.
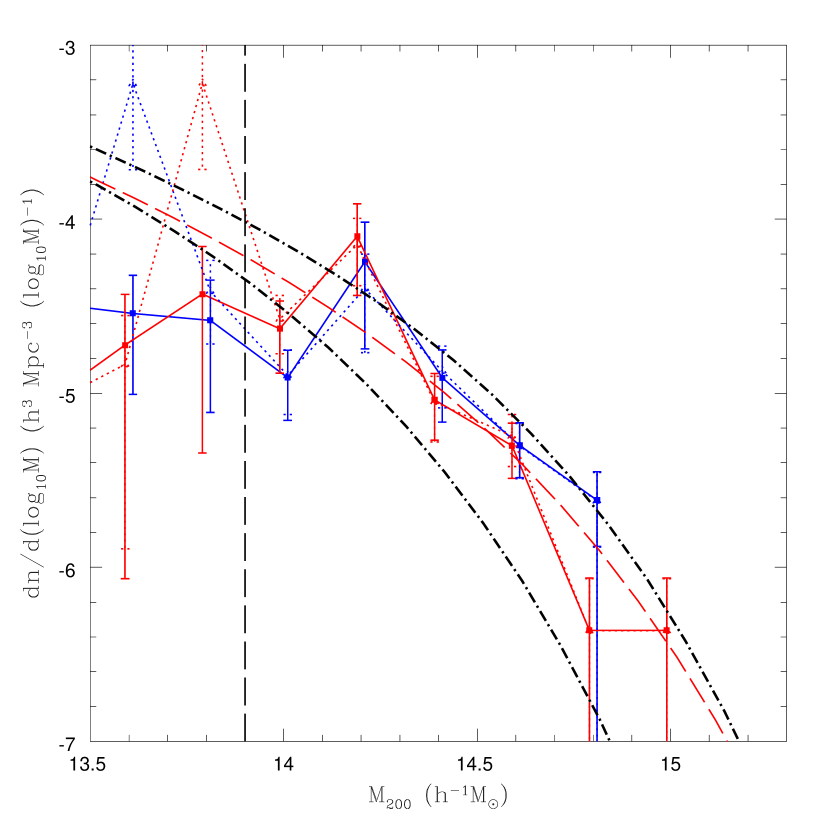
We estimate the uncertainty in the mass function as . Figure 2 shows the CIRS mass function and Figure 5 shows the cumulative mass function. We compute the masses in two ways, one using the virial theorem (red lines in Figures 2 and 5) and the other (blue lines) using the caustic technique (Diaferio, 1999; Rines & Diaferio, 2006). We use the caustic technique to identify cluster members in both techniques. As a membership classification algorithm, the caustic technique is similar to the “shifting gapper” technique (e.g., Fadda et al., 1996), but is less sensitive to interlopers. The mass functions computed with these two mass estimators agree quite well, a confirmation that the caustic technique provides reliable mass estimates (Diaferio, 1999; Geller et al., 1999; Rines et al., 2000; Reisenegger et al., 2000; Rines et al., 2001, 2002; Biviano & Girardi, 2003; Rines et al., 2003; Rines & Diaferio, 2006). We estimate the masses within , where is the radius within which the average density is , where is the critical density. We determine directly from the nonparametric mass profiles.
For the virial masses, we obtain an initial estimate of from the virial mass profiles (Rines & Diaferio, 2006). We then apply a correction factor of 8% to account for the surface pressure term of the virial theorem. This factor is calculated from Equation 8 of Girardi et al. (1998b) assuming galaxies are on isotropic orbits and an NFW mass profile (Navarro et al., 1997) with a concentration parameter of ( is a scale radius in the NFW profile). The assumption of isotropic orbits is supported by numerous observations (van der Marel et al., 2000; Rines et al., 2003; Łokas & Mamon, 2003; Biviano & Katgert, 2004; Rines & Diaferio, 2006; Benatov et al., 2006; Łokas et al., 2006), as is the value of (Markevitch et al., 1999; Lin et al., 2004; Rines & Diaferio, 2006). After this correction, the enclosed density within is now 178. We therefore reduce the mass by a further 3.3% to obtain our final estimate of . The concentration is expected to be a weak function of mass, (Bullock et al., 2001). This corresponds to a 25-30% change over the mass range we probe. This change has little effect on the mass estimates: assuming =5 leads to a mass underestimate (overestimate) of 3% (5%) for a cluster with 10 (2.5). The CIRS clusters are quite well sampled, with an average of 50 members per cluster. The statistical uncertainties in are on average 13%. The caustic and virial mass functions are in good agreement, further confirming the good agreement between caustic and virial mass estimates (Rines et al., 2003; Diaferio et al., 2005; Rines & Diaferio, 2006).
The original prescription for calculating the mass function was proposed via the Press-Schechter formalism (Press & Schechter, 1974). Numerical simulations predict relatively more massive systems and fewer less massive systems than Press-Schechter theory (Sheth & Tormen, 1999). Jenkins et al. (2001) provided fitting formulae for a universal mass function that can be evaluated for many cosmological models. In particular, their mass function accurately reproduces the mass function of dark matter haloes in the Hubble Volume simulation. Several investigators conclude that the mass function provided by Equation (B3) of Jenkins et al. (2001) is close to a universal mass function and can thus be used to constrain cosmological parameters (White, 2002; Evrard et al., 2002; Hu & Kravtsov, 2003). For this formula, haloes are placed at the most bound particles, then the radius of the halo is increased until the enclosed spherical overdensity is 180 times the background (not critical) density. This mass (the “b” in the subscript indicates background rather than critical density) must then be converted to assuming an NFW profile with =5 (White, 2002; Evrard et al., 2002; Hu & Kravtsov, 2003). Note that X-ray mass estimates often require conversion to ; the conversion to is less of an extrapolation and less sensitive to the assumed concentration parameter.
Figure 2 shows the mass functions for the best-fit cosmological parameters from WMAP1 (Spergel et al., 2003) and WMAP3 (Spergel et al., 2006) at =0.062 (the mean redshift of our sample). The WMAP mass functions in Figure 2 are convolved with our mean mass uncertainty for appropriate comparison with the observed mass functions. Some of the largest differences between the WMAP1 and WMAP3 were in and , the two parameters which have the largest impacts on the mass function. Figure 2 shows that the CIRS mass function lies between the WMAP1 and WMAP3 results. Reiprich (2006) showed that the HIFLUGCS mass function estimated using the X-ray properties of clusters lies closer to the WMAP3 results (Reiprich & Böhringer, 2002), although other mass functions derived with X-ray mass tracers find values closer to the WMAP1 results (Pierpaoli et al., 2003; Viana et al., 2003).
The dotted lines in Figure 2 show the mass function computed without imposing a minimum redshift on the sample. Clearly, the systematic uncertainty in the mass function due to cosmic variance becomes large at M10 (see also Figure 1). We minimize for the CIRS mass function in the mass range =[13.9,15.1] by calculating the Jenkins et al. (2001) mass function for a given pair of (,) and shifting the mass scale from to . We set according to
| (2) |
(Sugiyama, 1995) with , and (Spergel et al., 2006). Holding =0.21 fixed does not strongly affect our results. We convolve the mass function with our mean mass uncertainty according to
| (3) |
where is computed using the scaling relation
| (4) |
from Rines & Diaferio (2006) where is the X-ray luminosity in units of . This relation has a different normalization than the relation found by Popesso et al. (2005), but is consistent with the relation of Reiprich & Böhringer (2002). The weighting by is required because the CIRS mass function is flux-limited for . We repeat the fits without weighting by and find negligible differences. At smaller masses, the volume probed is fairly small (Figure 1), so the mass function estimate is subject to significant uncertainty due to cosmic variance (Hu & Kravtsov, 2003). In addition, the number of clusters at these low masses is probably not large enough to sample the scatter in . Figure 3 shows the 68% and 99.7% confidence levels for and inferred from the virial mass function (solid contours) and the caustic mass function (dashed contours). With the CIRS virial mass function, we estimate and , or 0.03 when holding fixed (all assuming =0.7). The open squares in Figure 3 show the WMAP1 and WMAP3 estimates with their 68% uncertainties as errorbars (Spergel et al., 2006, Table 2). The CIRS mass function is consistent with the WMAP3 results within their 95% confidence levels, while the WMAP1 results lie inside the 68% contour of the CIRS mass function. To compute the constraints in Figure 3 we assumed =0.7 and computed from Equation (2). Figure 4 shows the effects of assuming different values of or of assuming a fixed value of =0.21. Clearly, the mass function computed with virial masses is now able to provide cosmological constraints competitive with those from X-ray mass estimates and even WMAP.
3.2 Comparison With Other Methods
We now compare the CIRS mass function and the resulting constraints on cosmological parameters with previous studies.
3.2.1 Mass Function
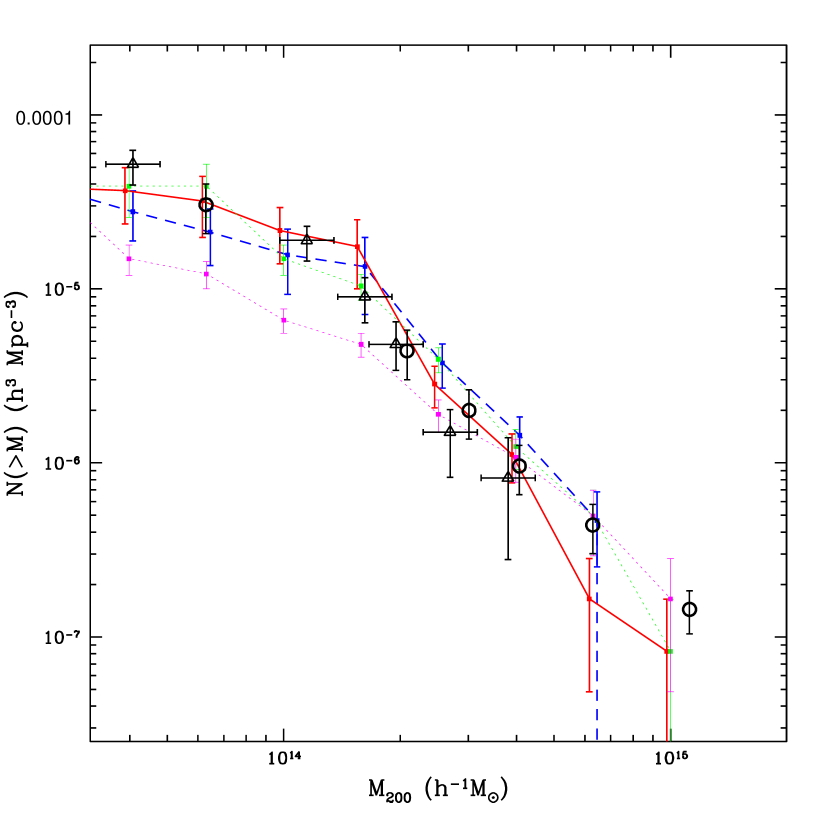
Figure 5 shows the CIRS cluster mass function compared to other methods. HIFLUGCS uses the temperature and deprojected distribution of X-ray gas to estimate cluster masses from the ROSAT All-Sky Survey (Reiprich & Böhringer, 2002). Bahcall et al. (2003) use a mass-richness relation to estimate the masses of clusters from the Early Data Release of SDSS. The CIRS mass function agrees well with both of these independent methods, indicating that the cluster mass function is robustly estimated at low redshift.
3.2.2 Cosmological Constraints
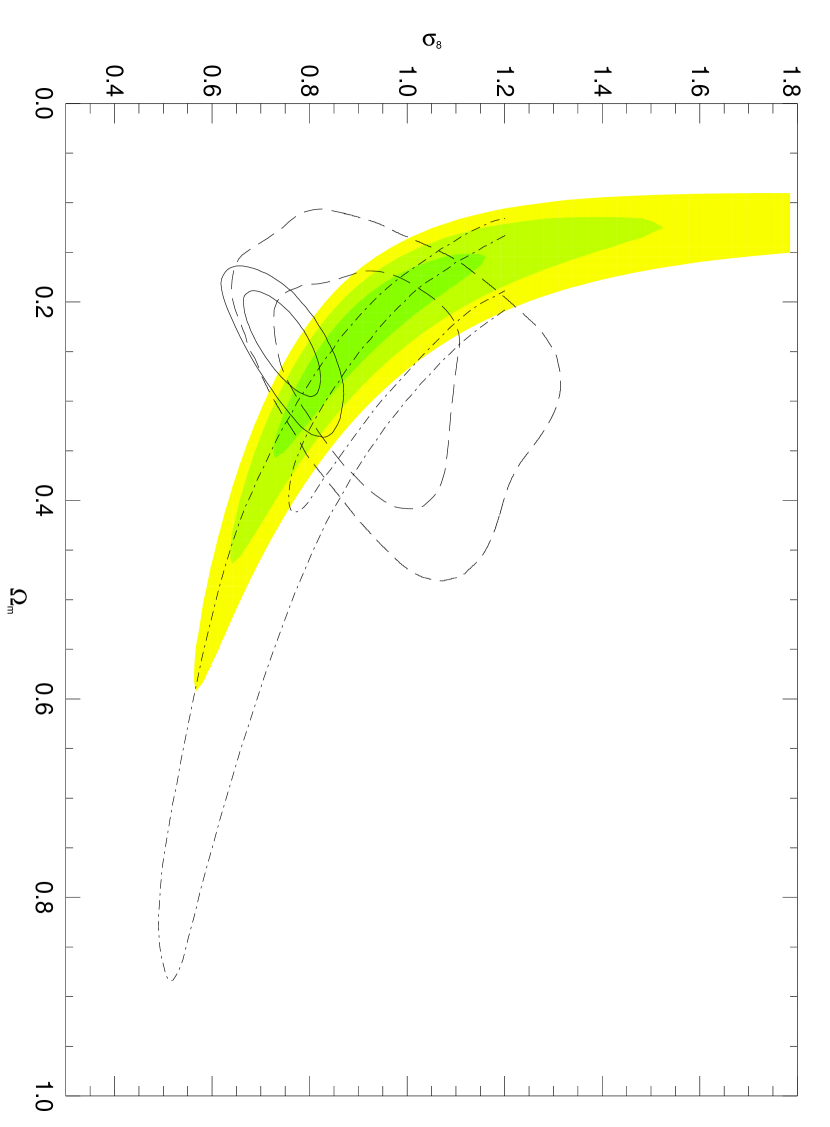
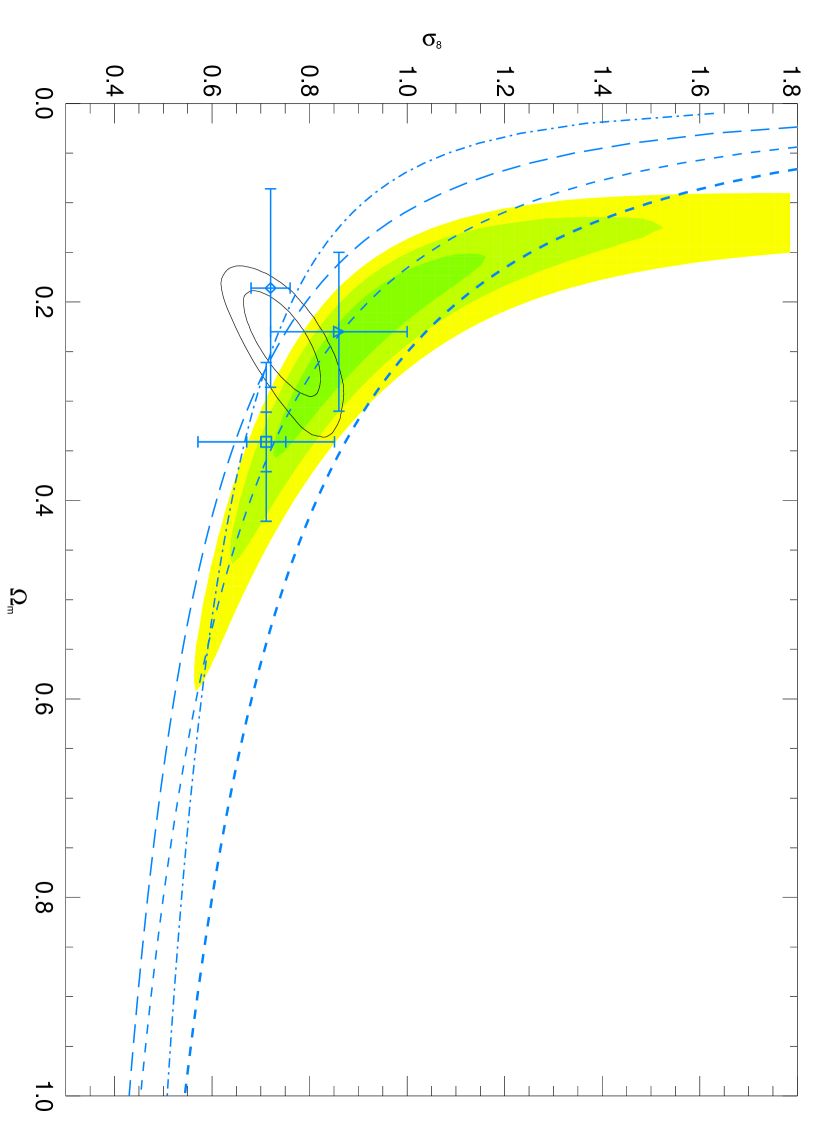
Figures 6-9 show a variety of other constraints in the plane. The colored contours in each Figure are for the CIRS virial mass function with the 68%, 95%, and 99.7% confidence levels for and . The two sets of contours shown in each panel show the 68% and 95% confidence levels from WMAP3. The dashed contours in Figure 6 shows these levels for WMAP1, and the dash-dotted contours are the confidence levels from CFHTLS (Hoekstra et al., 2005). Note that the contours for WMAP1 are adapted from Figure 1 of Spergel et al. (2006), which displays the contours in the - plane. We increase the uncertainties in to account for the uncertainty in . The 68% confidence levels of WMAP3 and CIRS overlap each other, demonstrating excellent agreement between these two very different types of constraints. The CIRS contours lie closer to the WMAP3 contours than the CFHTLS results.
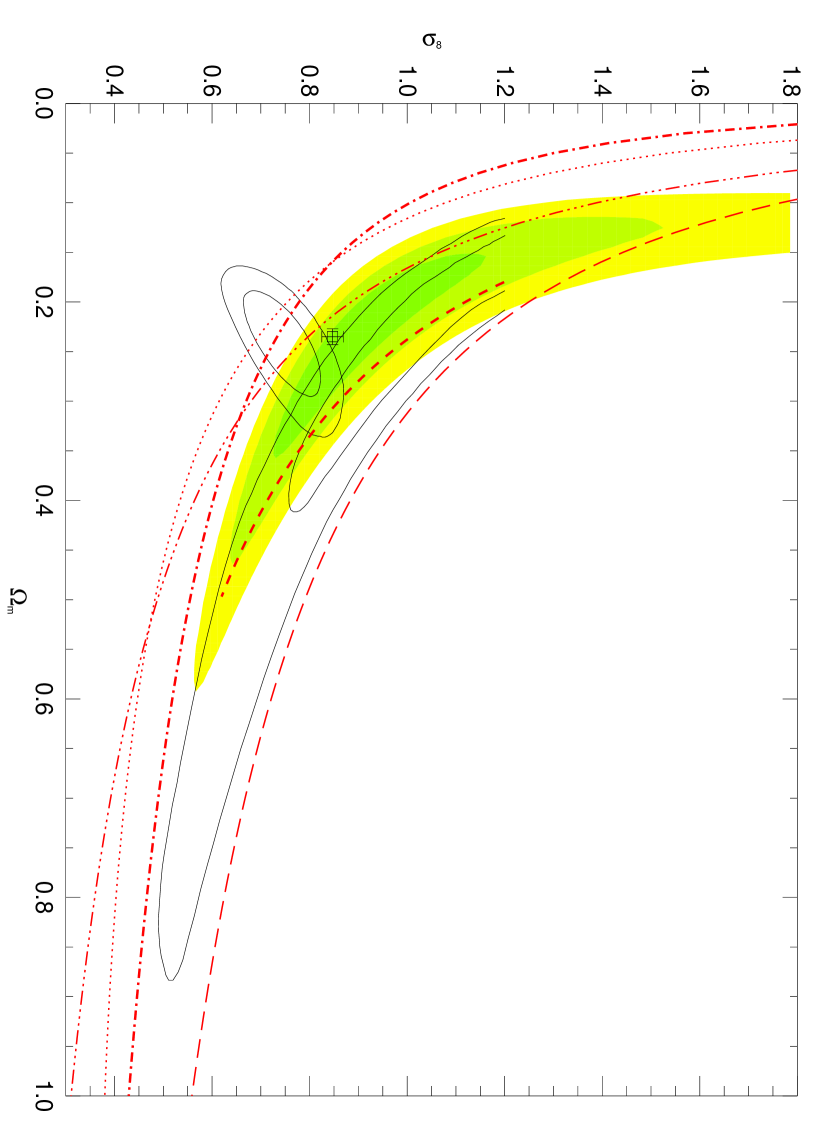
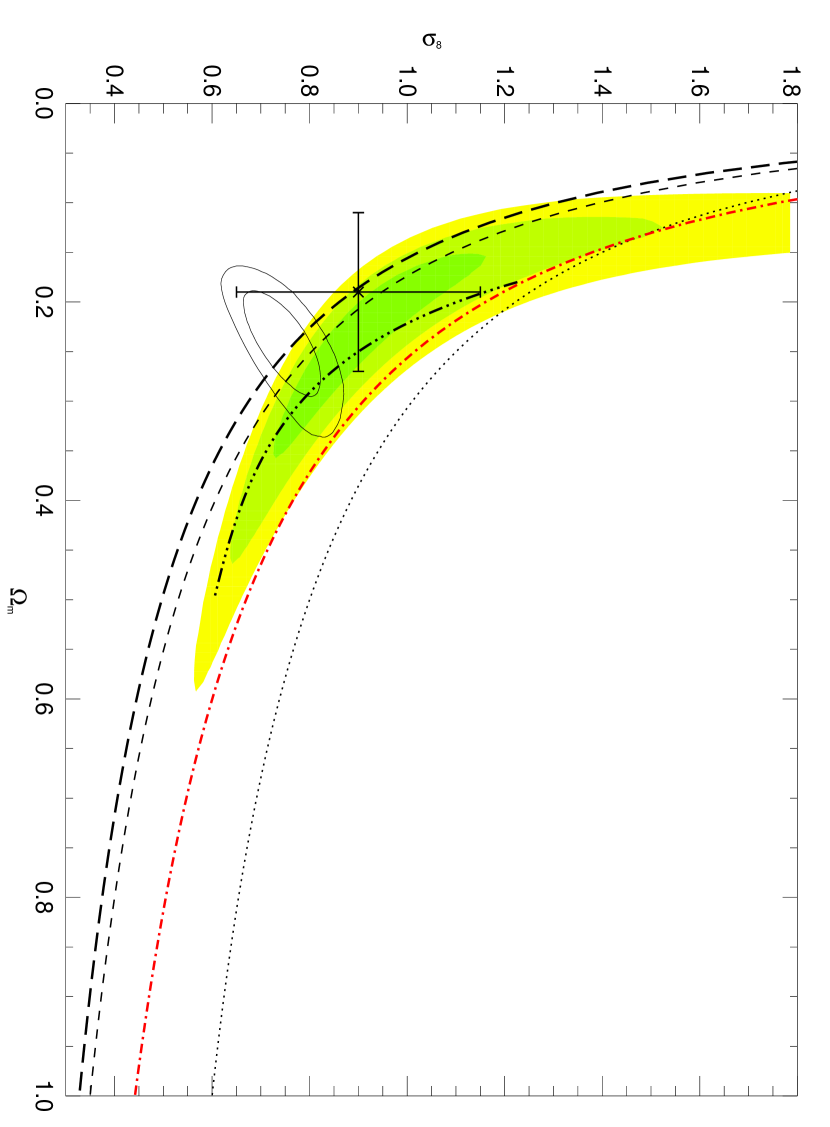
Figure 7 compares the CIRS results with various lensing constraints. Red lines show the range of cosmic shear measurements, from the “low” result of Heymans et al. (2005, dash-triple-dotted line) to the “high” result of Massey et al. (2005, long-dashed line). The open square with extremely small errorbars is the result of Seljak et al. (2006) for joint constraints from WMAP3, small-scale CMB measurements, SDSS galaxy clustering, supernovae, and the Lyman- forest. The 68% confidence contour of the CIRS virial mass function encloses this point. Remarkably, the cosmic shear estimate from the CFHT Legacy Survey “Deep” sample (Semboloni et al., 2006, thick red short-dashed line in Figure 7) lies within the CIRS mass function 68% contour, and the CFHTLS “Wide” sample overlaps significantly with the CIRS contours. The red dotted line shows the constraints from the mass function inferred from the relation obtained from weak lensing measurements in SDSS (Viana et al., 2002). Finally, the thick red dash-dotted line shows the recent constraint of Dahle (2006) using weak lensing mass estimates of X-ray selected galaxy clusters. These constraints lie somewhat below the CIRS constraints and closer to the WMAP3. One potential difference between the samples is that the lensing clusters are at =0.15-0.3, so cluster evolution may cause some of this difference.
Blue lines in Figure 8 show constraints from X-ray measurements. The lower short-dashed line is the temperature function constraint of Seljak (2002); the upper short-dashed line shows this relation increased by 20% in to show the systematic offset suggested by Rasia et al. (2005). The long-dashed line is from the X-ray mass function of Reiprich & Böhringer (2002), and the dash-dotted line shows the constraint from the X-ray luminosity function (Allen et al., 2003). The diamond shows a recent X-ray measurements from Voevodkin & Vikhlinin (2004) using the baryon mass function and baryon fraction. The triangle shows the constraint from Pierpaoli et al. (2003) using the X-ray temperature function. The square at large is from combining the cluster abundance with the observed clustering (Schuecker et al., 2003, the two sets of errorbars show statistical and systematic errors). All error bars denote 68% uncertainties.
The upper dotted black line in Figure 9 is the virial mass function of Girardi et al. (1998b), and the thick black short-dashed line (and black cross) is from the mass-richness relation (Bahcall & Bode, 2003). The thick triple-dot-dashed line is the constraint from Eke et al. (2005) for galaxy groups in the 2dFGRS. This line passes close to the middle of the CIRS 68% contour. The black long-dashed line shows the constraints of Tinker et al. (2005) from modeling the halo occupation distribution of galaxies and cluster mass-to-light ratios. Finally, the dash-dotted line shows the constraint from combining peculiar velocity surveys (Pike & Hudson, 2005).
The constraints on (,) from the CIRS virial mass function are in excellent agreement with previous results. They lie between the upper and lower limits of cosmic shear estimates, and very close to the CFHTLS constraints. Compared to optical estimates, CIRS lies slightly above Bahcall & Bode (2003), but agrees extremely well with Eke et al. (2005), who used a simplified virial-like equation to estimate masses. The CIRS constraints yield slightly larger values of (,) than most X-ray estimates, but the systematic temperature underestimate suggested by Rasia et al. (2005) would bring these results into reasonable agreement with the CIRS constraints. Finally, the constraint of Seljak et al. (2006) combines WMAP3 with a number of independent probes to obtain estimates of and with very small statistical uncertainties. The values of these parameters are shifted noticeably relative to the constraints from WMAP3 alone, and the sense of this shift is exactly in the direction of yielding better agreement with the CIRS mass function.
3.3 Testing for Systematics
It is tempting to conclude from the above comparisons that the CIRS virial mass function is an unbiased, reliable estimator of and . Below, we overcome this temptation and discuss potential systematic effects which could bias our results.
3.3.1 Completeness of CIRS
The CIRS sample is derived from four independent X-ray cluster catalogs constructed from the ROSAT All-Sky Survey. None of these surveys is complete: BCS/eBCS is estimated to be 80-90% complete, the main NORAS catalog is estimated to be 52% complete, the NORAS extended sample in the - (0) region is 82% complete (both NORAS estimates are obtained by comparing source counts to the deeper REFLEX survey and assuming identical log N-log S distributions in the northern and southern hemispheres). XBACS searched for extended X-ray emission around all Abell clusters, so the CIRS sample should include all Abell and ACO clusters (Abell et al., 1989) with significant X-ray emission (although large offsets between Abell and X-ray centers may cause XBACS to miss some systems). To estimate the approximate incompleteness in CIRS, we note that 53 of the 66 CIRS clusters are in the northern hemisphere (0) and thus in the area of sky covered by NORAS. Of these 53 clusters, 29 are NORAS (main catalog) clusters meeting our flux limit. If we assume that the 52% completeness of the main NORAS catalog applies to our redshift-limited subsample, there should be (29/0.52)=56 northern clusters in CIRS. Thus, the completeness of the composite CIRS catalog is 95%.
We refit the mass function using only clusters in the REFLEX and NORAS main catalogs (omitting those in the NORAS 9h-14h sample). The REFLEX southern catalog covers a small fraction of the DR4 area; including it eliminates the need to recalculate the effective area of the survey. The REFLEX/NORAS sample should have a completeness similar to, but slightly larger than, the 52% completeness of the NORAS main sample. The cosmological constraints from this subsample assuming either 52% or 60% completeness are very similar to the constraints from the entire sample, although the confidence contours are larger. This result suggests that the use of the composite catalog of X-ray clusters introduces no significant bias in the mass function.
Popesso et al. (2004) searched several X-ray catalogs of clusters and groups including the unpublished NORAS2 catalog, a deeper and more complete version of NORAS. They find four additional systems in the SDSS DR3 spectroscopic area which are not in any of the X-ray cluster catalogs used to construct the CIRS sample. Of these four systems, one (A1139) is included in the NORAS - catalog but lies below our flux limit, another (NGC6173=A2197E) is sometimes included as part of A2197W, and Rines et al. (2002) find a flux for A2197E that is below the CIRS flux limit. The remaining two systems are apparently X-ray groups with velocity dispersions of 450 and virial masses 110. This confirms that many of the systems missing from the CIRS sample are of relatively low mass and would probably lie below our adopted mass cutoff.
We apply the test (Schmidt, 1968) to the CIRS mass function sample to test for incompleteness. We find =0.5180.035, compared to the expected value of 0.5 for a uniform sample. This test shows that the CIRS sample is a representative sample.
We recalculate the cluster mass function using a higher flux limit than the fiducial value of erg s-1cm-2 (0.1-2.4 keV) cited for the parent X-ray catalogs. The mass function computed from the 46 clusters brighter than erg s-1cm-2 (0.1-2.4 keV) is almost identical to our standard mass function. Figure 10 shows the effect of adopting this higher flux limit on our cosmological constraints (dash-dotted contours). The confidence contours get larger, but the best-fit parameters do not change significantly.
The minimum redshift we imposed to select the CIRS mass function sample reduces the number of low-mass systems sampled. Including these systems causes a substantial increase in the number of systems at masses 110, confirming our assertion that cosmic variance becomes significant in this mass range for the CIRS sample.
Distinguishing a single, unrelaxed cluster from two merging clusters is a difficult observational problem. The CIRS sample contains several examples of multiple clusters (Rines & Diaferio, 2006). We test the sensitivity of the CIRS mass function to this effect by making the extreme assumptions that either none or all multiple peaks are separate halos. The affected systems are A1035A, A1035B, A1291A, A1291B, A1750A, A1750B, A2197W, A2197E, NGC5813, and NGC4636. Figure 10 shows that including all of these systems as well as the low-redshift systems (we call this the “maximal” CIRS mass function) makes little difference to our constraints in the (,) plane.
A related completeness problem stems from the fact that, although we use galaxy dynamics to estimate masses, the CIRS sample is selected by X-ray flux (with an upper limit on redshift). This selection may cause the sample to underrepresent clusters with unusually low X-ray luminosities for their masses. This incompleteness almost certainly causes some of the deviations from the theoretical mass functions seen at masses below . However, provided that the scatter in the relation is not too large, this incompleteness should be corrected for in the 1/ weighting. Also, our redshift cutoff of likely increases the completeness because many of the lower-mass clusters are in the Abell catalog and some of the X-ray cluster catalogs explicitly searched for X-ray emission around Abell clusters. This effect likely dominates the competing effect that low-redshift, lower-mass clusters may have lower X-ray surface brightnesses.
Even if the above effects all combine to bias our mass function to erroneously low number densities, we estimate a maximum incompleteness of a factor of two. Note that such a large incompleteness would yield best-fit parameters =0.33 and =0.87, outside the 99.7% confidence contour of our standard estimate. The best-fit contours computed assuming the NORAS completeness of 52% for the entire CIRS sample (i.e., approximately doubling the number densities) produces contours shifted towards larger values of and, to a lesser degree, towards larger values of . Realistically, the incompleteness is probably larger at smaller masses. Correcting for such a mass-dependent incompleteness would tend to decrease the inferred estimate of with a much smaller corresponding increase in .
3.3.2 Mass Estimation and Velocity Segregation
The largest potential systematic effect we find is artificially increasing the uncertainty in the virial mass estimates. As the assumed uncertainty increases, the convolved mass function is more dramatically flattened relative to the true mass function. Figure 11 shows the effects of increasing the virial mass uncertainty by a factor of two (26% uncertainty, dashed contours) and by a factor of five (factor of two uncertainty, dash-dotted contours) without using the weighting of Equation 3.1. We find that artificially increasing the mass uncertainty by a factor of five and eliminating the weighting is sufficient to bring the CIRS mass function into agreement with the WMAP3 parameters, while the change is much smaller when the weighting is included. The effect of mass uncertainties is much more severe for the poorly sampled systems of Eke et al. (2005) and require detailed corrections from mock catalogs. Because the CIRS clusters are much more densely sampled, the effect should be much smaller for the CIRS mass function. Indeed, Figure 9 shows that the constraints from the CIRS mass function agree well with those of Eke et al. (2005).
We investigate two potential sources of systematic error caused by the mass range of our sample. Because the concentration is a weak function of mass (), this may affect the comparison of the mass function via the conversion from to . We refit the mass function using the relation of Bullock et al. (2001) and find essentially the same results as for fixed . Note that the CIRS sample showed little evidence of even a weak trend of c with mass (Rines & Diaferio, 2006, but see Vikhlinin et al. 2006). Second, the uncertainty in the estimated mass may depend on the mass of the system. Less massive systems are expected to contain fewer galaxies and thus may have larger statistical uncertainties. We find such a trend in the CIRS virial masses and redo the fits to the mass function assuming an uncertainty that declines with mass according to in the convolution of the theoretical mass functions. The resulting confidence levels have nearly identical shapes and locations to our default contours.
The issue of velocity segregation between galaxies and dark matter remains an unresolved problem (Kauffmann et al., 1999a, b; Diemand et al., 2004; Faltenbacher et al., 2005). Velocity bias might be significant in the centers of clusters, where the galaxies have experienced dynamical friction. Dynamical friction should produce a smaller velocity dispersion for cluster galaxies than dark matter (Klypin et al., 1999; Yoshikawa et al., 2003; van den Bosch et al., 2005), although they may undergo more frequent mergers (due to their smaller velocities) or tidal disruption, resulting in a larger velocity dispersion of the surviving cluster galaxies relative to the dark matter (Colín et al., 1999; Diemand et al., 2004; Faltenbacher et al., 2005). Note also that the velocity bias may depend on the mass of the cluster (Berlind et al., 2003) or the luminosities of the tracer galaxies (Slosar et al., 2006). An important caveat is that the subhalo distribution of cluster galaxies in simulations does not match the observed distributions of cluster galaxies: real cluster galaxies approximately trace the dark matter profile (e.g., Carlberg et al., 1997; Rines et al., 2001; Biviano & Girardi, 2003; Katgert et al., 2004; Łokas & Mamon, 2003; Lin et al., 2004; Rines et al., 2004), while simulated cluster galaxies are significantly antibiased in cluster centers. This difference is likely caused by the resilience of the stellar component of a subhalo (i.e., real galaxies) against tidal disruption relative to the total subhalo in simulations, implying that a better understanding of the difference between galaxies and subhaloes is required for accurate models of velocity segregation (e.g., Diemand et al., 2004; Faltenbacher et al., 2006). For instance, the details of velocity bias depend on the selection used to identify subhaloes, e.g., whether subhalo mass is measured prior to or after a subhalo enters the cluster (Faltenbacher et al., 2006).
The amount of velocity bias in simulations is typically 10% for cluster-size haloes, although disagreement remains on whether this bias is positive or negative. Velocity bias of this size would lead to virial masses overestimated or underestimated by 20%. Future work is clearly needed to determine the nature and significance of velocity bias for cluster mass estimates. There is no clear evidence from observations in favor of or against velocity bias in clusters, although the generally good agreement between X-ray, lensing, and virial mass estimates suggests that any velocity bias is not large (20%; e.g., Girardi et al., 1998b; Popesso et al., 2004; Diaferio et al., 2005). Because significant velocity bias would produce incorrect virial mass estimates, the agreement between virial and caustic mass estimates is no guarantee that the caustic mass estimates are accurate. However, the mechanisms which cause velocity bias are less effective in the outskirts of clusters, so the caustic technique should be less affected by velocity bias than estimates based on Jeans’ analysis.
Biviano et al. (2006) test the robustness of virial mass estimates in a cosmological hydrodynamic simulation. They find that virial mass estimates are generally reliable for densely sampled clusters, yielding overestimates of 10% for systems with more than 60 members. In general, they find that the most significant problem with estimating virial masses is adequate removal of interlopers. The use of the caustic technique, a relatively conservative membership definition, should mitigate this problem for the CIRS sample.
If one is willing to take the WMAP results as a prior, then one can estimate the sense and degree of velocity segregation by requiring that the CIRS mass function reproduce the predictions of WMAP. The simplest implementation of this method is to assume that the virial masses are biased by a (mass-independent) factor S such that the true cluster mass is given by . If we use the WMAP1 parameters as a prior, we obtain , implying a velocity segregation of 0.940.05. Taking the WMAP3 parameters as a prior, we obtain , implying a velocity segregation of 1.280.06. Seljak et al. (2006) combined constraints from WMAP3 and a variety of other techniques (Lyman- forest, SDSS galaxy clustering, SDSS baryonic acoustic oscillations, supernovae, and smaller-scale CMB measurements) to improve constraints on cosmological parameters. They find that the best-fit estimate of increases to with essentially no change in . If we repeat the above analysis using these parameters as priors, we find and 1.100.05. Thus, an independent measurement of cosmological parameters can constrain the detailed properties of cluster galaxies (Eke et al., 2005; Berlind et al., 2006).
Blue and red galaxies in clusters have dramatically different spatial distributions. By using all galaxies within the caustics to estimate virial masses, we may overestimate . We recalculate the virial mass profiles using only red galaxies, where we define red galaxies as those with (-)-0.05(+20)+0.7 where is the absolute magnitude in band and and are Petrosian magnitudes. We find that there is very little difference in the resulting virial mass estimates and, as a result, little change in the estimated mass function or cosmological parameters (Figure 3). This result differs from the predictions of Biviano et al. (2006) that the virial masses estimated with all galaxies are biased high by a factor of 1.40, while the virial masses computed with red galaxies only are approximately unbiased (). We suggest that this difference is due to the difference in the contrast of caustics in observations and in simulations (Rines et al., 2003; Rines & Diaferio, 2006). A more detailed study of the velocity distribution of red and blue galaxies in and around clusters suggests that intrinsic differences in the velocity dispersions of the two populations are substantially reduced when using the caustic technique to select members (Rines & Diaferio in prep.). This study also shows that, when using the caustic technique, the inclusion or exclusion of blue galaxies produces little change in the velocity dispersion of the total population (in part because blue galaxies are rare in clusters).
Most of the CIRS clusters are sampled only once by SDSS. Thus, the fiber placement constraints of SDSS (no two fibers can be placed closer than 60′′) causes non-uniform sampling of the cluster galaxies. Biviano et al. (2006) show that non-uniform sampling of cluster galaxies by multislit or multifiber surveys may bias virial mass estimates (the cluster core is undersampled so the virial radius is biased). Unfortunately, few clusters have sufficient coverage in both SDSS and elsewhere to test this effect directly. Followup spectroscopy of the CIRS clusters to complete the spectroscopic samples from SDSS would test the significance of this effect.
3.3.3 Peculiar Velocities
We make no corrections for peculiar velocities of the CIRS clusters because no reliable peculiar velocity estimates exist for most of the sample. The closest clusters will be most strongly affected by this approach, because their distance estimates are most sensitive to a given correction for peculiar velocity. Our minimum redshift of 0.02 therefore significantly reduces this uncertainty.
We estimate the magnitude of this effect by adding a random peculiar velocity from a Gaussian distribution of width 400 (Sheth & Diaferio, 2001) to each cluster redshift and recomputing the cluster mass function and cosmological constraints. Several trials using this procedure find confidence contours for (,) that agree well with our default contours. We conclude that peculiar velocities have a small impact on our results, although extensive Monte Carlo simulations could better quantify the resulting systematic uncertainty.
3.3.4 Large-Scale Structure
Large-scale structure could have a significant impact on our mass function if the scale of overdensities is large compared to the volume of the survey. The CIRS sky coverage is that of the spectroscopic survey of SDSS DR4. This means that CIRS does not include the Coma cluster or much of the Great Wall (Geller & Huchra, 1989), but it does include the Sloan Great Wall (Gott et al., 2005). Because of the redshift limit, the maximum volume probed is (Figure 1). Figure 12 shows a histogram of the redshift ditribution of the CIRS mass function sample. The solid curve in Figure 12 shows the expected redshift distribution for the CIRS sample given the X-ray luminosity function of Böhringer et al. (2002). There is no strong evidence for large-scale variations in this histogram. It is difficult to determine whether the CIRS sample contains an overdense or underdense sample of the universe. The eventual release of SDSS DR5 and the SDSS-II Legacy Survey will approximately double the spectroscopic area covered, so those data will provide a good test of the representativeness of the CIRS sample.
3.3.5 Scaling Relations
An alternative method of estimating mass functions is to measure simple observables such as X-ray luminosity or galaxy richness and then apply scaling relations to estimate cluster masses. Although this method has been applied extensively (Pierpaoli et al., 2001; Seljak, 2002; Pierpaoli et al., 2003), the reliability of the mass function and/or cosmological constraints is limited by the reliability of the scaling relations. Scaling relations often have large scatter (Popesso et al., 2004) and they are difficult to calibrate (Evrard et al., 1996; Stanek et al., 2006). We recalculate the CIRS mass function using the observed X-ray luminosities and two scaling relations for , one based on virial masses (Rines & Diaferio, 2006) and one based on masses from X-ray temperatures (Popesso et al., 2004). The resulting mass function for the latter relation contains many fewer systems at M10 than the CIRS mass function (Figure 5). This difference seems to be caused by a difference in the scaling relations determined by Popesso et al. (2004) and Reiprich & Böhringer (2002). Rines & Diaferio (2006) noted that their relation was offset from that of Popesso et al. (2004), although the relations agree. The of Reiprich & Böhringer (2002) and Rines & Diaferio (2006) agree with each other, and so do the resulting estimates of the mass function. We therefore caution that great care and judgment must be taken when using scaling relations to measure the cluster mass function.
3.3.6 Sample Selection
There are several methods of identifying clusters. Four techniques are used to identify clusters: galaxy overdensities (either in projection or in redshift space), identifying extended X-ray sources, identifying peaks in gravitational lensing maps, and identifying Sunyaev-Zeldovich decrements in maps of the cosmic microwave background. Lensing and SZ surveys are both very promising but have yet to produce large, well-selected samples.
Identification of galaxy overdensities has proved very successful, but this method is subject to projection effects, especially when performed without redshift information. Eke et al. (2005) study the mass function from an optically-selected group catalog containing systems with as few as two members. They justify this procedure by extensive comparison to mock catalogs, but the resulting cosmological constraints then have additional systematic uncertainty due to any differences between the mock catalogs and the observations.
Popesso et al. (2006) describe a targeted search for X-ray emission around Abell clusters in SDSS. They find that many Abell clusters with apparently Gaussian velocity distributions lie far below the relation of X-ray selected clusters, although they lie on the same relation. If these X-ray faint clusters are indeed very massive, then the constraints on and from the CIRS mass function are underestimates. Note, however, that these changes would lead to larger disagreements with other estimates (Figure 6), unless either velocity segregation is large (and therefore the masses are overestimated) or the true uncertainty in the measured virial masses is much larger than the statistical uncertainty (or some combination of these effects).
It would be very instructive to compare the CIRS mass function to a cluster mass function constructed with optical cluster catalogs from SDSS (e.g., Miller et al., 2005), but this analysis lies outside the scope of this work. Detailed comparisons of cluster catalogs selected with different techniques (e.g., Donahue et al., 2002) are important for using clusters to constrain cosmological parameters.
3.3.7 Uncertainties in the Predicted Mass Function
Most early attempts to measure cosmological parameters from the observed mass function of clusters used Press-Schechter formalism (Press & Schechter, 1974). In recent years, however, numerical simulations have achieved sufficient resolution to directly measure the mass function of dark matter haloes in cosmologically representative volumes. Sheth & Tormen (1999) proposed a modified form of the Press-Schechter relation that provides a better match to simulations. Jenkins et al. (2001) provide a third form of this relation which provides a good match to simulations of the Virgo consortium. We use their fitting formula for the mass function along with the power spectrum of Bardeen et al. (1986). Reiprich & Böhringer (2002) notes that the best-fit cosmological parameters are unchanged if one uses the power spectrum of Eisenstein & Hu (1999) instead. Warren et al. (2005) use 16 nested simulations to test the effects of numerical resolution on the mass function. Although they find significant differences from the Jenkins et al. (2001) relation for extreme masses (M10 and M10), the Jenkins et al. (2001) relation provides a good approximation over the mass range considered here. The constraints in the (,) plane obtained by using the Press-Schechter or Sheth-Tormen form are nearly identical to those obtained with the Jenkins et al. (2001) relation.
White (2002) discusses the importance of carefully defining the mass of a halo when comparing theoretical and observed mass functions. In particular, the universality of the mass function depends on the algorithm used to measure the mass. White (2002) concludes that the relation of Equation (9) of Jenkins et al. (2001) provides a good match to the mass measured within a spherical overdensity of 180 times the background (not critical) density. Both White (2002) and Hu & Kravtsov (2003) recommend computing the mass function for a given set of cosmological parameters using the 180b definition of mass and then using an NFW profile with concentration =5 to convert the observed and theoretical mass scales to a common scale. Here we convert the mass scale of the theoretical mass function so that the models can be shown against the observations more easily. There appears to be consensus in the literature that the systematic uncertainties in the predicted mass function for different cosmological models are of the order 15% (White, 2002; Evrard et al., 2002; Hu & Kravtsov, 2003; Stanek et al., 2006). White (2002) suggests that higher accuracy may require a suite of cosmological simulations run with different values of and with subsequent analysis using a variety of algorithms for defining the mass of a halo.
Some authors have noted that the most massive clusters measure fluctuations on a scale larger than 8. In particular, Pierpaoli et al. (2001) note that clusters with temperatures of 6.5 keV sample fluctuations on a scale of 14. The CIRS sample probes lower mass systems than many previous studies: the median mass of the sample is 210, corresponding to a scale of 8.3 for =0.3. Thus, we constrain directly. Virial masses have an advantage over X-ray masses in this respect because the properties of the ICM for clusters with M10 may be strongly affected by feedback from supernovae and AGN (e.g., Loewenstein, 2000), and the ICM in groups may not be in hydrostatic equilibrium.
4 Velocity Dispersion Function
The abundance of systems as a function of velocity dispersion is an important input to models of gravitational lensing. Sheth et al. (2003) and Mitchell et al. (2005) compute the velocity dispersion function of early-type galaxies in SDSS. One might expect a smooth transition between the velocity dispersion function of galaxies and the velocity dispersion function of groups and clusters (Shimasaku, 1993). Zabludoff et al. (1993) found the cluster velocity dispersion function for systems identified in the CfA Redshift Survey (see also Pisani et al., 2003). They found good agreement with the velocity dispersion function implied by the X-ray temperature function. Figure 13 compares the velocity dispersion functions of these two types of systems. The cluster velocity dispersion function shows a deficit of low- systems relative to the number needed to produce a smooth function. The dashed line in Figure 13 shows the velocity dispersion function for our “maximal” mass function sample including cluster pairs and low-redshift systems. This estimate is more consistent with a smooth transition between dark matter haloes containing one versus many galaxies, although the two types of systems still do not join smoothly. A careful study of the abundance of galaxy groups that span the intermediate mass and velocity dispersion range would shed light on this transition. Earlier studies (Zabludoff et al., 1993; Mazure et al., 1996; Girardi & Giuricin, 2000; Heinämäki et al., 2003; Pisani et al., 2003) were generally limited to small, nearby volumes, so cosmic variance will continue to be an important limitation to these efforts. The much larger samples available with 2dFGRS and SDSS should alleviate this problem (Martínez et al., 2002; Eke et al., 2005).
Figure 14 shows the cumulative velocity dispersion function of the CIRS sample. Our estimate is lower than that of Pisani et al. (2003) from the CfA2 Redshift Survey, but they note that their estimate is larger than most previous estimates, a result they attribute to cosmic variance due to the presence of the Great Wall in the survey. The CIRS velocity dispersion function agrees with these earlier estimates (e.g., Zabludoff et al., 1993; Mazure et al., 1996). However, Casagrande & Diaferio (2006) analyze the properties of groups in the Updated Zwicky Catalog (UZC) and find similar results to Pisani et al. (2003).
5 Discussion and Future Work
We use the Fourth Data Release of the Sloan Digital Sky Survey to measure the mass function of galaxy clusters in the local universe. We select clusters based on their X-ray flux and a redshift limit (). X-ray selection has the crucial advantage over optical selection of yielding a well-defined selection function. We measure cluster masses from the dynamics of their member galaxies using both the virial theorem and the caustic technique. The resulting mass functions agree well with previous determinations using X-ray properties and the mass-richness relation. We conclude that the cluster mass function is measured robustly in the local universe. We compare this mass function to predictions of various cosmological models to obtain constraints in the (,) plane. With the CIRS virial mass function (and assuming =0.7), we estimate = and =, or =0.03 when holding =0.3 fixed.
The CIRS virial mass function agrees well with the WMAP1 and lies slightly above the WMAP3 results, although still within the 95% confidence levels. This result contrasts slightly with Reiprich (2006), who finds that the HIFLUGCS mass function lies much closer to WMAP3 than WMAP1. However, other investigators have found mass functions using X-ray data that lie closer to the CIRS mass function, and there remain open questions about the systematic uncertainties in the X-ray mass estimates (Rasia et al., 2005; Stanek et al., 2006). Virial masses have the following advantages: they measure the masses at larger radii, where less extrapolation is required to compare with theoretical results, they are less sensitive to the complex physics in the centers of clusters, and they can be applied to lower mass systems for which nongravitational physics greatly complicates X-ray mass estimates, thus eliminating any uncertainty due to possible scale dependence of the estimate of (the clusters of, e.g., Pierpaoli et al., 2001, sample fluctuations on larger scales, , which must then be converted to ). We investigate several potential sources of systematic error and conclude that the most significant effect would be a large underestimate of the uncertainties in the virial mass estimates. Recent investigations with numerical simulations Biviano et al. (2006) suggest that the scatter in virial mass estimates of well-sampled clusters is smaller than the amount required to bring our results into agreement with the WMAP3 parameters, although further confirmation of this result would be useful.
Although obtaining virial mass estimates from galaxy dynamics for large numbers of clusters requires much observational effort, the reward is an independent measurement of the mass function and a powerful confirmation of the current cosmological model. This work further demonstrates the power of the mass function as a fundamental constraint on cosmological parameters. The SDSS-II Legacy Survey should substantially enlarge the sample of local clusters and reduce both statistical and systematic uncertainties in the mass function.
The CIRS mass function provides a critical normalization of the mass function in the nearby universe. An accurate normalization of the local mass function is a prerequisite for future studies of the evolution of the mass function. Future determinations of the mass function at higher redshifts will directly probe the growth rate of structure and provide further constraints on cosmological parameters (e.g., Haiman et al., 2001; Hu, 2003; Vikhlinin et al., 2003; Henry, 2004; Majumdar & Mohr, 2004; Voevodkin & Vikhlinin, 2004). We conclude that a large spectroscopic program to measure virial masses of an X-ray selected sample at moderate redshift would provide an independent measurement of the evolution of the mass function.
References
- Abell et al. (1989) Abell, G. O., Corwin, H. G., & Olowin, R. P. 1989, ApJS, 70, 1
- Adelman-McCarthy et al. (2006) Adelman-McCarthy, J. et al. 2006, ApJS, 162, 38
- Allen et al. (2003) Allen, S. W., Schmidt, R. W., Fabian, A. C., & Ebeling, H. 2003, MNRAS, 342, 287
- Böhringer et al. (2000) Böhringer, H. et al. 2000, ApJS, 129, 435
- Böhringer et al. (2001) —. 2001, A&A, 369, 826
- Böhringer et al. (2004) —. 2004, A&A, 425, 367
- Bahcall & Bode (2003) Bahcall, N. A. & Bode, P. 2003, ApJ, 588, L1
- Bahcall & Cen (1993) Bahcall, N. A. & Cen, R. 1993, ApJ, 407, L49
- Bahcall et al. (2000) Bahcall, N. A., Cen, R., Davé, R., Ostriker, J. P., & Yu, Q. 2000, ApJ, 541, 1
- Bahcall et al. (2003) Bahcall, N. A. et al. 2003, ApJ, 585, 182
- Bardeen et al. (1986) Bardeen, J. M., Bond, J. R., Kaiser, N., & Szalay, A. S. 1986, ApJ, 304, 15
- Benatov et al. (2006) Benatov, L., Rines, K. J., Natarajan, P., Nagai, D., & Kravtsov, A. 2006, MNRAS, in press (astro-ph/0605105)
- Berlind et al. (2003) Berlind, A. A. et al. 2003, ApJ, 593, 1
- Berlind et al. (2006) —. 2006, ArXiv Astrophysics e-prints
- Biviano & Girardi (2003) Biviano, A. & Girardi, M. 2003, ApJ, 585, 205
- Biviano & Katgert (2004) Biviano, A. & Katgert, P. 2004, A&A, 424, 779
- Biviano et al. (2006) Biviano, A., Murante, G., Borgani, S., Diaferio, A., Dolag, K., & Girardi, M. 2006, ArXiv Astrophysics e-prints
- Blanton et al. (2003) Blanton, M. R. et al. 2003, ApJ, 592, 819
- Böhringer et al. (2002) Böhringer, H. et al. 2002, ApJ, 566, 93
- Borgani et al. (2001) Borgani, S. et al. 2001, ApJ, 561, 13
- Bradač et al. (2004) Bradač, M., Lombardi, M., & Schneider, P. 2004, A&A, 424, 13
- Bullock et al. (2001) Bullock, J. S. et al. 2001, MNRAS, 321, 559
- Carlberg et al. (1997) Carlberg, R. G., Yee, H. K. C., & Ellingson, E. 1997, ApJ, 478, 462
- Carlberg et al. (1996) Carlberg, R. G., Yee, H. K. C., Ellingson, E., Abraham, R., Gravel, P., Morris, S., & Pritchet, C. J. 1996, ApJ, 462, 32
- Casagrande & Diaferio (2006) Casagrande, L. & Diaferio, A. 2006, ArXiv Astrophysics e-prints
- Colín et al. (1999) Colín, P., Klypin, A. A., Kravtsov, A. V., & Khokhlov, A. M. 1999, ApJ, 523, 32
- Colless et al. (2001) Colless, M. et al. 2001, MNRAS, 328, 1039
- Cross et al. (2004) Cross, N. J. G., Driver, S. P., Liske, J., Lemon, D. J., Peacock, J. A., Cole, S., Norberg, P., & Sutherland, W. J. 2004, MNRAS, 349, 576
- Dahle (2006) Dahle, H. 2006, ArXiv Astrophysics e-prints
- Diaferio (1999) Diaferio, A. 1999, MNRAS, 309, 610
- Diaferio et al. (2005) Diaferio, A., Geller, M. J., & Rines, K. J. 2005, ApJ, 628, L97
- Diemand et al. (2004) Diemand, J., Moore, B., & Stadel, J. 2004, MNRAS, 352, 535
- Donahue et al. (2002) Donahue, M. et al. 2002, ApJ, 569, 689
- Ebeling et al. (2000) Ebeling, H., Edge, A. C., Allen, S. W., Crawford, C. S., Fabian, A. C., & Huchra, J. P. 2000, MNRAS, 318, 333
- Ebeling et al. (1998) Ebeling, H., Edge, A. C., Bohringer, H., Allen, S. W., Crawford, C. S., Fabian, A. C., Voges, W., & Huchra, J. P. 1998, MNRAS, 301, 881
- Ebeling et al. (1996) Ebeling, H., Voges, W., Bohringer, H., Edge, A. C., Huchra, J. P., & Briel, U. G. 1996, MNRAS, 281, 799
- Eisenstein & Hu (1999) Eisenstein, D. J. & Hu, W. 1999, ApJ, 511, 5
- Eke et al. (2005) Eke, V. R., Baugh, C. M., Cole, S., Frenk, C. S., & Navarro, J. F. 2005, ArXiv Astrophysics e-prints
- Evrard et al. (1996) Evrard, A. E., Metzler, C. A., & Navarro, J. F. 1996, ApJ, 469, 494
- Evrard et al. (2002) Evrard, A. E. et al. 2002, ApJ, 573, 7
- Fabian et al. (2006) Fabian, A. C., Sanders, J. S., Taylor, G. B., Allen, S. W., Crawford, C. S., Johnstone, R. M., & Iwasawa, K. 2006, MNRAS, 366, 417
- Fabian et al. (2000) Fabian, A. C. et al. 2000, MNRAS, 318, L65
- Fadda et al. (1996) Fadda, D., Girardi, M., Giuricin, G., Mardirossian, F., & Mezzetti, M. 1996, ApJ, 473, 670
- Faltenbacher et al. (2005) Faltenbacher, A., Kravtsov, A. V., Nagai, D., & Gottlöber, S. 2005, MNRAS, 358, 139
- Faltenbacher et al. (2006) —. 2006, MNRAS, submitted (astro-ph/0602197)
- Geller et al. (1999) Geller, M. J., Diaferio, A., & Kurtz, M. J. 1999, ApJ, 517, L23
- Geller & Huchra (1989) Geller, M. J. & Huchra, J. P. 1989, Science, 246, 897
- Girardi et al. (1998a) Girardi, M., Borgani, S., Giuricin, G., Mardirossian, F., & Mezzetti, M. 1998a, ApJ, 506, 45
- Girardi & Giuricin (2000) Girardi, M. & Giuricin, G. 2000, ApJ, 540, 45
- Girardi et al. (1998b) Girardi, M., Giuricin, G., Mardirossian, F., Mezzetti, M., & Boschin, W. 1998b, ApJ, 505, 74
- Gott et al. (2005) Gott, J. R. I., Jurić, M., Schlegel, D., Hoyle, F., Vogeley, M., Tegmark, M., Bahcall, N., & Brinkmann, J. 2005, ApJ, 624, 463
- Haiman et al. (2001) Haiman, Z., Mohr, J. J., & Holder, G. P. 2001, ApJ, 553, 545
- Hamana et al. (2003) Hamana, T. et al. 2003, ApJ, 597, 98
- Heinämäki et al. (2003) Heinämäki, P., Einasto, J., Einasto, M., Saar, E., Tucker, D. L., & Müller, V. 2003, A&A, 397, 63
- Henry (2004) Henry, J. P. 2004, ApJ, 609, 603
- Henry & Arnaud (1991) Henry, J. P. & Arnaud, K. A. 1991, ApJ, 372, 410
- Heymans et al. (2005) Heymans, C. et al. 2005, MNRAS, 361, 160
- Hoekstra et al. (2005) Hoekstra, H., Mellier, Y., van Waerbeke, L., Semboloni, E., Fu, L., Hudson, M. J., Parker, L. C., Tereno, I., & Benabed, K. 2005, ArXiv Astrophysics e-prints
- Hu (2003) Hu, W. 2003, Phys. Rev. D, 67, 081304
- Hu & Kravtsov (2003) Hu, W. & Kravtsov, A. V. 2003, ApJ, 584, 702
- Jenkins et al. (2001) Jenkins, A., Frenk, C. S., White, S. D. M., Colberg, J. M., Cole, S., Evrard, A. E., Couchman, H. M. P., & Yoshida, N. 2001, MNRAS, 321, 372
- Katgert et al. (2004) Katgert, P., Biviano, A., & Mazure, A. 2004, ApJ, 600, 657
- Kauffmann et al. (1999a) Kauffmann, G., Colberg, J. M., Diaferio, A., & White, S. D. M. 1999a, MNRAS, 303, 188
- Kauffmann et al. (1999b) —. 1999b, MNRAS, 307, 529
- Klypin et al. (1999) Klypin, A., Gottlöber, S., Kravtsov, A. V., & Khokhlov, A. M. 1999, ApJ, 516, 530
- Lin et al. (2004) Lin, Y., Mohr, J. J., & Stanford, S. A. 2004, ApJ, 610, 745
- Loewenstein (2000) Loewenstein, M. 2000, ApJ, 532, 17
- Łokas & Mamon (2003) Łokas, E. L. & Mamon, G. A. 2003, MNRAS, 343, 401
- Łokas et al. (2006) Łokas, E. L., Wojtak, R., Gottlöber, S., Mamon, G. A., & Prada, F. 2006, MNRAS, 367, 1463
- Mahdavi et al. (2005) Mahdavi, A., Trentham, N., & Tully, R. B. 2005, AJ, 130, 1502
- Majumdar & Mohr (2004) Majumdar, S. & Mohr, J. J. 2004, ApJ, 613, 41
- Markevitch et al. (1999) Markevitch, M., Vikhlinin, A., Forman, W. R., & Sarazin, C. L. 1999, ApJ, 527, 545
- Markevitch et al. (2000) Markevitch, M. et al. 2000, ApJ, 541, 542
- Martínez et al. (2002) Martínez, H. J., Zandivarez, A., Merchán, M. E., & Domínguez, M. J. L. 2002, MNRAS, 337, 1441
- Massey et al. (2005) Massey, R., Refregier, A., Bacon, D. J., Ellis, R., & Brown, M. L. 2005, MNRAS, 359, 1277
- Mazure et al. (1996) Mazure, A. et al. 1996, A&A, 310, 31
- McNamara et al. (2000) McNamara, B. R., Wise, M., Nulsen, P. E. J., David, L. P., Sarazin, C. L., Bautz, M., Markevitch, M., Vikhlinin, A., Forman, W. R., Jones, C., & Harris, D. E. 2000, ApJ, 534, L135
- Metzler et al. (2001) Metzler, C. A., White, M., & Loken, C. 2001, ApJ, 547, 560
- Miller et al. (2005) Miller, C. J. et al. 2005, AJ, 130, 968
- Mitchell et al. (2005) Mitchell, J. L., Keeton, C. R., Frieman, J. A., & Sheth, R. K. 2005, ApJ, 622, 81
- Natarajan et al. (2002) Natarajan, P., Loeb, A., Kneib, J.-P., & Smail, I. 2002, ApJ, 580, L17
- Navarro et al. (1997) Navarro, J. F., Frenk, C. S., & White, S. D. M. 1997, ApJ, 490, 493
- Pierpaoli et al. (2003) Pierpaoli, E., Borgani, S., Scott, D., & White, M. 2003, MNRAS, 342, 163
- Pierpaoli et al. (2001) Pierpaoli, E., Scott, D., & White, M. 2001, MNRAS, 325, 77
- Pike & Hudson (2005) Pike, R. W. & Hudson, M. J. 2005, ApJ, 635, 11
- Pisani et al. (2003) Pisani, A., Ramella, M., & Geller, M. J. 2003, AJ, 126, 1677
- Popesso et al. (2006) Popesso, P., Biviano, A., Böhringer, H., & Romaniello, M. 2006, ArXiv Astrophysics e-prints
- Popesso et al. (2005) Popesso, P., Biviano, A., Böhringer, H., Romaniello, M., & Voges, W. 2005, A&A, 433, 431
- Popesso et al. (2004) Popesso, P., Böhringer, H., Brinkmann, J., Voges, W., & York, D. G. 2004, A&A, 423, 449
- Press & Schechter (1974) Press, W. H. & Schechter, P. 1974, ApJ, 187, 425
- Rasia et al. (2005) Rasia, E., Mazzotta, P., Borgani, S., Moscardini, L., Dolag, K., Tormen, G., Diaferio, A., & Murante, G. 2005, ApJ, 618, L1
- Reiprich (2006) Reiprich, T. H. 2006, ArXiv Astrophysics e-prints
- Reiprich & Böhringer (2002) Reiprich, T. H. & Böhringer, H. 2002, ApJ, 567, 716
- Reisenegger et al. (2000) Reisenegger, A., Quintana, H., Carrasco, E. R., & Maze, J. 2000, AJ, 120, 523
- Rines et al. (2004) Rines, K., Geller, M. J., Diaferio, A., Kurtz, M. J., & Jarrett, T. H. 2004, AJ, 128, 1078
- Rines et al. (2002) Rines, K., Geller, M. J., Diaferio, A., Mahdavi, A., Mohr, J. J., & Wegner, G. 2002, AJ, 124, 1266
- Rines et al. (2000) Rines, K., Geller, M. J., Diaferio, A., Mohr, J. J., & Wegner, G. A. 2000, AJ, 120, 2338
- Rines et al. (2003) Rines, K., Geller, M. J., Kurtz, M. J., & Diaferio, A. 2003, AJ, 126, 2152
- Rines et al. (2005) —. 2005, AJ, 130, 1482
- Rines et al. (2001) Rines, K., Geller, M. J., Kurtz, M. J., Diaferio, A., Jarrett, T. H., & Huchra, J. P. 2001, ApJ, 561, L41
- Rines & Diaferio (2006) Rines, K. J. & Diaferio, A. 2006, AJ, in press (astro-ph/0602032)
- Schmidt (1968) Schmidt, M. 1968, ApJ, 151, 393
- Schuecker et al. (2003) Schuecker, P., Böhringer, H., Collins, C. A., & Guzzo, L. 2003, A&A, 398, 867
- Seljak (2002) Seljak, U. 2002, MNRAS, 337, 769
- Seljak et al. (2006) Seljak, U., Slosar, A., & McDonald, P. 2006, ArXiv Astrophysics e-prints
- Semboloni et al. (2006) Semboloni, E., Mellier, Y., van Waerbeke, L., Hoekstra, H., Tereno, I., Benabed, K., Gwyn, S. D. J., Fu, L., Hudson, M. J., Maoli, R., & Parker, L. C. 2006, A&A, 452, 51
- Sheldon et al. (2001) Sheldon, E. S. et al. 2001, ApJ, 554, 881
- Sheth & Diaferio (2001) Sheth, R. K. & Diaferio, A. 2001, MNRAS, 322, 901
- Sheth & Tormen (1999) Sheth, R. K. & Tormen, G. 1999, MNRAS, 308, 119
- Sheth et al. (2003) Sheth, R. K. et al. 2003, ApJ, 594, 225
- Shimasaku (1993) Shimasaku, K. 1993, ApJ, 413, 59
- Shimasaku (1997) —. 1997, ApJ, 489, 501
- Shimizu et al. (2006) Shimizu, M., Kitayama, T., Sasaki, S., & Suto, Y. 2006, PASJ, 58, 291
- Slosar et al. (2006) Slosar, A., Seljak, U., & Tasitsiomi, A. 2006, MNRAS, 366, 1455
- Spergel et al. (2003) Spergel, D. et al. 2003, ApJS, 148, 175
- Spergel et al. (2006) Spergel, D. N. et al. 2006, ArXiv Astrophysics e-prints
- Stanek et al. (2006) Stanek, R., Evrard, A. E., Böhringer, H., Schuecker, P., & Nord, B. 2006, ArXiv Astrophysics e-prints
- Stoughton et al. (2002) Stoughton, C. et al. 2002, AJ, 123, 485
- Strauss et al. (2002) Strauss, M. A. et al. 2002, AJ, 124, 1810
- Sugiyama (1995) Sugiyama, N. 1995, ApJS, 100, 281
- Tinker et al. (2005) Tinker, J. L., Weinberg, D. H., Zheng, Z., & Zehavi, I. 2005, ApJ, 631, 41
- van den Bosch et al. (2003) van den Bosch, F. C., Mo, H. J., & Yang, X. 2003, MNRAS, 345, 923
- van den Bosch et al. (2005) van den Bosch, F. C., Weinmann, S. M., Yang, X., Mo, H. J., Li, C., & Jing, Y. P. 2005, MNRAS, 361, 1203
- van der Marel et al. (2000) van der Marel, R. P., Magorrian, J., Carlberg, R. G., Yee, H. K. C., & Ellingson, E. 2000, AJ, 119, 2038
- Viana et al. (2003) Viana, P. T. P., Kay, S. T., Liddle, A. R., Muanwong, O., & Thomas, P. A. 2003, MNRAS, 346, 319
- Viana et al. (2002) Viana, P. T. P., Nichol, R. C., & Liddle, A. R. 2002, ApJ, 569, L75
- Vikhlinin et al. (2006) Vikhlinin, A., Kravtsov, A., Forman, W., Jones, C., Markevitch, M., Murray, S. S., & Van Speybroeck, L. 2006, ApJ, 640, 691
- Vikhlinin et al. (2001) Vikhlinin, A., Markevitch, M., & Murray, S. S. 2001, ApJ, 551, 160
- Vikhlinin et al. (2003) Vikhlinin, A. et al. 2003, ApJ, 590, 15
- Voevodkin & Vikhlinin (2004) Voevodkin, A. & Vikhlinin, A. 2004, ApJ, 601, 610
- Voges et al. (1999) Voges, W. et al. 1999, A&A, 349, 389
- Warren et al. (2005) Warren, M. S., Abazajian, K., Holz, D. E., & Teodoro, L. 2005, ArXiv Astrophysics e-prints
- White (2002) White, M. 2002, ApJS, 143, 241
- Yoshikawa et al. (2003) Yoshikawa, K., Jing, Y. P., & Börner, G. 2003, ApJ, 590, 654
- Zabludoff et al. (1993) Zabludoff, A. I., Geller, M. J., Huchra, J. P., & Ramella, M. 1993, AJ, 106, 1301
- Zwicky (1933) Zwicky, F. 1933, Helv. Phys. Acta, 6, 110
- Zwicky (1937) —. 1937, ApJ, 86, 217