An XMM-Newton Observation of the Massive Edge-on Sb Galaxy NGC 2613
Abstract
We present an XMM-Newton observation of the massive edge-on Sb galaxy NGC 2613. We discover that this galaxy contains a deeply embedded active nucleus with a 0.3-10 keV luminosity of 3.3 and a line-of-sight absorption column of . Within the optical B-band isophote of the galaxy, we detect an additional 4 sources with an accumulated luminosity of 4.3. The bulk of the unresolved X-ray emission spatially follows the near-infrared (NIR) K-band surface brightness distribution;the luminosity ratio is consistent with that inferred from galactic discrete sources. This X-ray-NIR association and the compatibility of the X-ray spectral fit with the expected spectrum of a population of discrete sources suggest that low-mass X-ray binaries (LMXBs) are the most likely emitters of the unresolved emission in the disk region. The remaining unresolved emission is primarily due to extraplanar hot gas. The luminosity of this gas is at least a factor of 10 less than that predicted by recent simulations of intergalactic gas accretion by such a massive galaxy with a circular rotation speed (Toft et al. 2002). Instead, we find that the extraplanar hot gas most likely represents discrete extensions away from the disk, including two “bubble-like” features on either side of the nucleus. These extensions appear to correlate with radio continuum emission and, energetically, can be easily explained by outflows from the galactic disk.
1 Introduction
X-ray observations of extraplanar hot gas ( 106 K) around nearby edge-on disk galaxies are essential in the study of the galactic ecosystem in many aspects, particularly the disk-halo interaction. Such observations have helped establish the prevalence of galactic superwinds in starburst galaxies, e.g., NGC 253 (Strickland et al. 2000, 2002) and NGC 4666 (Dahlem, Weaver & Heckman 1998), among others. Extraplanar X-ray-emitting gas has also been detected unambiguously around several “normal” late-type galaxies with little evidence for nuclear starbursts: NGC 891 (Sb; Bregman & Houck 1997), NGC 4631 (Scd; Wang et al. 2001), NGC 3556 (Sc; Wang, Chaves & Irwin 2003) and NGC 4634 (Scd; Tllmann et al. 2006). In these galaxies (except for NGC 4634 which currently lacks direct evidence), extraplanar hot gas is clearly linked to outflows from recent massive star-forming regions in galactic disks. The global X-ray properties of extraplanar gas in these “normal” star-forming galaxies, when scaled with the star formation rate of the host galaxies, appear similar to those found in starburst galaxies (Strickland et al. 2004a, b; Wang 2005). Nevertheless, this needs to be confirmed by extended X-ray observations of “normal” star-forming galaxies.
On the other hand, current galaxy formation models also predict the existence of hot gaseous halos surrounding present-day disk galaxies, which arise from gravitational infall from the intergalactic medium (IGM; e.g., Toft et al. 2002 and references therein). The predicted extraplanar X-ray luminosity strongly depends on the mass of the host galaxy. X-ray observations thus have long been expected to detect such gaseous halos around nearby massive, typically earlier-type disk galaxies. However, there is so far little direct observational evidence for the presence of this kind of X-ray-emitting halo. Benson et al. (2000) analyzed X-ray emission from the outer halos () of primarily two early-type spirals NGC 2841 (Sb; Mpc) and NGC 4594 (Sa; Mpc), using ROSAT PSPC observations. No significant diffuse emission was detected, although the upper limits to the diffuse X-ray luminosities are consistent with the current predictions (Toft et al. 2002). Therefore, more dedicated searches for the X-ray signals of IGM accretion around disk galaxies are needed.
Here we present a study of an XMM-Newton observation toward NGC 2613, an edge-on Sb galaxy with “normal” star formation. We focus on probing the spatial and spectral properties of its large-scale X-ray emission. This galaxy (Table 5) is a good candidate to probe the presence of hot gas, in the sense that: 1) it is very massive and thus expected to contain a large amount of hot gas; 2) its high inclination (79∘) allows the possibility of detecting extraplanar emission, either from a halo of accreted gas or a large-scale outflow; 3) its moderately large distance (25.9 Mpc) places the galaxy and its 50 kpc vicinity in the field of view (FOV) of a typical XMM-Newton observation, offering a good opportunity of studying the large-scale distribution of gas, and 4) it is known to show extraplanar features at other wavebands, specifically the radio continuum and HI (Chaves & Irwin 2001; Irwin & Chaves 2003) as well as earlier HI observations (Bottema 1989).
2 Observations and Data Reduction
We obtained two XMM-Newton observations on NGC 2613. The first observation (Obs. ID 0149160101), taken on April 23/24, 2003 with a 40 ks exposure, suffered heavily from background flares. Consequently, another observation (Obs. ID 0149160201) with a 33 ks exposure was taken on May 20/21, 2003. In our analysis, we only used data obtained from the second observation.
We used SAS, version 6.1.0, together with the latest calibration files for data reduction. For the MOS data, we selected only events with patterns 0 through 12 and applied flag filters XMMEA_EM, XMMEA_2, XMMEA_3 and XMMEA_11. For the PN data, we selected only events with patterns 0 through 4 and applied flag filters XMMEA_EP, XMMEA_2, XMMEA_3 and XMMEA_11. According to light curves of the MOS and the PN, we further excluded time intervals with high background rates by setting good time interval thresolds of 2.0 cts/s for the MOS in the 0.3-12 keV range and 6.0 cts/s for the PN in the 0.3-15 keV range, respectively. The resulting net exposure time is 23.5 ks for the MOS and 18.7 ks for the PN. We used the skycast program to generate the “blank-sky” background for our observation. Same event filters were applied to the“blank-sky” event files, resulting in exposures of 791, 759 and 294 ks for the MOS1, MOS2 and PN, respectively. We then constructed images and exposure maps at the 0.2-0.5, 0.5-1, 1-2, 2-4.5 and 4.5-7.5 keV bands for each detector. For spectral analysis, we selected only events with FLAG = 0.
3 Analysis and Results
3.1 Discrete X-ray Sources
We perform source detection on the PN images of the soft (S, 0.5-2 keV), hard (H, 2-7.5 keV) and broad (B=S+H) bands. As detailed in Wang (2004), the source detection procedure, optimized to detect point-like sources, uses a combination of detection algorithms: wavelet, sliding-box and maximum likelihood centroid fitting. The source detection uses a detection aperture of the 50% PSF encircled energy radius (EER). Multiple detections with overlapping 2 centroid error circles are considered to be the same source, and the centroid position with the smallest error is adopted. The accepted sources all have a local false detection probability .
We detect a total of 67 discrete sources on the PN images, 5 of which are located within the isophote of the galaxy. We have also examined the source detection in the 0.2-0.5 keV band, but found that the results are contaminated by many artifacts, especially near the CCD boundaries. Using the same detection procedure, we detected 46 sources in the combined images of MOS1 and MOS2, but no new source is found within the FOV of the PN. Table 2 lists the sources detected from the PN data, the locations of which are shown in Fig. 1.
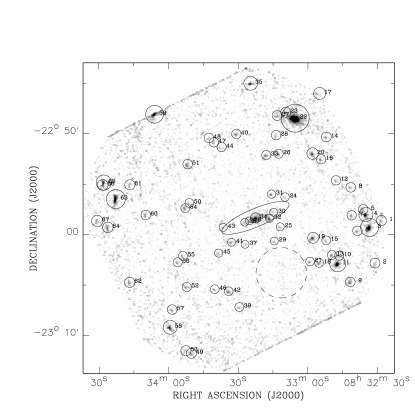
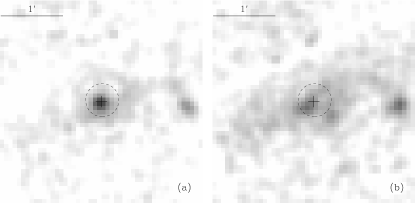
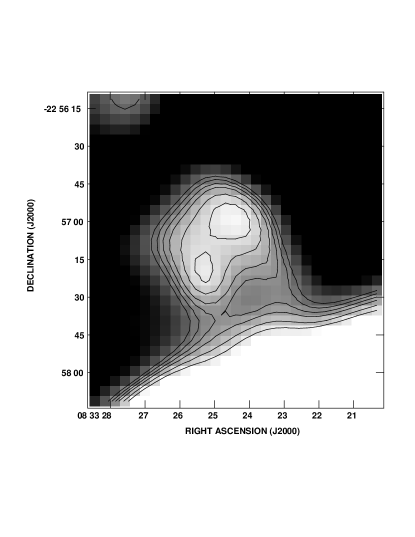
The prominent nucleus of NGC 2613 is readily seen in Fig. 2a. The nucleus is the only source detected within the central 30′′, suggesting that this emission may represent an AGN. To investigate this further, we perform a spectral analysis on the nuclear emission. Due to the relatively low spatial resolution and short exposure time of the observation as well as the relatively large distance to NGC 2613, the spectrum extraction of the nucleus is a compromise between having better counting statistics and suffering less contamination from non-nuclear emission around the nucleus. To assess the contribution from non-nuclear emission, we extract two spectra from circles with radii of 10′′ and 16′′ around the galactic center, for each detector. The 10′′ (16′′) radius corresponds to a physical scale of 1.2 (2.0) kpc at the distance of NGC 2613 and represents an enclosed energy fraction (EEF) of 0.50 (0.65) in the PN and 0.55 (0.70) in the MOS. We extract a background spectrum for each detector from a circle with a 25 radius at to the south of the galactic disk (Fig. 1). This background region is chosen because it shows a low X-ray intensity and is at an off-axis angular distance comparable to that of the disk. We then bin the source spectra to achieve a background-subtracted signal-to-noise ratio greater than 2.
The spectra from the 16′′ circle show a prominent broad bump at energies 4-5 keV (Fig. 3), which can also be seen in the spectra from the 10′′ circle. This is further evidence that the nuclear region contains an AGN since the spectra can naturally be explained by a combination of a heavily absorbed power-law from an AGN and a softer contribution from non-nuclear emission. We jointly fit the PN, MOS1 and MOS2 spectra in the 0.3-12 keV range with XSPEC. Owing to the lack of obvious features below 3 keV in the spectra, a composite model of wabs[zwabs(PL)+PL] is applied, where the first power-law component (PL1) with intrinsic absorption characterizes the nuclear emission and the second power-law component (PL2) represents the non-nuclear emission. In the fit, we require that the amount of foreground absorption be at least that supplied by the Galactic foreground (as specified in wabs: N). Fit results for the 10′′ and 16′′ spectra are consistent with each other within the uncertainty ranges. We list in Table 3 the fit results to the 16′′ spectra, the implications of which will be discussed in § 4.1. All quoted errors in the tables are at the 90% confidence level. The best-fit two-component model is shown in Fig. 3.
We note that in the PN spectrum there is some hint of excess over the best-fit two-component model at 0.9 keV, which might be physically due to the presence of diffuse hot gas around the nucleus. We thus try to include a thermal plasma component (APEC in XSPEC) in the fit to probe the existence of an additional thermal component. While the best-fit temperature of this component is, as expected, 0.9 keV, the fit is not significantly improved according to an F-test, and the range of the fitted temperature could not be well constrained. Therefore we consider this potential thermal component insignificant in the spectra.
Given the relatively high source detection limit () and the relatively low spatial resolution, the bulk of expected galactic X-ray sources of NGC 2613 are still embedded in unresolved emission. Indeed, only four sources (in addition to the nucleus) are detected within the ellipse of the galaxy. We jointly fit the accumulated spectra of these four sources extracted from individual detectors. Circles with radii of twice the 50% EER around individual sources are used to accumulate the spectra. Corresponding background spectra are extracted from the source-removed ellipse. We find that an absorbed power-low model fits the spectra well, giving a best-fit photon index of and an intrinsic 0.3-10 keV luminosity of . The slope of the power-law is typical for X-ray binaries. Given their high luminosities (), on average, these sources are likely ultraluminous X-ray binaries.
3.2 Unresolved X-ray emission
3.2.1 Spatial distribution
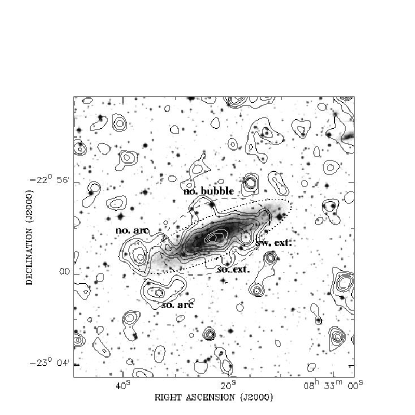
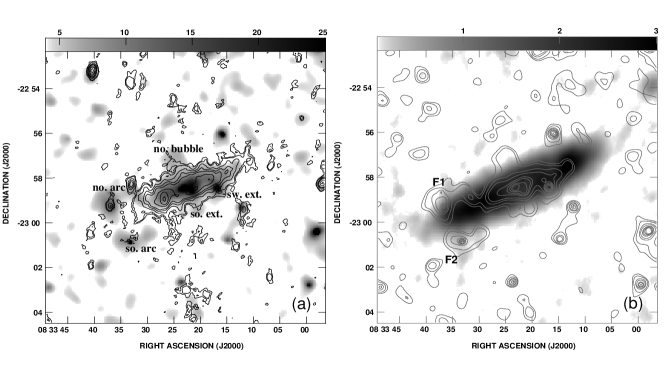
As an overview, Fig. 4 shows the large scale 0.5-2 keV X-ray emission around NGC 2613 and its similarity with the optical disk. Along the major axis of the disk, the emission appears rather smooth and is confined within 25 from the galactic center. Whereas along the direction perpendicular to the disk, some extended features are present, forming well-defined structures. To the north of the disk (Fig. 4) is a “bubble-like” feature, which is referred to as the ‘north bubble’ in the following. This feature follows the minor axis fairly well and has a maximum extent of (13 kpc) from the nucleus. Immediately on the opposite side of the nucleus is another extension that is somewhat smaller, reaching . This feature will be called the ‘south extension’. A third feature protrudes from the south side of the major axis but west of the minor axis. This feature will be called the ‘south-west feature’. Finally two very large extensions are seen to the east of the major axis with emission peaks located at RA= , DEC (north arc), and RA= , DEC (south arc). These have the appearance of arising from the eastern tip of the X-ray disk and will be called the ‘eastern extensions’ consisting of northern and southern arcs. The above features are labelled in Fig. 4 for ease of reference. Most of these features extend significantly beyond the optical disk. Given the extent of the X-ray emission along the major axis and the inclination of the disk, the projected in-disk emission along the minor axis should be within , whereas most of the extended features show an extent larger than 1′. Therefore, we suggest that these features are truly extraplanar. Their origin will be further discussed in § 4.
We remove the detected discrete sources, except for the nucleus, to study the spatial properties of the unresolved soft X-ray emission. The nucleus is kept because it is heavily obscured (§ 3.1) and contributes few photons to the emission below 2 keV. For each faint source with a count rate () 0.01 , we exclude a circular region with a radius of twice the 50% enclosed energy radius (EER). For sources with 0.01 , the radius is multiplied by an additional factor of 1+log(/0.01). The choice of the adopted radii is a compromise between removing the bulk of the source contribution and preserving a sufficient field for the study of unresolved emission. Thus 75-80% of photons from each detected source is removed according to our criteria.
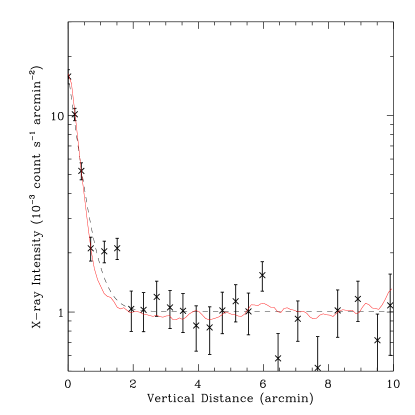
We construct the “blank-sky” background-subtracted, exposure-corrected 0.5-2 keV intensity profile from the source-removed PN image, as a function of off-center distance along the minor axis. The full width along the direction parallel to the major axis used for averaging the intensity is 5′ ( 0.7 ), approximately the maximal extent of the unresolved emission along the major axis (Fig. 4). The profile is shown in Fig. 5. We characterize the profile by an exponential law: , where is the vertical distance from the center, is the scale height and is the central intensity. A constant intensity is included in the fit to account for the discrepancy between the local background and the subtracted “blank-sky” background, and it turns out to be negligible. The results are listed in Table 4. The best-fit model is also plotted in Fig. 5 (black dashed curve). There is an excess over the best-fit model at a vertical distance of 1′-15, which can be attributed to the extraplanar features apparent in Fig. 4. The total count rate produced by this extraplanar excess is .
The unresolved emission should consist of two components: 1) emission from truly diffuse gas, and 2) collective discrete contributions from sources below our detection limit plus some residual counts spilled outside our source removal regions. To constrain the source component, we assume that it follows the distribution of the NIR K-band light of the galaxy, which can be determined from the 2MASS K-band map (Jarrett et al. 2003). We remove from the map bright foreground stars and convolve it with the PSF of the PN. Circular regions used for removing the discrete X-ray sources are also excluded from the map. The K-band vertical profile is then produced in the same manner as for the X-ray profile. To compare the two profiles, we normalize the K-band profile to match the X-ray intensity at the center (Fig. 5). This requires a normalization factor of 3.0. Within a vertical distance of 1′, the K-band profile traces the X-ray profile quite well. An excess over the K-band profile, however, remains at a vertical distance of 1′-15. This is evidence for the presence of extraplanar X-ray-emitting gas.
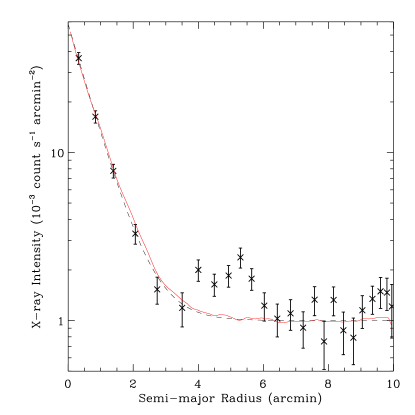
We also construct a 0.5-2 keV radial intensity profile for the unresolved emission. Elliptical photometry is applied, with a minor-to-major axis ratio of 0.29 and a position angle of 113∘ (Jarrett et al. 2003). We again fit the radial profile with an exponential law and list the results in Table 4. The X-ray profile together with the best-fit model is plotted in Fig. 6. Also plotted is the normalized 2MASS K-band radial profile produced in the same way as is done for the X-ray profile. The K-band and X-ray profiles closely trace with each other within a semi-major radius of . At semi-major radii 4′-6′, corresonding to semi-minor radii 11-17, a bump is present, again most likely due to the extraplanar features. The total count rate of this bump is consistent with the extraplanar excess seen in the vertical intensity profile.
3.2.2 Spectral properties
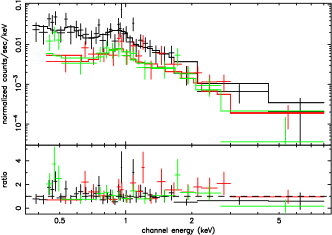
Guided by the X-ray morphology (Fig. 4), a galactocentric 5′ 3′ ellipse with a position angle of 113∘ is adopted to extract the spectra of unresolved emission for individual detectors. The limited number of counts prevents us from further dividing the spectra according to different regions of interest, e.g., the disk and the halo. Discrete sources are removed in the way as described above, except for the nucleus, for which we exclude a circular region with a radius of 40′′ (87% EER) to further reduce the contamination from the hard nuclear emission. We use the same background spectra as applied in § 3.1.
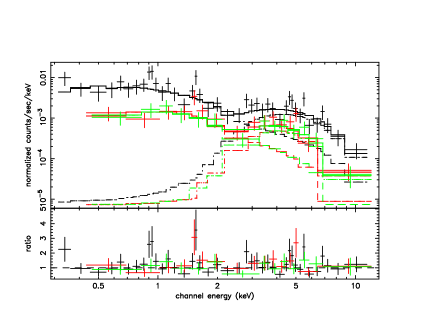
We jointly fit the PN, MOS1 and MOS2 spectra in the 0.3-8 keV range (Fig. 7). Overall, the spectra are much softer than those from the nuclear region, showing clear features at 0.9 keV, corresponding to the Fe L-shell complex, and at 0.5 keV. These features further indicate the presence of diffuse hot gas. At energies above 2 keV the spectra are dominated by a collective contribution from unresolved discrete sources, most likely LMXBs (see § 4.2). We account for this contribution with a power-law (PL) with a photon index fixed at 1.56, as found by Irwin, Athey & Bregman (2003) for the accumulated spectra of galactic LMXBs. This PL, combined with a thermal plasma component (APEC) is then used to fit the spectra. Foreground absorption is again required to be at least the Galactic value. The fit is initialized by fixing the plasma metal abundance at solar. The model, however, yields a poor fit to the spectra, in particular failing to simultaneously account for the features at 0.9 keV and 0.5 keV. By allowing the metal abundance to be fitted, we obtain a statistically better fit but the resulting abundance is low ( 0.05 solar). Such an extremely sub-solar abundance is unphysical and practically often encountered in the X-ray spectral analysis for galaxies (e.g., NGC 253, Strickland et al. 2002; NGC 4631, Wang et al. 2001). We thus add to the model a second APEC component. A two-temperature plasma is effective in characterizing the diffuse spectra of some star-forming disk galaxies (e.g., Strickland et al. 2004a; Tllmann et al. 2006). The abundances for both thermal components are fixed at solar. The fit is acceptable, resulting in a cool component with 0.08 keV and a hot component with 0.8 keV. The 0.3-10 keV X-ray luminosities are 5.2, 2.6 and 1.1 for the three components, namely the discrete sources, the low temperature gas and the high temperature gas, respectively. The above results are summarized in Table 5. We adopt the two-temperature fit as the best-fit model in the following and plot it in Fig. 7.
4 Discussion
4.1 The nature of the nuclear X-ray emission
Our two-component spectral fit for the nucleus (§ 3.1; Table 3) indicates that the intrinsic neutral hydrogen column density is . This is much higher than the beam-averaged HI column density of found by Chaves & Irwin (2001), but it is typical of values found for molecular circumnuclear disks. Ott et al. (2001), for example, find a molecular column density of order for NGC 4945. Molecular data are not yet available for NGC 2613, but our results suggest that a substantial molecular component should be present in this galaxy.
For the nuclear component, the modelled intrinsic flux given in Table 3 leads to an intrinsic X-ray luminosity of in the 0.3-10 keV range. The photon index of this component is 2, a typical value found in the X-ray spectra of AGNs (e.g. Pellegrini, Fabbiano & Kim 2003). No radio core was detected by Irwin, Saikia & English (2000), putting a 3 upper limit of on the radio spectral power at 1.425 GHz within the same 16′′ region. Using the above luminosity over the 0.3-10 keV range, we derive an upper limit of on the energy spectral index () between the radio and X-ray bands. Although the X-ray nucleus is heavily obscured, these values nevertheless suggest that the energy spectral index is likely flat or possibly rising at the low frequencies, a fact again consistent with the interpretation of the nuclear source as an AGN. Thus, we conclude that the nuclear X-ray source represents an AGN in this galaxy, the first evidence that this is the case.
The non-nuclear component, characterized by the second power-law (PL2), shows a photon index of and an intrinsic 0.3-10 keV luminosity of . Irwin et al. (2003) showed that the accumulated spectra of LMXBs in early-type galaxies can be uniformly described by a power-law model with a best-fit photon index of . By using a sample of nearby galaxies of various morphological types, Gilfanov (2004) studied the relation between the collective luminosity of LMXBs and the K-band luminosity, , of the underlying stellar content. He found that, for LMXBs with luminosity higher than , their collective luminosity = . Assuming that the spatial distribution of LMXBs follows that of the K-band star light (Jarrett et al. 2003), we estimate that the collective luminosity of LMXBs within the 16′′ circle is . Thus the non-nuclear component is consistent with the collective emission of unresolved LMXBs. We note that high-mass X-ray binaries (HMXBs) are expected to be present in star-forming disk galaxies and their composite spectral properties are somewhat similar to that of the LMXBs, thus the collective contribution of HMXBs may also be partly responsible for the non-nuclear component. We show below that in NGC 2613 the relative contribution of HMXBs is small as compared to that of LMXBs.
4.2 The collective X-ray emission of discrete sources
It is known that X-ray binaries, including LMXBs and HMXBs, dominate the X-ray source populations with luminosities in galaxies. Owing to their distinct evolution time-scales, the numbers and thus the collective contributions of long-lived LMXBs and short-lived HMXBs to the X-ray emission of a galaxy are expected to be proportional to its stellar mass and star formation rate (SFR), respectively. Colbert et al. (2004) analyzed Chandra observations of X-ray sources in a sample of nearby galaxies of various morphological types and SFRs. They found that the collective X-ray luminosity of point sources is linearly correlated with the total stellar mass and the SFR of the host galaxy as
| (1) |
We use this relation to assess the relative importance of LMXBs and HMXBs in contributing to the X-ray emission of NGC 2613. The total stellar mass can be estimated from the K-band luminosity and the color index via (Bell & de Jong 2001)
| (2) |
where is in units of the K-band Solar luminosity. The SFR can be estimated from the far-infrared (FIR) luminosity via (Kennicutt 1998)
| (3) |
is measured according to (Lonsdale, Helou & Good 1989)
| (4) |
where is the distance of the galaxy in units of Mpc, and are the flux densities in units of Jy at 60 m and 100 m, respectively. With the available photometric data for NGC 2613 (Table 5), we estimate that the total stellar mass is and the SFR is . Based on Eq. (1), the contributions of LMXBs and HMXBs to the collective X-ray emission of discrete sources is and , respectively, with the latter being about 10% of the former.
In the disk of NGC 2613, we find that the 0.5-2 keV unresolved emission is spatially correlated with the K-band star light. Therefore, the normalization factor for the K-band profile (§ 3.2.1) should represent the collective X-ray emissivity of the underlying old stellar population. Using the power-law model given by Irwin et al. (2003) for the accumulated spectrum of LMXBs, we convert the observed 0.5-2 keV count rate into the intrinsic luminosity in the 0.3-10 keV band). The K-band flux density is also converted into intrinsic luminosity according to the 2MASS K-band photometry. The normalization factor, 3.0, is then equivalent to an X-ray emissivity of , or a luminosity ratio of . Gilfanova (2004) found that the collective X-ray luminosity of galactic LMXBs is related to the underlying K-band luminosity following , i.e., a luminosity ratio of . Therefore the collective X-ray emissivity of unresolved discrete sources inferred for NGC 2613 is consistent with that of the galactic LMXBs, and we conclude that the collective X-ray emission of LMXBs dominates the soft emission of NGC 2613 in its disk region.
4.3 The origin of extraplanar gas
Presence of diffuse gas in NGC 2613 is evident by the soft X-ray excess over the K-band light. We consider two possible origins of the diffuse gas: 1) the continuously accreted IGM (Toft et al. 2002) and 2) the outflow from the galactic disk (Irwin & Chaves 2003).
4.3.1 An accreted gaseous halo?
Toft et al. (2002) calculated global X-ray properties (e.g., luminosity, effective temperature and intensity distribution) of hot gaseous halos, based on their simulated galaxies. The predicted luminosity strongly depends on the circular speed of the host galaxy. The most massive galaxies in their simulations have circular speeds similar to that of NGC 2613 ( ). The predicted 0.2-2 keV luminosity for such a galaxy is (Fig. 3 in Toft et al. 2002). From our best-fit spectral models of the spectra of unresolved emission, we derive an intrinsic 0.2-2 keV luminosity of 8 for the sum of the thermal and power-law components, and 6 for the thermal components only. We note that the unresolved emission outside our spectral extraction region contributes little to the total luminosity. The simulated luminosity of gas emission by Toft et al. (2002) is at least an order of magnitude higher than the observed value for NGC 2613. We therefore conclude that the simulations as presented by Toft et al. (2002) substantially over-predict the X-ray emission from the cooling inflow of the IGM, if this is what is occurring in NGC 2613.
This over-prediction is related to the so-called over-cooling problem in current theories of galaxy formation. We speculate that the over-cooling problem is a result of an inappropriate treatment of stellar and/or AGN feedback. For example, the mechanical energy input from Type Ia supernovae (SNe) is typically not included in galaxy formation simulations, partly due to the difficulty in treating the astrophysics related to gaseous flows. Qualitatively, Type Ia SNe, which tend to occur in low-density hot environments, provide an especially effective mechanism for large-scale distributed heating, required to reduce the cooling of gas in galactic bulges and halos (Tang & Wang 2005). Massive stars in galactic disks may also serve as sources of mechanical energy that could produce outflows into halos and help slow down the cooling of the accrected gas. For example, with a star formation rate of for stars between 0.1 and 100 , and assuming a Salpeter IMF and that stars with mass become core-collapse SNe, the rate of total energy release from the star-forming regions of NGC 2613 is . Our spatial and spectral analyses suggest that the extraplanar gas is responsible for the thermal emission (§ 3.2) and has a total 0.3-10 keV luminosity of . Thus, SNe can provide enough energy to explain the X-ray emission of the extraplanar gas in NGC 2613.
4.3.2 Multiwavelength extraplanar features
In Fig. 8a and b, we compare the X-ray emission with the radio continuum emission and HI total intensity emission, respectively. Of the two radio images, the radio continuum morphology more closely resembles the X-ray morphology in the sense that: a) the north bubble has a radio continuum counterpart; b) the south extension also has a radio continuum counterpart; c) the south-west feature shows a small radio continuum protrusion; and d) the peaks of the large eastern extensions (north and south) also show radio emission.
The HI total intensity map shown here does not show all of the extended features identified by Chaves & Irwin (2001), but two of their features, F1 and F2 clearly extend above and below the galactic plane and are labelled in Fig. 8b. These two features might be related with the northern and southern arc of the eastern extensions seen in the X-ray.
It is not wise to read too much into these correlations, given the limited S/N of the maps. However, the relationship with the radio continuum is sufficiently strong that the X-ray emission in the extraplanar features, representing hot diffuse gas, is very likely associated with the radio continuum emission which represents predominantly the non-thermal component.
We further consider the energetics of a specific feature, namely the ‘north bubble’, which is the only extraplanar feature that can be cleanly isolated from the ambient emission. Guided by Fig. 9, we approximate the volume occupation of the bubble by a cylinder with 1′ in diameter and 08 in height, the center of which is 12 above the galactic center. Hence the volume of the bubble is . We find a total 0.5-2 keV count rate of 2.4 within the bubble. In the best-fit model to the spectra of unresolved emission, the high and low temperature components predict a 0.5-2 keV count rate of 7.5 and 2.0, respectively. Therefore the north bubble is unlikely to be due to the low temperature component alone. Instead, it could be dominated by the high temperature component. Taking an effective temperature of 0.8 keV, we estimate the mean density of the bubble to be , where is the filling factor of the hot gas inside the bubble. The total thermal energy of the bubble is , and the work done to steadily lift up the bubble against gravity is , given the gravitational potential introduced by the exponential disk of the galaxy (Irwin & Chaves 2003). Given the morphology and the position of the bubble, we speculate that it was produced near the nuclear region, either by a nuclear starburst or the AGN. If the bubble’s total amount of thermal and gravitational energy is obtained from a starburst, it takes a time of to form the present structure, where is a geometrical factor taken to be 0.1 to reflect a fractional star formation rate of the central 1 kpc in the disk. This timescale is typical for massive stars to become SN explosions. On the other hand, assuming the flux density of the AGN follows between the radio and X-ray bands, the total bolometric luminosity over this frequency range is with adopted (§ 4.1). It is uncertain what fraction of the AGN energy can be taken to energize the ambient gas, but we consider the AGN might also be capable of producing this feature. For example, the locations of the north bubble and south extension immediately on either side of the nucleus are reminiscent of extraplanar loops or lobes seen in nuclear outflow galaxies like NGC 3079 (e.g. Cecil et al. 2002) which is known to have an AGN.
5 Summary
We have analyzed an XMM-Newton observation of the massive edge-on Sb galaxy NGC 2613. We find a deeply embedded AGN in this galaxy. The X-ray spectrum of this AGN can be characterized by a power-law model with a photon-index of 2 and a 0.3-10 keV intrinsic luminosity of 3.3. Linking the X-ray spectral properties of the AGN with the current upper limit at radio frequencies indicates a spectral flattening of the AGN at low frequencies.
The 0.5-2 keV unresolved X-ray emission is found to closely trace the near-IR emission in the disk region, and the X-ray to near-IR luminosity ratio is consistent with that inferred from galactic LMXBs. These two facts together indicate that the bulk of the unresolved emission is produced by the old stellar population of the galaxy, predominantly LMXBs.
A few extraplanar diffuse X-ray features are present in addition to the collective emission from discrete sources traced by the near-IR light. These features can be explained by the presence of hot gas, which can be spectrally characterized by a two-temperature plasma with 0.08 keV and 0.8 keV. The total X-ray luminosity of hot gas is at least an order of magnitude lower than that predicted by current simulations of IGM accretion based on disk galaxy formation models. Thus the extraplanar features are very unlikely to result from IGM accretion.
Instead, morphologically most of these extraplanar features have extended radio counterparts, which are believed to arise from disk-related events. Also, energetically the extraplanar features can be generated by either supernova explosions or the AGN, the latter possibly related to the bubbles above and below the nucleus. Therefore, we conclude that the extraplanar features are most likely formed from outflows from the galactic disk.
Our observation suggests that a proper inclusion of galactic feedback is essential, not only to understanding galaxy formation, but also to its continued evolution. NGC 2613 and galaxies like it provide nearby laboratories that may help to understand the over-cooling problem existing in current galaxy formation simulations.
For J. I., this work has been supported by the Natural Sciences and Engineering Research Council of Canada.
References
- (1) Bell E.F., de Jong R.S., 2001, ApJ, 550, 212
- (2) Benson A.J., Bower R.G, Frenk C.S., White S.D.W., 2000, MNRAS, 314, 557
- (3) Bottema R., 1989, A&A, 225, 358
- (4) Bregman J.N., Houck J.C., 1997, ApJ, 485, 159
- (5) Cecil G., Bland-Hawthorn J., Veilleux S., 2002, ApJ, 576, 745
- (6) Colbert E.J.M., Heckman T.M., Ptak A.F., Strickland D.K., Weaver K.A., 2004, ApJ, 602, 231
- (7) Chaves T., Irwin J., 2001, ApJ, 557, 646
- (8) Dahlem M., Weaver K.A., Heckman T.M., 1998, ApJS, 118, 401
- (9) Dickey J.M., Lockman F.J., 1990, ARA&A, 28, 215
- (10) Gilfanov M., 2004, MNRAS, 349, 146
- (11) Irwin J.A., Athey A.E., Bregman J.N., 2003, ApJ, 587, 356
- (12) Irwin J., Chaves T., 2003, ApJ, 585, 268
- (13) Irwin J., Saikia D.J., English J., 2000, AJ, 119, 1592
- (14) Jarrett T.H., Chester T., Cutri R., Schneider S., Huchra J.P., 2003, AJ, 125, 525
- (15) Kennicutt R.C., 1998, ARA&A, 36, 189
- (16) Lonsdale C., Helou G., Good J.C., 1989, Cataloged Galaxies and Quasars observed in the IRAS Survey, Jet Propulsion Laboratory
- (17) Ott M., Whiteoak J.B., Henkel C., Wilebinski R., 2001, A&A, 372, 463
- (18) Pellegrini S., Baldi A., Fabbiano G., Kim D.-W., 2003, ApJ, 597, 175
- (19) Sanders D.B., Mazzarella J.M., Kim D.-C., Surace J.A., Soifer B.T., 2003, AJ, 126, 1607
- (20) Strickland D.K., Heckman T.M., Weaver K.A., Dahlem M., 2000, AJ, 120, 2965
- (21) Strickland D.K., Heckman T.M., Weaver K.A., Hoopes C.G., Dahlem M., 2002, ApJ, 568, 689
- (22) Strickland D.K., Heckman T.M., Colbert E.J.M., Hoopes C.G., Weaver K.A., 2004a, ApJS, 151, 193
- (23) Strickland D.K., Heckman T.M., Colbert E.J.M., Hoopes C.G., Weaver K.A., 2004b, ApJ, 606, 829
- (24) Tang S., Wang Q.D., 2005, ApJ, 628, 205
- (25) Toft S., Rasmussen J., Sommer-Larsen J., Pedersen K., 2002, MNRAS, 335, 799
- (26) Tllmann R., Pietsch W., Rossa J., Breitschwerdt D., Dettmar R.-J., 2006, A&A, 448, 43
- (27) Wang Q.D., Immler S., Walterbos R., Lauroesch J. T., Breitschwerdt D., 2001, ApJ, 555, L99
- (28) Wang Q.D., Chaves T., Irwin J., 2003, ApJ, 598, 969
- (29) Wang Q.D., 2004, ApJ, 612, 159
- (30) Wang Q.D., 2005, in Braun R., ed., Extraplanar Gas, preprint (astro-ph/0410035)
| Parameter | NGC 2613 |
|---|---|
| Morphologya | SA(s)b |
| Optical sizea | |
| Inclination angleb | 79∘ |
| Position anglec | 113∘ |
| Center positiona | R.A. |
| (J2000) | Dec. |
| B-band magnitude a | 11.16 |
| V-band magnitude a | 10.25 |
| K-band magnitude c | 6.82 |
| 60 m flux (Jy)d | 7.48 |
| 100 m flux (Jy)d | 25.86 |
| Circular speed ()b | |
| Distance (Mpc)b | |
| ( 7.53kpc) | |
| Redshifta | |
| Galactic foreground ()e |
References. — NED; Chaves & Irwin (2001); Jarrett et al. (2003); Sanders et al. (2003); Dickey & Lockman (1990).
| Source | XMMU Name | (′′) | CR | HR | HR1 | Flag |
|---|---|---|---|---|---|---|
| (1) | (2) | (3) | (4) | (5) | (6) | (7) |
| 1 | J083228.57-225840.5 | 5.2 | – | – | B, S | |
| 2 | J083231.32-230254.1 | 4.5 | – | – | S, B | |
| 3 | J083233.69-225922.0 | 3.2 | B, S, H | |||
| 4 | J083235.26-225805.9 | 3.3 | B, S, H | |||
| 5 | J083236.47-225734.6 | 4.0 | – | S, B | ||
| 6 | J083238.91-225942.2 | 3.7 | – | B, S | ||
| 7 | J083241.40-225809.7 | 3.4 | – | – | B, S | |
| 8 | J083241.81-225523.7 | 4.0 | – | – | B, S | |
| 9 | J083241.95-230446.3 | 3.6 | – | B, S | ||
| 10 | J083246.75-230209.9 | 3.6 | – | – | B, S | |
| 11 | J083247.39-230258.2 | 2.1 | B, S, H | |||
| 12 | J083248.13-225441.8 | 3.8 | – | – | B, S | |
| 13 | J083249.89-230206.3 | 3.1 | – | S, B | ||
| 14 | J083252.35-225024.1 | 4.8 | – | – | B | |
| 15 | J083252.35-230038.8 | 3.4 | – | – | B | |
| 16 | J083254.56-225236.7 | 3.5 | – | B, S | ||
| 17 | J083255.26-224605.1 | 6.3 | – | – | B, S, H | |
| 18 | J083255.42-230253.4 | 2.3 | B, S, H | |||
| 19 | J083257.98-230023.9 | 1.5 | B, S, H | |||
| 20 | J083258.24-225202.7 | 2.8 | B, S, H | |||
| 21 | J083259.34-230245.2 | 2.7 | – | – | B, S | |
| 22 | J083305.75-224832.5 | 3.5 | B, S, H | |||
| 23 | J083309.78-224757.0 | 5.2 | – | – | S | |
| 24 | J083310.11-225621.4 | 2.7 | – | – | B, H | |
| 25 | J083312.19-225918.9 | 2.1 | – | B, S | ||
| 26 | J083312.86-225203.9 | 2.6 | – | B, S | ||
| 27 | J083313.50-224816.7 | 4.6 | – | – | B, H | |
| 28 | J083313.96-225013.6 | 4.0 | – | – | B | |
| 29 | J083314.71-230043.2 | 2.5 | – | – | S, B | |
| 30 | J083315.02-225752.9 | 3.1 | – | – | S | |
| 31 | J083315.94-225604.2 | 2.0 | – | B, S | ||
| 32 | J083316.82-225827.7 | 1.2 | B, S, H | |||
| 33 | J083318.20-225211.3 | 2.4 | – | S, B | ||
| 34 | J083322.83-225825.9 | 0.9 | B, H, S | |||
| 35 | J083324.91-224505.1 | 5.5 | – | B, S | ||
| 36 | J083325.49-225843.6 | 2.2 | – | – | B, S | |
| 37 | J083327.32-230103.1 | 2.6 | – | – | B, H | |
| 38 | J083327.49-225851.7 | 2.4 | – | – | B | |
| 39 | J083329.80-230715.8 | 3.6 | – | – | S, B | |
| 40 | J083331.06-225006.6 | 3.5 | – | B, S | ||
| 41 | J083333.15-230050.8 | 1.9 | – | B, S | ||
| 42 | J083334.38-230542.1 | 2.1 | – | B, S | ||
| 43 | J083336.73-225922.2 | 2.9 | – | – | S | |
| 44 | J083337.40-225124.4 | 3.8 | – | – | S | |
| 45 | J083338.72-230155.1 | 2.5 | – | – | B, S | |
| 46 | J083340.39-230529.7 | 3.5 | – | – | B, S | |
| 47 | J083340.73-225056.0 | 4.0 | – | – | B | |
| 48 | J083342.87-225030.0 | 5.0 | – | – | S | |
| 49 | J083350.48-231150.8 | 5.2 | – | – | B, S | |
| 50 | J083351.30-225656.7 | 4.3 | – | – | S | |
| 51 | J083352.03-225306.0 | 3.0 | – | B, S | ||
| 52 | J083352.44-230516.5 | 3.3 | – | – | B, S | |
| 53 | J083352.84-231135.6 | 5.4 | – | – | B, S | |
| 54 | J083353.06-225728.9 | 2.5 | – | B, S | ||
| 55 | J083354.10-230211.9 | 3.1 | – | – | B, S | |
| 56 | J083356.35-230249.5 | 3.4 | – | – | S, B | |
| 57 | J083358.74-230730.8 | 4.3 | – | – | B, S | |
| 58 | J083359.63-230915.8 | 4.0 | – | B, S | ||
| 59 | J083406.25-224808.9 | 5.7 | B, S, H | |||
| 60 | J083410.07-225808.2 | 4.4 | – | – | B, S | |
| 61 | J083416.92-225508.4 | 5.6 | – | – | S | |
| 62 | J083417.03-230448.5 | 5.8 | – | – | B | |
| 63 | J083422.96-225632.9 | 4.8 | B, S, H | |||
| 64 | J083426.43-225921.1 | 5.8 | – | – | S, B | |
| 65 | J083428.17-225454.8 | 6.0 | – | B, S | ||
| 66 | J083428.60-225508.9 | 7.0 | – | H | ||
| 67 | J083430.98-225843.4 | 6.3 | – | – | B, S |
Note. — The definition of the bands: 0.5–1 (S1), 1–2 (S2), 2–4.5 (H1), and 4.5–7.5 keV (H2). In addition, S=S1+S2, H=H1+H2, and B=S+H. Column (1): Generic source number. (2): XMM-Newton X-ray Observatory (unregistered) source name, following the XMM-Newton naming convention and the IAU Recommendation for Nomenclature (http://cdsweb.u-strasbg.fr/iau-spec.html). (3): Position uncertainty (1) calculated from the maximum likelihood centroiding. (4): On-axis source broad-band count rate — the sum of the exposure-corrected count rates in the four bands. (5-6): The hardness ratios defined as , and , listed only for values with uncertainties less than 0.2. (7): The label “B”, “S”, or “H” mark the band in which a source is detected with the most accurate position that is adopted in Column (3).
| Parameter | Value |
|---|---|
| /d.o.f. | 64.6/65 |
| bN | 6.8 (11.4) |
| cN | 12.3 |
| Photon index (PL1) | 2.1 |
| Photon index (PL2) | 1.7 |
| df0.3-10 (PL1) | 41 |
| df0.3-10 (PL2) | 4.2 |
Note. — a. See text for model description; b. Foreground column density in units of , minimum sets at the Galactic foreground value of 6.8; c. Intrinsic column density in units of ; d. Intrinsic 0.3-10 keV flux in units of 10.
| Parameter | Vertical distribution | Radial distribution |
|---|---|---|
| /d.o.f. | 42.4/24 | 65.2/23 |
| aI0 (10-3 cts s-1 arcmin-2) | 15.3 | 57.0 |
| b (r0) (arcmin) | 0.32 | 0.65 |
| cIb (10-3 cts s-1 arcmin-2) | 0.0 | d0.0 |
Note. — a. Central intensity; b. Scale height (length) of the exponential law; c. Local background intensity above the already subtracted “blank-sky” background; d. Fixed at the value obtained from the vertical fit.
| Model | Na | b | Temperaturec | Abundance | Fluxd | /d.o.f. |
|---|---|---|---|---|---|---|
| PL+APEC | 6.8 (7.9) | 1.56 | 0.78 | 1.0e | 7.5 (PL), 1.3 | 81.1/66 |
| PL+APEC | 6.8 (17.9) | 1.56 | 0.84 | 0.02 (0.05) | 3.2 (PL), 4.4 | 57.9/65 |
| PL+2APEC | 6.8 (21.9) | 1.56 | 0.08, 0.81 | 1.0e | 6.5 (PL), 3.2, 1.4 | 62.5/64 |
Note. — a. Column density in units of , minimum sets at the Galactic foreground value of 6.8; b. Power-law photon index, fixed at the uniform value for LMXBs found by Irwin et al. (2003). c. In units of keV; d. Intrinsic 0.3-10 keV fluxes in units of 10; e. In units of solar, fixed.