Further author information: (Send correspondence to S.M.)
S.M.: E-mail: satoki@asiaa.sinica.edu.tw
Elevation angle dependence of the SMA antenna focus position
Abstract
We report the measurement results and compensation of the antenna elevation angle dependences of the Sub-millimeter Array (SMA) antenna characteristics. Without optimizing the subreflector (focus) positions as a function of the antenna elevation angle, antenna beam patterns show lopsided sidelobes, and antenna efficiencies show degradations. The sidelobe level increases and the antenna efficiencies decrease about and a few %, respectively, for every change in the elevation angle at the measured frequency of 237 GHz. We therefore obtained the optimized subreflector positions for X (azimuth), Y (elevation), and Z (radio optics) focus axes at various elevation angles for all the eight SMA antennas. The X axis position does not depend on the elevation angle. The Y and Z axes positions depend on the elevation angles, and are well fitted with a simple function for each axis with including a gravity term (cosine and sine of elevation, respectively). In the optimized subreflector positions, the antenna beam patterns show low level symmetric sidelobe of at most a few%, and the antenna efficiencies stay constant at any antenna elevation angles. Using one set of fitted functions for all antennas, the SMA is now operating with real-time focusing, and showing constant antenna characteristics at any given elevation angle.
keywords:
Antenna, beam pattern, efficiency, focus, gravitational deformation, sidelobe1 INTRODUCTION
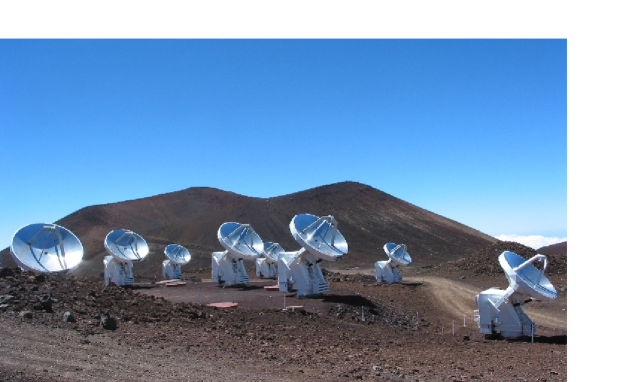
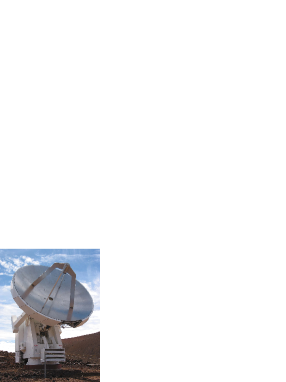
The Submillimeter Array (SMA; left figure of Fig. 1) is the world’s first dedicated submillimeter interferometer, and consists of eight 6 m antennas. It will cover the frequency range of 180–900 GHz with a 2 GHz bandwidth in both upper and lower side bands. An SMA antenna (right figure of Fig. 1) has a 6 m diameter main reflector, and its surface consists of 72 machined cast aluminum panels. These panels are supported by an open backup structure consists of carbon fiber tubes and steel nodes [1]. The secondary reflector (subreflector) is supported by a quadrupod. The main reflector and the quadrupod are deformed by gravity as the elevation angle of the telescope change [2].
|
The gravitational deformation of the main reflector and the position change of the subreflector cause changes of the antenna beam shapes (beam patterns) and the focus positions, and affect the quality of the observational data, especially high frequency observations, extended object imagings, and mosaicing. It is therefore important to figure out the effect of the gravity on the SMA antenna reflectors, and to find out the ways to avoid or compensate these effects. We performed antenna beam pattern and efficiency measurements along various telescope elevation angles (Sect. 2). We then measured the optimized focus positions at various telescope elevation angles, and modeled the focus curves with a simple function (Sect. 3). The optimized focus positions are verified with the measurements of beam pattern and efficiencies using the derived focus curves (Sect. 4). Finally, we apply these results to the real-time subreflector position optimization (Sect. 5).
2 MEASUREMENT RESULTS WITH FIXED FOCUS POSITION
At the early days of the SMA, the subreflector positions were optimized at the elevation angle of . This is due to the setup of holography measurements to adjust the SMA antenna main reflector surfaces. A 232 GHz radiation source (beacon) for the holography measurements is located at the catwalk of the Subaru Telescope, which is located at north-east of the SMA. The near-field focus position is optimized and the surface of a main reflector is adjusted by the holography measurements at an elevation angle determined by the elevation angle of the beacon from the pad on which the antenna was located when the measurements were made, which is about from the SMA inner pads [3, 4]. The far-field focus position is estimated from this near-field focus position, and therefore the far-field focus position is also optimized at the elevation angle of . Furthermore, the subreflector position was fixed at this position in whatever antenna elevation angles. Since the focus position changes with the antenna elevation angle due to the gravitational deformation as mentioned above, antenna beam patterns can be deformed and antenna efficiencies can be degraded as a function of the antenna elevation angle.
2.1 Beam Pattern Maps with Fixed Focus Position
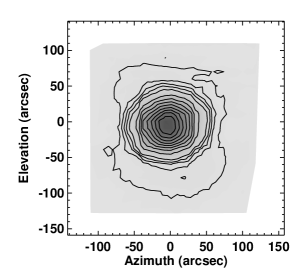
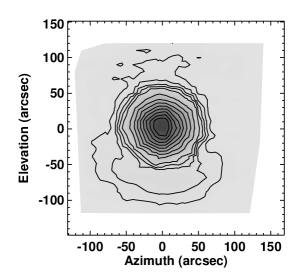
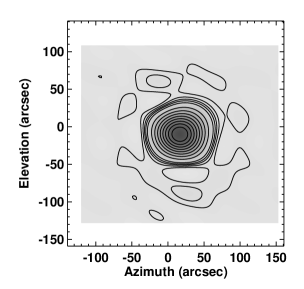
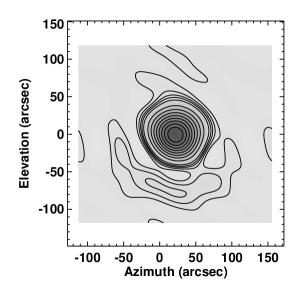
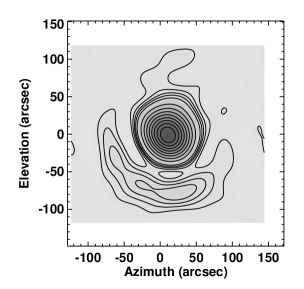
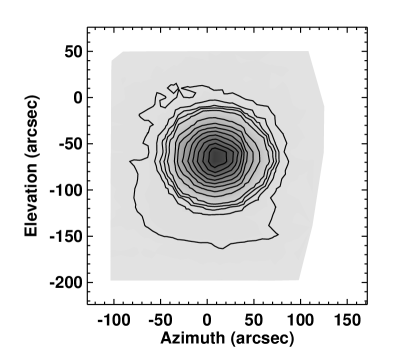
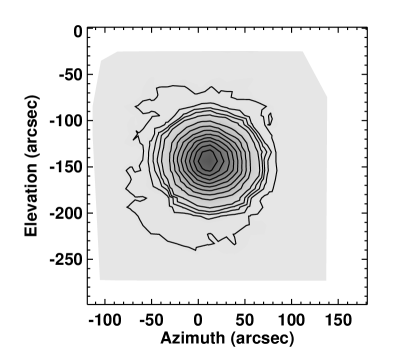
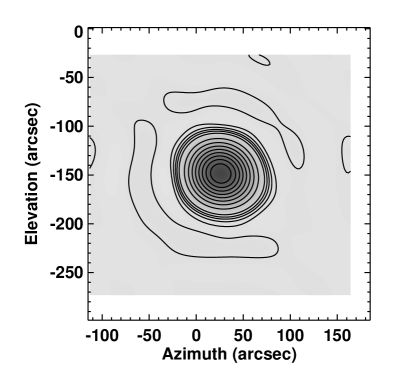
To see the degree of gravitational deformation, we mapped the beam patterns of the SMA antennas. The beam pattern maps were obtained with azimuthal or elevational scans across bright astronomical sources, such as planets. The data taking rate and the scan strip spacing were one-third of the Nyquist sampling of the SMA primary beam size ( at 230 GHz). The beam pattern maps were obtained at various antenna elevation angles with a fixed subreflector position optimized at the elevation angle of . The examples of the beam pattern maps for the antenna No. 4 are shown in the top row of Fig. 2. The top-left map was taken on December 16th, 2000, and the top-middle and top-right maps were on December 9th, 2000. These example maps were taken toward Jupiter with azimuthal scans and with the observing frequency of 237 GHz at local oscillator frequency (232 GHz and 242 GHz for the LSB and USB frequencies, respectively, with the bandwidth of 2 GHz for each sideband). The maps were obtained using a continuum detector, which does not have any sideband separation system, so that the maps have a 4 GHz effective bandwidth.
The bottom row of Fig. 2 shows the deconvolved beam pattern maps (deconvolved with the size of Jupiter) of the top row figures. We used the Jupiter size of and with the position angle of clockwise from azimuth direction for the measurement data of December 9th and 16th, 2000, respectively. We assume the intensity distribution of Jupiter as a uniform disk. At a low elevation angle of (the bottom-left map of Fig. 2), there are sidelobes with at most a few % level in the beam pattern map. However, as the elevation angle increases, a lopsided sidelobe, which locates below the main beam, increases significantly. The bottom-middle and the bottom-right maps of Fig. 2 are taken at the elevation angles of and , respectively, and the peak of the lopsided sidelobe levels are about and , respectively. The peak of the lopsided sidelobe level rises linearly with the increase of the offset of the antenna elevation angle from the subreflector optimized elevation angle of , and the peak of the sidelobe increases about 1% in every change of the elevation angle.

|
|
2.2 Antenna Efficiencies with Fixed Focus Position
In addition to the beam pattern deformation, the gravitational deformation also causes a decrease of antenna efficiencies. We also performed antenna efficiency measurements with observing targets with known temperature, namely planets (Jupiter for these measurements), an ambient load (antenna cabin temperature), and a cold load (liquid nitrogen). The measurement was done on November 17th, 2001 with the SMA antenna No. 7. The measurement frequency was the same as the beam pattern mapping mentioned above. The subreflector position was again fixed at the optimized position at the elevation angle of .
Fig. 3 plots the measurement results of aperture efficiencies as a function of antenna elevation angles. The aperture efficiency with an ideal focus (subreflector) position is about 0.75 around 237 GHz, which is also shown in the figure with a straight solid line. The aperture efficiency of 0.75 around 237 GHz is calculated as follows: The aperture efficiency can be described as
| (1) |
where is an actual aperture efficiency, is an ideal antenna efficiency, is a total antenna surface/optics error, and is an observing wavelength [5, 6]. The ideal aperture efficiency for the SMA antennas is 0.805 [7], and the total SMA antenna surface/optics error at that time was around 27 m. Substitute these numbers with the measurement wavelength of 1.27 mm ( GHz), the actual aperture efficiency can be calculated as 0.75. As you can see in the figure, the aperture efficiency at lower elevation angle is close to the focus optimized efficiency of 0.75 but still lower than this value, and it gradually decreases with the elevation angle away from the optimized elevation angle of .
 |
| Elevation | Aperture Eff. | Main Beam Eff. | No. of data |
|---|---|---|---|
| (degrees) | (%) | (%) | |
| 20 | |||
| 16 | |||
| 14 | |||
| 6 |
Table 1 summarizes the measurement results of aperture and main beam efficiencies at each elevation angle bin. The errors for the efficiencies in the table indicate the standard deviations of the data in each bin. As you can see from the figure and the table, the efficiencies decrease as the elevation angle offset increases from the subreflector optimized elevation angle of . The decrement of the efficiencies is about a few % in every increase of the elevation angle.
3 FOCUS POSITION OPTIMIZATION
Previous section shows that without optimizing the subreflector positions, the antenna characteristics degrade significantly because of the gravity. We therefore needed to find out a way to avoid the degradation.
As mentioned above (Sect. 1), there are two possible reasons for the antenna elevation angle dependences of the SMA antenna beam patterns and antenna efficiencies; one is the gravitational deformation of the main reflector, and the other is the gravitational sag of the subreflector. The gravitational deformation of the main reflector cannot be compensated in real-time, since there are no motors to move the main reflector panels remotely on the SMA antennas. On the other hand, it is possible to move the subreflector remotely in four directions; X (azimuth axis), Y (elevation axis), Z (radio optical axis), and tilt (azimuth axis) directions. It is therefore possible to change the focus positions in real-time, to compensate the effect of the gravitational sag of the subreflector, and to use the focus position that best fits the deformed primary reflector. We therefore measured the optimized subreflector positions, namely focus positions, at various elevation angles for all the SMA antennas (No. 1 – 8).
The measurements were performed toward bright and known structure sources, namely planets (mostly Jupiter, Saturn, and Venus), between 2002 – 2004. The sources were observed at five different subreflector positions in each direction (X, Y, and Z axes) with the point-to-point separation as the Nyquist sampling of the SMA primary beam size ( at 230 GHz). The five output amplitude values of each axis were fitted with a 2nd order polynomial, and the fitted peak value was assume to be the optimized position of each axis. A measurement of each axis took several minutes, and was done by turns. Since this measurement was sensitive to the antenna pointing, single-dish pointings were done every 1 hour or so. We did not optimize the subreflector tilt direction. This is because the tilt direction can be compensate with optimizing the X axis [8].
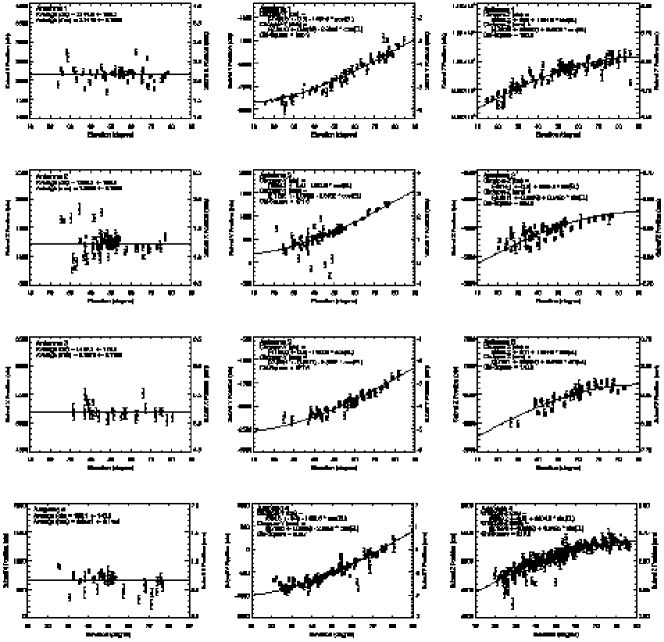
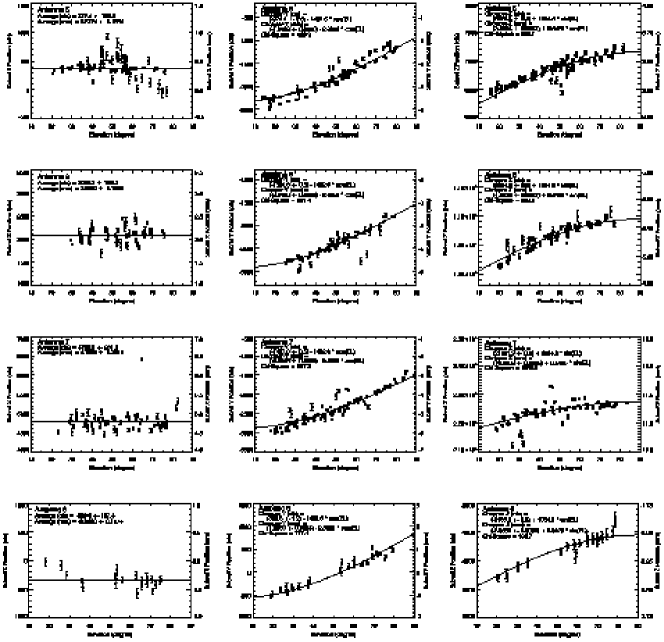
The data points in Fig. 4 show the measured optimized subreflector positions in each axis for all the SMA antennas. All the optimized subreflector (focus) position data plots basically show the same behavior; optimized positions for the X axis (the first column of Fig. 4) do not depend on the antenna elevation angle, but Y and Z axes (the second and the third columns of Fig. 4, respectively) obviously depend on it. The non-dependence of the X axis on the elevation angle can easily be explained, since the X axis is parallel to the elevation axis and therefore should not be affected by changes in elevation angle.
We try to fit a simple function to the elevation angle dependence of the Y axis of the subreflector position (the second column of Fig. 4). We assume a function
| (2) |
where is the measured optimized subreflector Y axis positions, is a zero-point offset, is a coefficient, and is the elevation angle of an antenna. We then fit this function to the data points, and we can fit the data very well. The first term and the second term can be explained as a constant term (DC offset) and a compensation term for the subreflector sag caused by the gravity, respectively.
We also try to fit a simple function to the elevation angle dependence of the Z axis of the subreflector position (the third column of Fig. 4). We again assume a function
| (3) |
where is the measured optimized subreflector Z axis positions, is a zero-point offset, is a coefficient, and is the elevation angle of an antenna. We fit this function to the data points, and again we can fit the data very well. The first term can be explained as a constant term (DC offset). The second term can be understood as follows: When the elevation angle is high, the edge of the primary dish may sag due to the gravity, and the primary dish may deform (open) toward a larger paraboloid [2]. This deformation causes the focus far from the usual, and the optimized subreflector Z axis positions will go to larger values.
The best focus positions for the Y and Z axes of the subreflector move about 2.5 mm and 0.43 mm as the elevation angle changes from to (this range corresponds to the lower and upper elevation angle limits of the SMA antennas). These values are similar to or larger than the SMA operating frequencies of 180 GHz (1.7 mm) to 900 GHz (0.33 mm), so that observe astronomical sources without optimizing the subreflector positions will degrade the data quality significantly.
4 MEASUREMENT RESULTS WITH OPTIMIZED FOCUS POSITION
4.1 Beam Pattern Maps with Optimized Focus Position
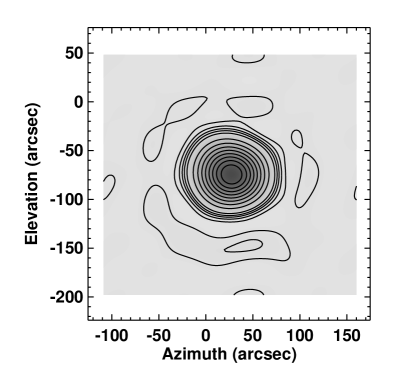
Using the focus curves obtained in the previous section, we performed beam pattern mapping at various elevation angles with optimizing subreflector positions using the SMA antenna No. 4. The top row of Fig. 5 shows the beam pattern maps taken toward Jupiter on December 16th, 2000. The elevation angles were (left column) and (right column), respectively. Other measurement settings are the same as the measurements mentioned in Sect 2.1.
|
|
The bottom row of Fig. 5 show the deconvolved beam pattern maps (deconvolved with the size of Jupiter) of the top row figures. The parameters of Jupiter for the deconvolution is the same as that used in Sect. 2.1. Both of the maps show symmetric beam patterns and low sidelobe levels of at most a few %. Compared with the defocused beam pattern images (Fig. 2), the focus-optimized beam pattern images do not have the lopsided sidelobes, even at high antenna elevation angles. The positions and the intensity levels of these low-level circular sidelobes in the deconvolved beam pattern maps are consistent with those of the first sidelobe of the SMA antenna derived with theoretical SMA beam pattern calculations [9].
4.2 Aperture Efficiencies with Optimized Focus Position
We also performed the aperture efficiency measurements with optimized focus positions. The measurements were done on February 9th and 10th, 2005, with observing targets with known temperature, namely planets (Jupiter and Saturn for these measurements), an ambient load (antenna cabin temperature), and a cold load (liquid nitrogen). The SMA antenna No. 1–4 were used for the measurements, and the measurement frequencies were 230 GHz for February 9th and 345 GHz for February 10th. The subreflector positions were optimized at the measurement elevation angle based on the focus curves obtained in the previous section.
The measurement results are shown in Fig. 6. Left plot is the measurements at 230 GHz, and the right plot is at 345 GHz. The straight solid line in each plot indicates the aperture efficiency with an ideal focus position calculated using Eq. (1) with the same assumption as mentioned at Sect. 2.2 with different frequency for each plot, which is 0.75 for the left plot (230 GHz) and 0.68 for the right plot (345 GHz). As you can see the efficiencies in both frequencies are almost constant at the focus optimized aperture efficiencies in almost all elevation angles with all measured antennas. The decrease at the low elevation angle (lower than ) is not clear, possibly due to atmosphere, but no repeated measurements so far.


|
5 REAL-TIME FOCUS OPTIMIZATION
The disappearance of the lopsided sidelobes in beam pattern maps and the constant aperture efficiencies at most of the elevation with optimizing the subreflector (focus) positions shown in the previous section indicate that most of the gravitational deformation of the SMA antennas can be compensated with optimizing the subreflector positions. To obtain constant antenna characteristics at any given antenna elevation angle, namely at the actual scientific observations, the real-time subreflector position optimization is needed. However, there are several points to concern for the real-time subreflector position optimization with the SMA (and also for other interferometers). First, the gravity term coefficients and in Eq. (2) and (3) have to be the same for all the antennas. If one used the different coefficients for each antenna, the gravity compensation terms (the second terms in Eq. (2) and (3)) will induce additional delay changes, and complicates the delay calculations of the SMA. Second, the zero-point (DC) offsets and is better to use optimized values for each antenna. These terms do not induce any delay changes or other defects on the SMA, so using the optimized values will give the best performance of the antennas. Note that if receiver components, especially SIS chips or horns, have been changed, it is better to re-measure the zero-points offsets. Third, changing the subreflector positions induces the change in the antenna pointing. In case of the SMA antennas, 1 mm change in X and Y axes introduce offset in the sky plane. Therefore, a real-time pointing model correction is also needed. Since the subreflector positions move along the elevation direction, we only need to introduce the pointing model correction for the elevation direction.
To do the real-time subreflector position optimization, we need to find out the common gravity term coefficients. We fitted the functions Eq. (2) and (3) to the measured data points for all the SMA antennas, and calculated the average gravity term coefficients and as the common coefficients. The average values turned to be 2.8052 and 0.5425 in millimeters (1402.6 and 1084.9 in counts) for the coefficients and , respectively. We then fitted the functions Eq. (2) and (3) to the measured data points using the common coefficients derived above (only the zero-point offsets are the free parameters), and the results are shown in Fig. 4 (solid lines). As you can see, all the measured data points can be fitted well (well within the scatters of the data points) with the common coefficients.
Currently, the SMA is operating all the observations with the real-time subreflector (focus) position optimization using these fitted focus curves in Fig 4 with applying all the concerns mentioned above. Measurement of aperture efficiencies and beam patterns with real-time subreflector position optimization show constant efficiencies and low sidelobe levels at all the elevation angles. This strongly indicates the success of the real-time subreflector position optimization.
Acknowledgements.
We would like to thank Scott Paine for valuable comments. Thanks are also due to all the past and present SMA staffs, who helped to measure beam patterns, antenna efficiencies, and focus positions. The Submillimeter Array is a joint project between the Smithsonian Astrophysical Observatory and the Academia Sinica Institute of Astronomy and Astrophysics and is funded by the Smithsonian Institution and the Academia Sinica.References
- [1] P. T. P. Ho, J. M. Moran, and K. Y. Lo, “The Submillimeter Array,” Astrophys. J. 616, pp. L1–L6, 2004.
- [2] P. Raffin, “Analysis of the reflector back-up structure,” SMA Technical Memo 51, 1991.
- [3] T. K. Sridharan, M. Saito, and N. A. Patel, “Holographic surface quality measurements of the Submillimeter Array antennas,” SMA Technical Memo 147, 2002.
- [4] T. K. Sridharan, M. Saito, N. A. Patel, and R. Christensen, “Holographic surface setting of the Sub-millimeter Array antennas,” in Ground-based Instrumentation for Astronomy, A. F. M. Moorwood, M. Iye, ed., Proc. SPIE 5495, pp. 441–446, 2004.
- [5] J. Ruze, “Physical limitations on antennas,” Mass. Inst. Technol. Res. Lab. Electron. Tech. Rept. 248, 1952.
- [6] B. J. Butler, “Requirements for subreflector and feed positioning for ALMA antennas,” ALMA Memo 479, 2003.
-
[7]
S. Paine,
“SMA optics,”
SMA Project Book, 1995.
http://sma-www.cfa.harvard.edu/private/eng_pool/spaine/proj_book_optics/proj_book_optics.html - [8] M. Saito, private communications.
- [9] S. Paine, private communications.