A genuine intermediate-Age Globular Cluster in M33**affiliation: Based on observations obtained with the Hectospec instrument at the MMT Observatory. The MMT Observatory is a joint venture of the Smithsonian Institute and the University of Arizona. Based on observations made with the NASA/ESA Hubble Space Telescope, obtained from the data archive at the Space Telescope Science Institute. STScI is operated by the Association of Universities for Research in Astronomy, Inc. under NASA contract NAS 5-26555.
Abstract
We present deep integrated-light spectroscopy of nine M33 globular clusters taken with the Hectospec instrument at the MMT Observatory. Based on our spectroscopy and previous deep color-magnitude diagrams obtained with HST/WFPC2, we present evidence for the presence of a genuine intermediate-age globular cluster in M33. The analysis of Lick line indices indicates that all globular clusters are metal-poor ([Z/H] ) and that cluster M33-C38 is Gyr younger than the rest of the sample M33 star clusters. We find no evidence for a population of blue horizontal branch stars in the CMD of M33-C38, which rules out the possibility of an artificially young spectroscopic age due to the presence of hot stars. We infer a total mass of for M33-C38, which implies that M33-C38 has survived times longer than some dynamical evolution model predictions for star clusters in M33, although it is not yet clear to which dynamical component of M33 – thin disk, thick disk, halo – the cluster is associated.
Subject headings:
globular clusters: general — galaxies: star clusters — galaxies: evolution — galaxies: formation — galaxies: structure1. Introduction
Star clusters which have survived for several () billion years (intermediate-age clusters) can provide important clues concerning both the evolution history of their parent galaxies and for understanding the destruction processes which erode star cluster systems (e.g., Goudfrooij et al., 2004, and references therein). In the Galaxy, clusters of this age all fall in the category of “old open clusters” (see compilation in Friel, 1995) – they all reside in the Galactic thin disk, and have lower masses (few ) than typical ancient globular clusters (). The oldest of these old open clusters help to pinpoint the age of the thin disk, while the ages and masses of the entire population help constrain the survival rates of clusters in the Galactic disk. Intermediate-age clusters are also known to exist in the Large and Small Magellanic Clouds (LMC and SMC). The LMC contains a population of clusters which are Gyr, while the SMC formed numerous clusters Gyr ago.
In more distant galaxies, it becomes increasingly difficult to establish the presence of intermediate-age clusters, primarily because the techniques available to study compact clusters become more limited. For example, the integrated optical colors of intermediate-age clusters are degenerate with those of ancient ( Gyr) clusters. Although a number of clusters have absorption line index strengths (measured from integrated-light spectroscopy) which suggest that these objects are of intermediate age, their absolute ages cannot be definitively established due to the possible presence of hot stars in the core helium burning stage (hot “horizontal branch” or HB stars). These hot HB stars could potentially boost the Balmer absorption line strengths sufficiently to mimic younger ages for old globular clusters (e.g., Lee & Worthey, 2005; Maraston & Thomas, 2000). Ideally, cluster ages should be determined from deep color-magnitude diagrams (CMDs) which reveal the main sequence turnoff; to date however, this has only been accomplished for a single cluster beyond the Magellanic Clouds (M31-SKHB 312; Brown et al., 2004), using 129 orbits of Hubble Space Telescope (HST) time.
In this Letter, we present integrated-light (optical) spectroscopy for nine ancient star cluster candidates in the nearby spiral galaxy M33. These clusters have deep CMDs available from HST/WFPC2 observations, which clearly reveal the HB morphology. The combination of HB morphology and absorption line measurements result in robust relative age estimates, and are ideal to search for intermediate-age clusters in M33.
2. Data and Analysis
2.1. Integrated-Light Spectroscopy
We obtained integrated spectroscopy for star clusters and cluster candidates in M33 using the MMT/Hectospec instrument (Fabricant et al., 2005) at a dispersion of 1.2 Å pix-1. In addition to clusters, a significant number of background regions were chosen, in order to sample the range of background light provided by the galaxy itself. The clusters were observed on the night of October 27/28, 2005, with four 1100 second exposures (for a total of 73.3 minutes). Each of the 300 Hectospec fibers subtends on the sky. The data were reduced using the HSRED reduction pipeline developed by R. Cool111Available from http://mizar.as.arizona.edu/~rcool/hsred.. All observations were bias subtracted, overscan corrected, and trimmed. The science exposures were flat-fielded and combined together to eliminate cosmic rays, and one dimensional spectra were extracted and wavelength calibrated. The final resolution measured from the FWHM of HeNeAr comparison spectra was Å. Spectra for the entire M33 cluster sample will be presented in a future work. Here, we focus on a subset of nine clusters which have available CMDs reaching below the HB (Sarajedini et al., 1998, 2000, hereafter S00).
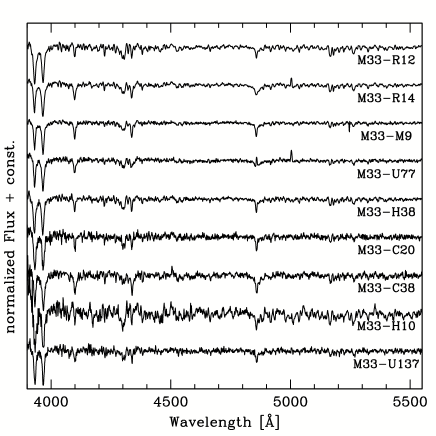
Because the underlying galaxy light within each object fiber can affect the absorption line strengths, we created a mean background spectrum for each cluster. This was accomplished by averaging several background spectra chosen to match the galaxy background level measured in an annulus around each cluster from reduced M33 images provided by the Local Group Survey222http://www.lowell.edu/~masey/lgsurvey.). These customized background spectra were then subtracted from each object. For the nine clusters presented here, the cluster spectra have such high signal-to-noise, that the background subtraction has little impact. In Figure 1 we present integrated, background-subtracted spectra of the globular clusters discussed in this work.
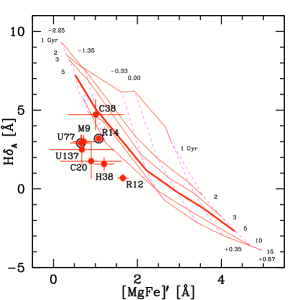
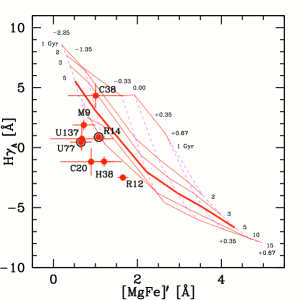
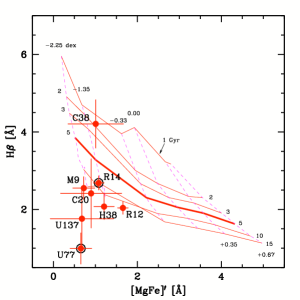
The relative ages and abundances of stellar populations can be estimated from integrated-light spectra, by comparing the absorption line strengths for age and metallicity-sensitive lines. The measurements and accompanying uncertainties are computed using the techniques described in Puzia et al. (2002), for line indices defined in Worthey (1994) and Worthey & Ottaviani (1997). The passband definitions were shifted to account for the radial velocity of each cluster, assuming the measurements given in Chandar et al. (2002). Because no observations of Lick standard stars have been made to date with MMT/Hectospec, we do not calibrate the index measurements to the Lick/IDS system (Burstein et al., 1984), and instead focus on relative cluster ages. A comparison of the line indices measured for the nine clusters presented in this work with predictions of the Thomas et al. (2003, 2004) models is illustrated in Figure 2.
2.2. Color-Magnitude Diagrams
The CMDs for the nine clusters analyzed in this work were originally presented in Sarajedini et al. (2000; hereafter S00). These are based on and observations taken with the HST/WFPC2 instrument. We refer the reader to S00 for details of data acquisition, reduction, and analysis. The CMDs show that only M9 and U77 have blue HB stars; the rest of the M33 clusters in the S00 sample have HBs which lie completely redward of the RR Lyrae instability strip, in the so-called “red clump”.
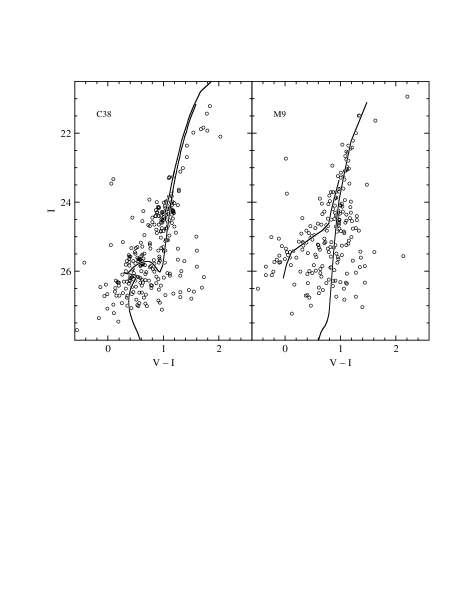
Here, we present new CMDs based on the S00 data for two clusters of particular interest – M9 and C38. These have been radially cleaned, so that blends and other contaminants from the crowded central regions are not included in the CMD. In Figure 3 we show the new CMDs for these two clusters which are further discussed below.
3. Discussion
3.1. Evidence for an Intermediate-Age Cluster
In Figure 2, we show the measurements for the metal-sensitive absorption line index [MgFe]′ versus the age-sensitive Balmer line indices H, H, and H, as is typically done to estimate the ages and chemical compositions of stellar populations from integrated-light spectroscopy (e.g., Puzia et al., 2005a). For comparison, we show simple stellar population (SSP) model predictions from Thomas et al. (2004) for six different ages (solid lines) and six different values of [Z/H] (dashed lines). We also compared the M33 cluster measurements with the solar-scaled SSP model predictions of Bruzual & Charlot (2003) at 4.7 Å resolution (not shown), which yield results consistent with the Thomas et al. (2004) models. All panels in Figure 2 show a “cloud” of points located towards low metallicities and old ages, although we cannot rule out an age spread of the order of , which translates into a Gyr spread at 12 Gyr absolute age. Cluster C38 is clearly offset from the “cloud” in every panel, and clearly appears to have a younger age than the other clusters – recall that our measurements have not been absolutely calibrated to the models, but should be robust in a relative sense. Therefore, Figure 2 implies that C38 is Gyr younger than the other M33 clusters plotted here. Clusters with H seen in emission (R14 and U77) are plotted with different symbols in Figure 2. The Balmer absorption-line strengths for these clusters thus represent lower limits.
Could the stronger Balmer line indices for C38, which suggest a younger age, be due to the presence of blue/hot HB stars? In Figure 3, we show the resolved CMD of C38 based on deep HST/WFPC2 observations for this cluster, and also for M9 (one of the older clusters) for comparison. C38 shows no blue HB stars, while M9 does. Note that the HST observations have sufficient depth and resolution to detect blue HBs if they are present, but they clearly do not exist in C38. Therefore, the presence of hot HB stars, which has been suggested as a plausible explanation for apparent intermediate ages of clusters in different galaxies (such as in M31; Puzia et al., 2005b), cannot be the correct explanation in this case. The line indices and the knowledge of the HB morphology taken together, indicate that it is the age of the cluster which drives the observed Balmer line strengths.
There are two features from the resolved CMD of C38 shown in Figure 3 which add weight to this conclusion. First, S00 found that the absolute I band magnitude of the red clump for this cluster is more luminous than all of the others in their sample, and that this behavior is reasonably well fit by the Gyr theoretical HB models of (Girardi, 1999, see also Figure 26 in S00). Secondly, when the CMD for C38 is cleaned to exclude the most crowded central regions, there appears to be a hint of a main sequence turnoff (MSTO) in the CMD, as illustrated in the left panel of Figure 3. In contrast, M9 does not show evidence for a MSTO. Also in this figure, we show a Z = 0.004 isochrone at an age of 2 Gyr from Girardi et al. (2000) for comparison. Taken together with the spectroscopic results and the abnormally bright red clump, the presence of a MSTO in the CMD of C38 provides strong evidence that C38 is a genuine intermediate-age ( Gyr) star cluster in M33.
3.2. Properties of M33-C38
Here we compile known properties of M33-C38. This cluster lies at a projected distance of kpc from the center of M33, has a total -band magnitude of 18.01 and 0.73 and colors (Christian & Schommer, 1988; Chandar et al., 1999, 2002). S00 estimated that it has an [Fe/H] of from the slope of the red giant branch, which is consistent with our spectroscopy given the uncertainties ([Fe/H]).
Chandar et al. (2002) measure a radial velocity of km/s for this cluster. The local H i (disk) velocity at the location of C38 is found to be km/s from the radio maps of Warner et al. (1973). Although the cluster velocity measurement deviates from the local disk motion in Figure 3 of Chandar et al. (2002), (showing a comparison of cluster velocities versus the local disk motions relative to cluster age, C38 falls in a region which is ambiguous as to which M33 component C38 belongs, clusters with the most deviant velocities are almost certainly in a halo/thick disk component). Therefore, this object could belong to either the thin disk or a halo/thick disk component. Implications for these possibilities are discussed in the next section.
Unfortunately M33-C38 does not have any published ratios, which would provide a direct estimate of its total mass. There are, however, published values for three of the clusters presented in this work (H38, M9, and R12; Larsen et al., 2002). They have an average , which is consistent with measurements for Galactic GCs (McLaughlin, 2000). The integrated spectra presented here corroborate that these objects are ancient, even though their exact ages are not known. Given the fact that decreases with decreasing age, as an upper limit for C38 we take the highest value found empirically by Larsen et al. (2002) of . As a lower limit, we assume the value predicted by the Bruzual & Charlot (2003) models at an age of 2 Gyr and for a low metallicity system (). Assuming a foreground reddening mag towards M33 and a distance modulus of 24.64 mag, we estimate that C38 has a mass in the range . This is about an order of magnitude higher than the masses for old Galactic open clusters, and within the range of ancient globular clusters.
3.3. Implications of Intermediate-Age Clusters in M33
The confirmed presence of an intermediate-age cluster in M33 has important implications for star/cluster formation processes in spiral galaxies, regardless of which structural component C38 belongs to. Below we explore the implications of the presence of intermediate-age clusters in both a thick disk versus halo component, and also in the thin disk.
If C38 belongs to either a thick disk or halo component, it is likely that at least a few of the other clusters in our sample belong to the same structural component, so that a relatively large age spread among M33 clusters would be present in that component. In the Galaxy, halo GCs are known to be old and have an age spread of only Gyr, whereas the GCs associated with the thick disk are essentially coeval (De Angeli et al., 2005). We suggest that a large age spread for M33 clusters would favor a halo over a thick disk origin, for the following reasons. The thick disk in the Milky Way is relatively metal-rich, and believed to have formed during a single event, likely the accretion of a relatively massive satellite galaxy which puffed up the disk (e.g. Morrison, 1993; Abadi et al., 2003; Martin et al., 2004). Such an origin for a thick disk in M33 would imply that clusters in M33 formed for many Gyr relatively undisturbed in the disk, until several Gyr ago when an accretion event took place, resulting in a thick disk with a cluster population spanning a large range of ages. Given that to date there is no evidence for such an event in M33, and that this type of scenario would require that no significant merging occurred before or since, we suggest that it is unlikely that clusters residing in a thick disk would have an age spread of several Gyr.
Therefore, the presence of C38 seems to favor a halo component over a thick disk component. This would point to a longer timescale for the buildup of the M33 halo relative to that found for the Milky Way, as suggested previously by S00 and Chandar et al. (2002).
If instead of the halo/thick disk, C38 resides in the thin disk of M33 (the velocity measurements are ambiguous in discriminating between these two possibilities), the intermediate age of this object also has important implications. First, this would confirm the presence of relatively massive, intermediate-age disk clusters, which are not widely observed in our own Galaxy (but might be hidden behind large columns of dust). Second, the ability of massive clusters ) to survive in the disk of M33 has been suggested to be limited to Gyr. Lamers et al. (2005) used cluster samples in M33 and their theory of cluster dissolution (e.g. Boutloukos & Lamers, 2003) to estimate directly from the cluster age and mass distributions the ability of clusters to survive in different environments. For M33, they find that clusters will disrupt in years ( Myr), and that a cluster will disrupt in Gyr. Mass estimates for C38 put it at . Although we do not know its precise age, it appears that C38 has likely survived times longer than this prediction. Regardless, if C38 is part of M33’s thin disk, this points to the formation of a star cluster which is more massive than known counterparts of a similar age in the Local Group, and also to the ability of such an object to survive disruption forces in the environment of M33 for several billion years.
References
- Abadi et al. (2003) Abadi, M. G., Navarro, J. F., Steinmetz, M., & Eke, V. R. 2003, ApJ, 597, 21
- Boutloukos & Lamers (2003) Boutloukos, S. G., & Lamers, H. J. G. L. M. 2003, MNRAS, 338, 717
- Brown et al. (2004) Brown, T. M., Ferguson, H. C., Smith, E., Kimble, R. A., Sweigart, A. V., Renzini, A., Rich, R. M., & VandenBerg, D. A. 2004, ApJ, 613, L125
- Bruzual & Charlot (2003) Bruzual, G., & Charlot, S. 2003, MNRAS, 344, 1000
- Burstein et al. (1984) Burstein, D., Faber, S. M., Gaskell, C. M., & Krumm, N. 1984, ApJ, 287, 586
- Chandar et al. (1999) Chandar, R., Bianchi, L., & Ford, H. C. 1999, ApJ, 517, 668
- Chandar et al. (2002) Chandar, R., Bianchi, L., Ford, H. C., & Sarajedini, A. 2002, ApJ, 564, 712
- Christian & Schommer (1988) Christian, C. A., & Schommer, R. A. 1988, AJ, 95, 704
- De Angeli et al. (2005) De Angeli, F., Piotto, G., Cassisi, S., Busso, G., Recio-Blanco, A., Salaris, M., Aparicio, A., & Rosenberg, A. 2005, AJ, 130, 116
- Fabricant et al. (2005) Fabricant, D., et al. 2005, PASP, 117, 1411
- Friel (1995) Friel, E. D. 1995, ARA&A, 33, 381
- Girardi (1999) Girardi, L. 1999, MNRAS, 308, 818
- Goudfrooij et al. (2004) Goudfrooij, P., Gilmore, D., Whitmore, B. C., & Schweizer, F. 2004, ApJ, 613, L121
- Johnson & Bolte (1998) Johnson, J. A., & Bolte, M. 1998, AJ, 115, 693
- Lamers et al. (2005) Lamers, H. J. G. L. M., Gieles, M., & Portegies Zwart, S. F. 2005, A&A, 429, 173
- Larsen et al. (2002) Larsen, S. S., Brodie, J. P., Sarajedini, A., & Huchra, J. P. 2002, AJ, 124, 2615
- Lee & Worthey (2005) Lee, H.-c., & Worthey, G. 2005, ApJS, 160, 176
- Maraston & Thomas (2000) Maraston, C. & Thomas, D. 2000, ApJ, 541, 126
- Martin et al. (2004) Martin, N. F., Ibata, R. A., Bellazzini, M., Irwin, M. J., Lewis, G. F., & Dehnen, W. 2004, MNRAS, 348, 12
- McLaughlin (2000) McLaughlin, D. E. 2000, ApJ, 539, 618
- Morrison (1993) Morrison, H. L. 1993, AJ, 105, 539
- Puzia et al. (2002) Puzia, T. H., Saglia, R. P., Kissler-Patig, M., Maraston, C., Greggio, L., Renzini, A., & Ortolani, S. 2002, A&A, 395, 45
- Puzia et al. (2005a) Puzia, T. H., Kissler-Patig, M., Thomas, D., Maraston, C., Saglia, R. P., Bender, R., Goudfrooij, P., & Hempel, M. 2005a, A&A, 439, 997
- Puzia et al. (2005b) Puzia, T. H., Perrett, K. M., & Bridges, T. J. 2005b, A&A, 434, 909
- Sarajedini et al. (1998) Sarajedini, A., Geisler, D., Harding, P., & Schommer, R. 1998, ApJ, 508, L37
- Sarajedini et al. (2000) Sarajedini, A., Geisler, D., Schommer, R., & Harding, P. 2000, AJ, 120, 2437
- Thomas et al. (2003) Thomas, D., Maraston, C., & Bender, R. 2003, MNRAS, 339, 897
- Thomas et al. (2004) Thomas, D., Maraston, C., & Korn, A. 2004, MNRAS, 351, L19
- Warner et al. (1973) Warner, P. J., Wright, M. C. H., & Baldwin, J. E. 1973, MNRAS, 163, 163
- Worthey (1994) Worthey, G. 1994, ApJS, 95, 107
- Worthey & Ottaviani (1997) Worthey, G., & Ottaviani D.L. 1997, ApJS, 111, 377