Toward Understanding the origin of the Fundamental Plane for Early-Type Galaxies.
Abstract
We present a panoramic review of several observational and theoretical aspects of the modern astrophysical research about the origin of the Fundamental Plane (FP) relation for Early-Type Galaxies (ETGs). The discussion is focused on the problem of the tilt and the tightness of the FP, and on the attempts to derive the luminosity evolution of ETGs with redshift. Finally, a number of observed features in the FP are interpreted from the standpoint of a new theoretical approach based on the two-component tensor virial theorem.
keywords:
Celestial Mechanics, Stellar Dynamics; Galaxies: Clusters.1 INTRODUCTION
The long-debated question of how many physical independent parameters can be used to describe the overall observational manifold of galaxies, arose approximately 30 years ago, in particular with a pioneering paper by Brosche (1973). Performing a principal component analysis (PCA) on a sample of spirals with known rotation curves, morphological types, absolute luminosities, colors and [HI] masses, a surprising result arose, that only 2 independent parameters dominate most of the variance of the related manifold. Brosche et al. (1988) proved the possibility to scale all the main integral galaxian properties with two parameters, e.g. mass and angular momentum. Since then, the multivariate analysis on galaxian parameters has been carried out by many authors (e.g., Lentes, 1983; Efstathiou and Fall, 1984; Whitmore, 1984; Okamura et al., 1984), substantially confirming the earlier conclusion. An application of PCA to early-type galaxies (ETGs) yielded a similar result (Brosche and Lentes, 1983), providing additional support to two previously discovered correlations, involving residuals from the Faber-Jackson (FJ) relation, (e.g., Faber and Jackson, 1976). More precisely, the correlations are between (i) residuals in total luminosity, , and metallicity index, (Terlevich et al., 1981), and (ii) residuals in central projected velocity dispersion, , and mean effective surface brightness, (de Vaucouleurs and Olson, 1982).
At that time, the idea that ETGs belong to a family of stellar systems controlled by a single parameter, where their physical properties scale according to luminosity (mass), was supported by several observational evidences: the large degree of homogeneity of galaxy light profiles (well represented by the de Vaucouleurs law), the uniform color-magnitude diagrams, the existence of the FJ relation and of the Kormendy relation (KR, Kormendy, 1977), , between the effective radius, and .
The above simple scenario started to change when Djorgovski and Davis (1987) and Dressler et al. (1987), taking advantage of a large sample of ETGs with available photometric and kinematical data, derived simultaneously the observational evidence that three physical parameters, , , and , are mutually correlated and unified in a 2-dimensional manifold, since then called Fundamental Plane (FP). In this framework, both FJ and KR were interpreted as projections of the FP along the coordinate axes, which provides a natural explanation to the second, mysterious, “hidden parameter”.
Current astrophysical observations and theoretical speculations have widely extended the spectrum of the structural and dynamical parameters that can be measured or calculated within galaxies, including both the visible stellar (baryonic) component, B, and the invisible dark matter (DM) component, D. Despite this large zoo of parameters, it is very surprising that the main dimensionality of this manifold remains 2. In other words, the cloud of points in the parameter space whose axes are size (mass, luminosity, or radius), density (or surface brightness) and temperature (i.e. kinetic energy per unit mass), does not populate uniformly the three dimensional space, but is distributed approximately along a plane where the scatter maintains small.
The current paper aims to briefly review the most relevant attempts to explain the origin of the FP for ETGs. The mere existence of the FP does indeed indicate that structural properties in ETGs span a narrow range, suggesting some self-regulating mechanism must be at work during formation and evolution. The most relevant observational features of the FP are the tilt with respect to what is expected from one-component scalar virial theorem and homology (see section 2), and a small thickness called tightness (see section 3). According to observations, the scatter around the FP is very low, and the position of a galaxy above or below the plane is independent of galaxy flattening, isophotal twisting, velocity anisotropy, and details of radial light distribution. The small thickness corresponds to about 12% uncertainty in , implying the FP is a good distance indicator (e.g., Blakeslee et al., 2002).
The paper is organized as follows. In section 2 we review the most relevant works that in the last years provided new data for the FP at different wavelengths, redshifts and environments. Special effort is devoted to both the KR and the -space. The latter makes a very interesting and debated representation of the FP, built up by Bender et al. (1992) using a different set of orthogonal variables. In section 3 we summarize the most important theoretical attempts devoted to explain the origin of both the tilt and the tightness of the FP. We will address, in particular, the role of anisotropy and rotation in the stellar velocity distribution, the weak deviation of stellar systems from homology, the role of Initial Mass Function (IMF), the role of DM, and the most relevant aspects of a new theoretical approach which uses the two-component tensor virial theorem for interpreting some of the observed features of the FP. The conclusions are drawn in section 4.
2 The observed properties of the FP
The most diffuse representation of the FP writes:
| (1) |
where , and , are constant coefficients (for each wavelength filter bandpass) derived by means of a multiple regression fit of the effective radius, (encircling half the total luminosity), the central projected velocity dispersion, , and the average effective surface brightness in flux units, 111The exact definition of these parameters is not always univocal in the astronomical literature but is not discussed here. The reader may look at many of the papers cited in the references.. In table 1 we have listed the values of and found in several works appeared in literature.
| Band | |||
|---|---|---|---|
| Dressler et al. (1987) | B | ||
| Djorgovski and Davis (1987) | B | ||
| Lucey et al. (1991) | V | ||
| Guzmán et al. (1993) | V | ||
| Pahre et al. (1995) | K’ | ||
| Jørgensen et al. (1996) | r | ||
| Hudson et al. (1997) | R | ||
| Scodeggio et al. (1997) | I | ||
| Scodeggio (1997) | I | ||
| Pahre and Djorgovski (1997) | K’ | ||
| Pahre et al. (1998b) | K | ||
| Kelson et al. (2000) | V | ||
| Gibbons et al. (2001) | R | ||
| Bernardi et al. (2003b) | r |
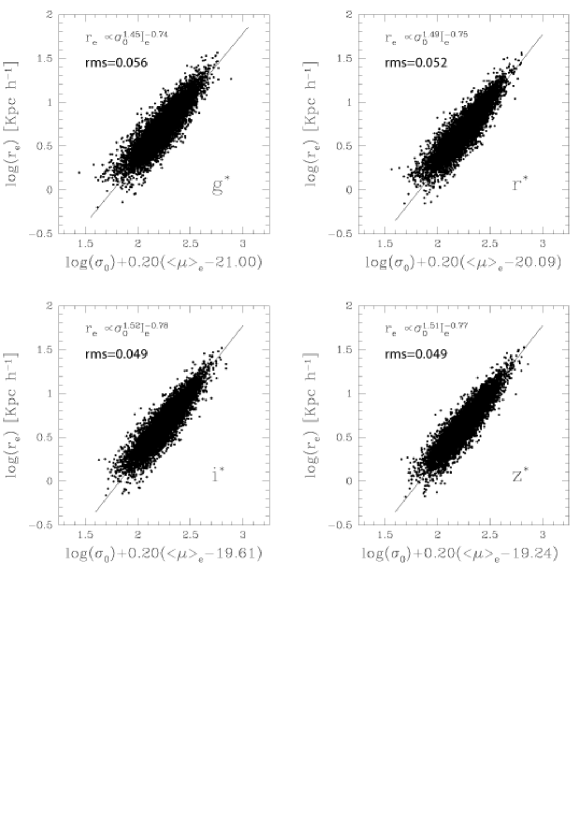
The remarkable fact is a substantial variation of in the various filter bandpasses, as opposed to an almost constant value of . The wavelength dependence of is also clearly visible in Fig. 1, which shows the distribution of about ETGs extracted from the first release of the SLOAN digital sky survey (see Bernardi et al., 2003b). The values of and do not agree with what is expected from one-component scalar virial theorem and homology, which makes the well known problem of the tilt of the FP.
For a virialized one-component stellar system, the scalar virial theorem reads:
| (2) |
where is the mass, the gravitational radius 222This definition appears ambiguous, as it is often used for the Schwartzschild radius . A better definition appears to be the following. Given a bound matter distribution with total mass, , and gravitational potential energy, , the isothermal radius, , is the radius of a truncated isothermal sphere with equal mass and gravitational potential energy, ., the mean square velocity dispersion of the stellar system, and the gravitational constant. If ETGs make an homologous family (i.e. they have the same mass distribution and the same kinematics) the following relationships between theoretical and observational quantities can be assumed:
| (3) |
Accordingly, , where the parameter, , maintains the same value for all the members of the whole family. Furthermore, if the total luminosity reads , where the parameter, , maintains the same value for all the members of the whole family, the ratio can be expressed as:
| (4) |
which is equivalent to:
| (5) |
With regard to the assumption of both homology and constant , Eqs. (1) and (5) imply and .
On the other hand, significantly smaller values of and are deduced from Tab.1, in contradiction with previous predictions.
2.1 The wavelength dependence of the FP
Early works on the FP argued that the deviation of the slope from model predictions is due to a weak systematic variation of the ratio of galaxies with their luminosity (or mass). It is a stellar population effect, either in age, metallicity or IMF that has a distinctive signature in the variation of the FP slope with wavelength. According to Pahre et al. (1998b) the slope, , of the FP relation in Eq.(1), increases systematically with wavelength from U band to K band.
An inspection of Tab.1 shows that effective radii in the Near-IR are always smaller than in the optical band, the difference in the FP slope, , being approximately . This result is quite robust (even if the dependence of the FP slope on wavelength is quite small), since it comes from a direct comparison of same galaxies observed in different color bands. The FP slope is obtained either by means of a direct comparison of the fits, either by comparing the more stable quantity , where due to .
The above variation is commonly interpreted in terms of systematic differences in the stellar content along the sequence of ETGs. Color gradients resulting from metallicity gradients may be at the origin of this behavior, but unfortunately current models of star formation (SF) and evolution cannot help enough to this respect.
A similar dependence of the FP slope parameter, , on wavelength has been confirmed by Scodeggio et al. (1998a). Both groups observe that the parameter is very stable with wavelength and equal to about 0.32. Hudson et al. (1997) find in , while Jørgensen et al. (1996) report in Gunn-r. The wavelength dependence of has been also confirmed by the analysis of the data of the SLOAN digital sky survey (Bernardi et al., 2003b).
The above results show that the FP slope is inconsistent with predictions at all wavelengths. The deviation of the Near-IR FP slope from these expectations (virial theorem + homology + constant ) implies that at least one among the assumptions has to be dismissed. More specifically, either the varies from galaxy to galaxy along the FP sequence, or ETGs do not belong to a homologous family.
The advantage of considering the Near-IR band lies in a small dependence on metallicity effects, and then little influence from age-metallicity degeneracy. The modeling proposed by Pahre et al. (1998b) predicts an age and metallicity variation along the ETGs sequence, assigning larger age and lower metallicity to more luminous galaxies and vice versa. The above finding seems to be in contradiction with the theory of hierarchical merging (e.g., Kauffmann, 1996), in which present-day galaxies result from successive merging of small units.
The lack of correlation between the residuals of the Near-IR FP with those of the relation indicates, that the tightness of the FP cannot be ascribed only to age or metallicity effects (Pahre et al., 1999).
2.2 The FP at high redshift
The FP relation, together with the Tully-Fisher relation and the FJ relation, have often been used to constrain the mass evolution of galaxies at increasing redshift. The small scatter of the above mentioned relations implies a small spread in age, approximately of -, and makes them very useful for evolutionary effect analysis.
Studies on evolutionary effects are possible thanks to the high efficiency of the Hubble Space Telescope and the high spectral resolution of big ground based telescopes. The above mentioned investigations aim to discriminate between two traditional galaxy formation and evolution scenarios, namely (i) the monolithic collapse model (e.g., Eggen et al., 1962; Searle et al., 1973), in which galaxies form at very early epochs from the collapse of a protogalactic gas cloud, implying little evolution of the mass function after , and (ii) the hierarchical model in which galaxies continuously form in mergers and the mass function changes in the redshift range, (e.g., Kauffmann et al., 1993). It may safely be expected that inner and denser regions of proto-galaxies underwent something like a monolithic collapse, while outer and less dense regions were accreted via hierarchical clustering.
By exploiting the FP, van Dokkum and Franx (1996) derived the evolution of the ratio from Coma () to the cluster CL0024 (). Their data suggest a decrease of in as increases. A similar trend is expected for the evolution of stellar populations. The luminosity of a stellar population with fixed mass, is expected to change in time as:
| (6) |
where is the formation epoch. To the first order, , where is the IMF slope, but depends also on wavelength and metallicity. Models by Buzzoni (1989) and Worthey (1994) produce and in V band, for various IMF and metallicities. As a result of evolution, the zero point of the FP is expected to change, and if the variation in depends on , the coefficients of the FP must also change. The evolution of as a function of redshift, can be expressed as:
| (7) |
where is the formation epoch of the stellar population, and is the cosmological deceleration parameter. In general, the ratio decreases with redshift as the luminosity increases.
If galaxies evolve passively, i.e. without merging or accretion, then the product, , should remain constant and only the ratio will evolve in time. A great accuracy is therefore required in determining the tilt of the FP at large . Unfortunately, the small sample of galaxies generally observed at high redshift (typically around 10 objects) does not permit a rigorous comparison between FP coefficients at low and high . This is why the sample does not include galaxies of low masses, at high . The difference in the mean mass of galaxy samples results in a strong correlation between the zero point offsets and the tilt values of the FP.
A further effect is that the luminosity function of ETGs does not necessarily evolve in the same way as the ratio. If dissipationless merging occurs frequently, the luminosity of the final product is affected in a stronger way with respect to the ratio. For a correct interpretation of the luminosity function, it is essential to measure and independently. Total masses are notoriously difficult to measure, as scaling relations are used to constrain the evolution of .
Another possible bias has been pointed out by Franx (1995): the fraction of ETGs in clusters may evolve with redshift. Accordingly the set of ETGs at low redshift may be different from the set observed at high . Some of the present-day ellipticals may in fact be spirals at large . A measure of the morphological evolution would be required to take into account the above mentioned effect.
The determination of the luminosity evolution, , is probably the most important difficulty. Its dependence on IMF is a serious problem, since the IMF of ETGs is not well determined yet. The color evolution of galaxies is also linked to both IMF and . For a steep IMF is small, but the color evolution is rapid (see Tinsley, 1980).
Finally, another fundamental assumption has been made, namely a cluster at high will evolve in the cluster at low used for the comparison. In this view, a cluster observed at higher has to resemble as much as possible the real progenitor of the comparison cluster observed at lower . The richness class may play a role in determining the properties of the FP.
In general, the data acquired by several authors in the field of research discussed above, seem to confirm that massive ellipticals existed at high redshifts and were very similar to present-day objects in nearby clusters. A passive galaxy evolution is very consistent with observations.
The methodology under consideration has been extended up to by van Dokkum and Stanford (2003). The results are again consistent with the passive luminosity evolution. For galaxies with masses greater than , the following trend results: , corresponding to a passive evolution of mag at . The formation redshift was found to be , with regard to a model cosmology where and , ignoring selection effects. Again unfortunately, this result is based on a sample of only 3 galaxies.
Massive cluster ETGs appear to have a large fraction of stars that formed early in the history of the universe. It is worth noticing that the scatter in the derived values is large and confirmed by the spread in galaxy colors.
The evolution of ratios of ETGs has also been derived for rich clusters at (e.g., van Dokkum and Franx, 1996; Kelson et al., 1997; Bender et al., 1998), and in the general field out to (e.g., Treu et al., 1999, 2001; van Dokkum et al., 2001). Cluster data show a gradual increase of the mean ratio by a factor of since . The results are still not definitive but indicate that field galaxies have similar with respect to their counterparts in clusters. Field ETGs define a tight FP out to , with similar scatter as in the local sample (e.g., Treu et al., 2001). However, the range of the parameters measured in field ETGs is not sufficiently extended to derive the FP slope. The measured offset changes with redshift and seems to be consistent with the passive evolution of a stellar population, formed in a single burst at . The effective ratio varies as , a little bit faster than observed in clusters ().
The study of the FP for field ETGs can also be important to check the predictions of the hierarchical formation model, since the stellar population of field galaxies is expected to be significantly younger than in clusters.
2.3 The FP and the environment
Several authors have tried to measure systematic differences in the FP built with ETGs populating different clustering scales (e.g., De Carvalho and Djorgovski, 1992; Guzmán et al., 1992; Zepf and Whitmore, 1993). Zepf and Whitmore (1993) first measured the FP for ETGs in compact groups (CGs), deriving tentative evidences of systematic differences. They interpreted the differences as due to lower velocity dispersion of ETGs in CGs. The above conclusion would imply that the galactic environment may play an important role in the process of galaxy formation and evolution. The question has been re-examined more recently by de la Rosa et al. (2001), who did not find any significant difference, as far as the FP is concerned, between ETGs in CGs and in other environments.
The above result adds to earlier findings (Pahre et al., 1998a, b) where no difference was found between ETGs in clusters and in the field as far as the FP is concerned. A similar conclusion has been reached by Kochanek et al. (2000) from the analysis of gravitational lens ETGs in low-density environments. The above mentioned galaxies lie on the same FP of galaxies in clusters at similar redshifts.
The high- formation epoch and the lack of significant differences between field and cluster environment, seems to contradict the hierarchical clustering scenario. The homogeneity observed in the properties of the FP appears to be poorly correlated with the characteristics of the galaxy environment, implying a strong constraint on the age of galaxies in the environments under discussion.
On the other hand, the results of the SLOAN digital sky survey (Bernardi et al., 2003b), seem to indicate that the FP of galaxies belonging to dense regions is slightly different from its counterparts belonging to less dense regions. Of course, the large range of environments covered by the SDSS provides a strong weight to this result. The residuals from the FP at different redshifts show a weak correlation with the local density. Luminosities, sizes and velocity dispersions of ETGs increase slightly as the local density increases, while average surface brightnesses decrease.
Along this vein, by dividing the galaxies belonging to groups into three subsamples according to their parent X-ray luminosity, Khosroshahi et al. (2004) found that larger and more luminous galaxies belong preferentially to luminous groups.
It also seems that the photometric, structural and dynamical properties of ETGs hosting a black-hole in their center, are substantially indistinguishable from their counterparts with no sign of activity (e.g., Falomo et al., 2003; Barth et al., 2003). BL Lac and radio galaxies are also found on the same FP of cluster ETGs by Woo et al. (2004).
2.4 The Kormendy Relation (KR)
The KR projection of the FP in the - plane is discussed here, since it has been often used for determining the luminosity evolution of ETGs. In addition, it has been found useful information on physical mechanisms involved in galaxy merging and accretions, otherwise undetected within the framework of the classical edge-on view of the FP correlation (e.g., Nipoti et al., 2003). Many studies have confirmed that luminous ETGs in clusters approximately follow the relation, , found by Kormendy, with a slope, , and an intrinsic scatter, . However, Capaccioli et al. (1992) found that once the - plane is extended to objects fainter than , it appears divided in two families, named “ordinary” and “bright”. They suggested that the origin of such a dichotomy may be related to mechanisms of formation and evolution. More recently, Graham and Guzmán (2003) claimed that the dichotomy between dwarf and giant ellipticals may be only an artifact, in consequence of using (i) the de Vaucouleurs’ law to fit the galaxy profiles instead of the Sersic law, and (ii) the effective surface brightness parameter, instead of the central surface brightness, .
The KR for “bright” ETGs is considered today as a useful tool to test their luminosity evolution. In particular, the - data for galaxies in clusters at increasing redshift have been claimed to be consistent with a passively evolving stellar population (e.g., Bower et al., 1992; Aragón-Salamanca et al., 1993; Bender et al., 1996; van Dokkum and Franx, 1996; Kelson et al., 1997; Jørgensen and Hjorth, 1997; Ziegler and Bender, 1997; Bender et al., 1998; van Dokkum et al., 1998). On the other hand, some studies have also claimed that the data are consistent with the hierarchical evolutionary scenario (e.g., Kauffmann and Charlot, 1993; Kauffmann, 1996). Working with a large sample of ETGs in three clusters at different redshifts, La Barbera et al. (2003) concluded that the slope of the - relation is almost invariant up to ().
Altogether, the above mentioned results seem to imply that the mechanisms driving the evolution of galaxies in clusters do not significantly affect the distribution of galaxies in the - parameter space. The homogeneity and the invariance with redshift of the distributions under discussion, is also suggested by the analysis of the SLOAN data (Bernardi et al., 2003a). Unfortunately, the knowledge of the luminosity evolution of ETGs implies accurate and homogeneous determinations of the coefficients (zero point and slope) of the FP and the KR, both for local and intermediate/high-redshift clusters. Concerning the latter, Ziegler et al. (1999) showed that the zero point of the KR has a scatter of the same order as the luminosity correction required from stellar synthesis evolutionary models, which makes hard to draw any firm conclusion about the model to be preferred.
The present ambiguity is originated by different aspects of the FP and - relations, which need to be clarified.
-
•
The use of scaling relations to determine cosmological parameters and luminosity evolution of ETGs, is hampered by the problem of the metric of the Universe. Moles et al. (1998) pointed out that the transformation from angular radii to metric sizes depends on the assumed world model. In consequence, luminosity evolution and purely geometrical effects are intrinsically mixed.
-
•
The structural parameters of ETGs, and , are generally derived in different wavebands adopting different techniques (e.g. measuring from the circular or elliptical aperture growth light-curves, adopting a or fit to luminosity profiles, and using different de-convolution techniques to take into account the effect of the seeing).
-
•
In principle, to get consistent and unbiased values of the coefficients of both relationships, one should handle galaxy samples complete either in luminosity (down to a given limiting absolute magnitude) and cluster area coverage.
-
•
Nobody considers the eventuality that an intrinsic scatter of the KR and FP coefficients could exist even among low-redshift clusters, possibly due to different cluster properties (richness, concentration, sub-clustering, galaxy luminosity function, etc.) and evolution histories.
In order to clarify the current state-of-the-art of the KR relation, we plot in Fig. 2 the KR plane, extracted from a sample of 735 ETGs belonging to 20 nearby clusters. The whole data set consists of 269 ellipticals, 347 S0’s, and 119 E/S0’s extracted from Caon et al. (1990, 1994); Jørgensen et al. (1996); Fasano et al. (2002). The bottom panel shows the distribution of different data samples. The solid line is related to fixed absolute magnitude, , in the KR plane. The progressive absence of galaxies in the lower-left region of Fig. 2, reflects the magnitude limits of the samples. On the other hand, the lack of galaxies in the upper-right region of the plot, is telling us something about the physics of galaxies. This region of total avoidance is delimited by a line of equation, (derived empirically as the linear upper envelope, minimizing the average distance of galaxies from the line itself). This is the “Line of Avoidance” (hereafter LOA), an analogous of the “Zone of Exclusion” (hereafter ZOE) described by Bender et al. (1992), who first recognized this feature in the - projection of the -space (see section 2.6).
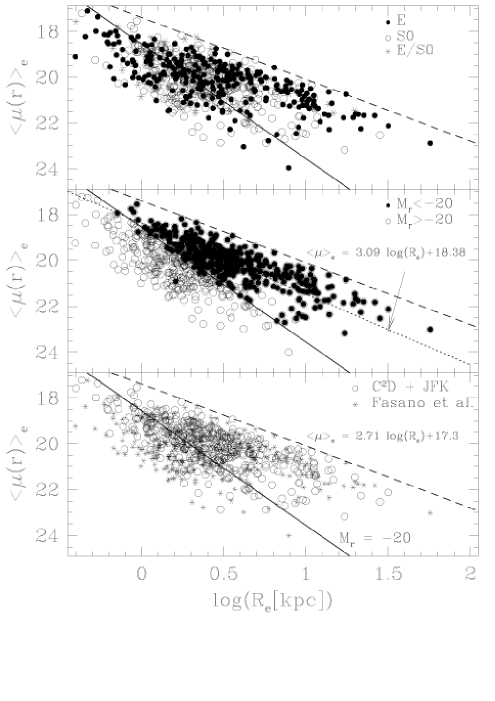
In the middle panel, we note that (i) the region occupied by the bright ETGs in the KR plane has a conic shape, and (ii) an ideal bisector line sharing in two parts the above mentioned region, is very close to the fit of the KR relation (dotted line). One can speculate that the KR may simply arise in consequence of two selection effects: one, due to the fact that no galaxy can live in the “Zone of Avoidance”, and one other, due to the selection of galaxies according to their luminosities (the slope of the line of constant luminosity is indeed steeper than the LOA).
It is also important to stress that the slope of the LOA is close to that of constant central velocity dispersion, . This leads to suspect that the physical meaning of the LOA is essentially related to the existence of an upper limit to the allowed velocity dispersion of ETGs. The occurrence of a maximum may in fact depend on the environment wherein galaxies have been assembled, and/or on the average temperature and density of the Universe at the epoch of formation. Alternatively, one can hypothesize that the LOA is a fully invariant feature of the KR plane, reflecting some universal law of physical equilibrium.
It is obvious that investigations aimed at clarifying whether the parameters of the LOA depend or not (and, if it is the case, how do they depend) on both the environment (field/cluster, global cluster properties) and the redshift, would be of great interest in order to understand the processes involved in the formation and evolution of ETGs. It will be soon possible thanks to the efforts of WINGS (Wide-field Imaging of Nearby Galaxy cluster Sample) survey by Fasano et al. (2005).
2.5 The Photometric Plane
During the last decade, it has been proved that the light distribution of ETGs very closely follows the generalized de Vaucouleurs’ law proposed by Sersic (1968). Accordingly, the radial luminosity profile of a galaxy reads:
| (8) |
where is the central intensity, the effective radius, and is a function of the shape parameter, , chosen to scale the radius, , to enclose half of the total luminosity. An equivalent expression is , where the parameter , depends on the shape of galaxy light distribution. The shape parameter, , is related to both the curvature of light profiles and to the degree of concentration of luminous matter in ETGs and spiral bulges. The concentration index is, in fact, an additional important parameter to be used in characterizing galaxian structures.
With regard to ETGs, Caon et al. (1993) found a correlation between the Sersic index, , and the logarithm of the effective radius, , and between and the total galaxy luminosity. A correlation between and was also been found by Graham (2001). Khosroshahi et al. (2000) showed that a tight correlation exists in the Sersic parameter space defined by the set of coordinates, , with regard to 42 Coma ellipticals and 26 spiral bulges in the Near-IR band. The result is:
| (9) |
which makes the so called Photometric Fundamental Plane (PFP). Working with the B-band data set of Caon et al. (1994), Graham (2002) obtained a similar relation:
| (10) |
which shows a scatter in of per galaxy. Though the PFP has the advantage of avoiding velocity dispersion measurements, still some uncertainties remain with regard to high redshift galaxies, due to difficulties in determining the value of when spatial resolution decreases.
A theoretical interpretation of the PFP and related scaling laws has been tempted by Lima Neto et al. (1999) and Márquez et al. (2000, 2001). After a violent relaxation phase, an elliptical galaxy is assumed to reach a stage in which the entropy of the star fluid is quasi-stationary. The location of E galaxies in the Sersic space can be related to the intersection of two particular surfaces: one, of constant specific entropy (which weakly depends on mass), and one other, of constant galaxy potential energy. The related intersection is defined as the Entropy-Energy line. The consequence is that all galaxies have roughly the same specific entropy, obey the same energy-mass relation, and the Sersic law. From the photometric point of view, E galaxies appear as a one-parameter family, described e.g. by , which is small for giant objects and large for dwarf objects. Some further comments on this approach will be considered in section 3.5.
2.6 The -space
Bender et al. (1992) introduced a new orthogonal coordinate system known as the -space, defined by the following independent variables:
| (11) | |||
which relate to galaxian total mass, , average effective surface brightness, , and mass to light ratio, , respectively.
The above mentioned parametrization of the FP is useful for a number of reasons, namely (i) -variables are expressed only in terms of observables, independent of specific models or assumptions; (ii) the - plane represents an edge-on view of the FP and provides a direct view of the tilt; and (iii) the - plane almost represents a face-on view of the FP.
The SLOAN band data in the -space are shown in Fig. 3. The most important features are the tilt, the tightness, i.e. the nearly constant and very small dispersion of at every location on the FP, and the ZOE, which acts as an upper limit on the location of galaxies on the - plane.

The -space parametrization has been strongly criticized by Pahre et al. (1998a). They first argued that the variable, , attains different values for different wavelengths via the dependence on the effective radius, , which implies different masses for different wavelengths, contrary to what is expected. A second problem comes from the observation, that lowest luminosity ellipticals do not show detectable color gradients (Peletier et al., 1990) suggesting there could be a dependence of color gradients on luminosity (and hence on mass). Accordingly, both and show a dependence on wavelength.
Despite the above mentioned criticism must be taken into consideration, we recognize that the -space is very useful for testing predictions of galaxy formation and evolutionary models. In fact, assuming that only small deviations from homology are possible (e.g. in ETGs), the -space has the advantage that the processes involved in galaxy formation and evolution, can directly be tested by observing the shift of galaxy points in the related frame. For example, Chiosi and Carraro (2002) tested their -body-tree-SPH model simulations of elliptical galaxies by comparison between model and observed galaxy distribution in the -space. They found that model galaxies with different SF history, from small to large ellipticals (producing different mean ages for the bulk of stellar population), are in quite good agreement with observations.
3 The tilt of the FP
Let us summarize different investigations aimed to explain the FP tilt. In the B-band -space representation, Burstein et al. (1997) have given the following relation for the tilt (updated results are shown in Fig. 3, top panel):
| (12) |
The reasons of the deviation from model predictions discussed above, are not yet well established, although several explanations have been proposed in the recent past.
3.1 The role of anisotropy
The effects of radial orbital anisotropy in the velocity distribution of ETGs has been discussed in detail by Nipoti et al. (2002). According to their results, anisotropy contribution is only marginal. Given an isotropic galaxy model lying on the FP, its counterparts where radial orbital anisotropy is sufficiently high, are found to move away. But, at the same time, instabilities set on, and the related end-products fall back again on the FP.
In the conclusions of the authors, a systematic increase of radial orbital anisotropy with galaxy luminosity cannot explain, by itself, the whole tilt of the FP. The above result has been obtained using -Body simulations together with spherically symmetric, both one-component models, and two-component () models. Accordingly, the density profiles obey the law:
| (13) |
where is a normalization constant. The models under discussion depend on five parameters, namely a scaling radius, , a scaling density, (or the total mass, ), the stability parameter, , i.e. the ratio of anisotropy radius333The anisotropy radius, , is very important as the velocity dispersion tensor is mainly radially anisotropic at sufficiently large distances (), nearly isotropic at sufficiently small distances (), and perfectly isotropic at the center (). Accordingly, the velocity dispersion tensor tends to be globally isotropic in the limit, . For further details, see Osipkov (1979); Merrit (1985); Ciotti (1999); Nipoti et al. (2002). to scaling radius for B component, the mass ratio of D to B component, , the ratio of D to B component scaling radius, .
Taking into consideration the tilt expressed by Eq.(12), under the assumption that present-day ETGs are homologous and virialized systems, the following relation holds:
| (14) |
where is the stellar ratio and is a dimensionless factor depending on the stellar density profile, the internal kinematics, the DM amount, and the distribution and relative orientation of the galaxy with respect to the observer’s line of sight (see Ciotti and Lanzoni, 1997). In terms of mass and luminosity, Eq. (14) may be cast under the form (Ciotti and Lanzoni, 1997):
| (15) |
It is apparent that the trend of with luminosity depends on the properties of the parameter, . Given a set of -models which differ only in the value of the stability parameter, , a threshold, , is found to exist, below which initial configurations evolve towards radial instability. Accordingly, the initial configuration related to the threshold value, virializes at a maximum distance from the FP via the - dependence. Initial configurations below the threshold can attain larger distances from the FP, but move back to the FP after virialization following radial instability.
With regard to one-component models, Nipoti et al. (2002) obtained that the end-products, with radial unstable initial conditions, are strongly asymmetric, and their representative points in the -space span a range of values which depend on the line of sight orientation. Further analysis shows that, owing to the above mentioned effect, not only the FP tightness is nicely related to stability, but the FP -by itself - acts as an “attractor” for the end-products of unstable systems, provided initial configurations are placed therein.
With regard to two-component models, a less flattened final stellar distribution has been found especially with massive DM halos. In particular, there is evidence that two-component models with light halos have a similar behavior with respect to one-component models, but massive DM halos tend to prevent the end-products of unstable models to fall back on the FP, the effect being larger for more concentrated halos.
One can now examine whether Eq.(15) can be satisfied with a systematic variation of resulting from an underlying correlation of the stability parameter as a function of galaxy luminosity, , model structure, and .
The FP tilt over the whole observed range ( and , see Fig. 3) cannot be reproduced in dealing with one-component models. In fact, independently of the value of , the allowed variations in correspond to , much smaller than the observed range. If unstable (but consistent) models are also taken into account, the range increases up to allow , which is yet significantly smaller with respect to its counterpart deduced from observations.
With regard to two-component models, DM halo concentration plays an important role in the displacement of end-products. For each family of initial conditions, under the sole requirement of consistency, the end-products yield , again smaller than the observed range (Nipoti et al., 2002).
3.2 The role of weak-homology
If the - correlation discussed in section 2.5 is real and physical, the luminosity profile of ETGs varies according to their size: larger galaxies are more centrally concentrated than smaller ones. In other words, ETGs are not homologous stellar systems, and one of the key assumptions in the interpretation of the FP, i.e. the structural homology, no longer appears to be true.
Bertin et al. (2002) studied a small set of objects characterized by photometric profiles that deviate significantly from the standard law. They argued that ETGs might be considered as weakly homologous systems, on the basis of the observed deviations from the law and the existence of a - correlation.
The normalized mass-luminosity ratio, , no matter how complex the galaxy structure is, turns out to be a well defined function of any two of the observables (, , ). The substitution of the empirical - relation into Eq. (14) allows the following expression:
| (16) |
in terms of and , where and are the FP coefficients appearing in Eq.(1). Equivalent expressions in terms of and , or and , could also be derived.
Accordingly, while the whole set of stellar systems described by Eq.(14) are in virial equilibrium, only the subset for which scales according to Eq.(16) are placed on the FP. Since the exponent of is very small ( in the B-band), the restriction, , allows to explore two different extreme cases, namely (i) strict homology (i.e. identical for all galaxies), which implies , where ; and (ii) constant and weak homology, which implies is a well defined function of and ().
The latter alternative seems to be qualitatively encouraged by observations; in fact the observed excursion, , is consistent with the desired range of . However, a fine-tuning problem remains for changes in .
In conclusion the ranges of variations in and at fixed galaxy luminosity, can be substantial and consistent with an arbitrarily thin FP, but the involved fine-tuning requires a - conspiracy, in the sense that changes in are compensated by special changes in and vice versa. In the conclusions of Bertin et al. (2002), neither strict homology nor weak homology scenario explain the observed FP in a satisfactory and conclusive way.
According to recent investigations (Trujillo et al., 2004), the FP tilt is due for about three fourths to structural non homology and for about one fourth to stellar population effects. In the conclusions of the authors, even very massive ETGs are strongly dominated by DM in their inner regions.
Questioning whether the central velocity dispersion accurately represents the kinetic energy of a galaxy, Busarello et al. (1997) suggested that the contribution of rotation to total kinetic energy in ETGs is not negligible, and rotation is not correlated to velocity dispersion. In the finding of the authors, the kinetic energy of random motions is proportional to instead of , and the shapes of velocity dispersion profiles show a definite trend, where the larger gradient is related to the larger .
The above mentioned result seems to favor a dissipative scenario for the formation of ETGs, in which “hotter” systems underwent more effective cooling. In this view, most of the FP tilt () seems to arise from a sort of dynamical non-homology of the systems, i.e. systematic changes of the relations between observed “local” quantities used to define the FP, and physical “global” quantities appearing in the formulation of the virial theorem.
3.3 The role of IMF and SF
As shown above, if ETGs are homologous and isotropic systems, the FP tilt may simply be attributed to variations of ratio with mass, due to differences in stellar content and IMF. Since current semi-analytical models of ETGs, based on supernova-driven galactic winds and the usual recipes for the IMF, are still unable to explain the FP tilt, Chiosi et al. (1998) explored the idea of an IMF varying with the physical conditions of the interstellar medium. The related model seems able to explain the tilt, leaving aside additional effects.
An alternative viable explanation, investigated by Chiosi and Carraro (2002), is a SF which depends on the mass of the system, where SF starts later (or has a longer duration) in low-mass galaxies, allowing significant variations in mean stellar age with respect to high-mass galaxies.
By exploring the possibility of a systematic change of IMF along the FP, an acceptable explanation of the FP tilt has been found, provided a substantial variation of the IMF is allowed (Renzini and Ciotti, 1993). In addition, the constant thickness of the plane induces unreliable small dispersions in IMF.
Let us define a power-law IMF:
| (17) |
where is the total luminosity in B-band. Accordingly, the ratio is:
| (18) |
where and 100 are the lower and upper stellar mass limit in solar units, respectively. Two cases were considered in the above mentioned paper, namely constant and variable power-law IMF exponent, . In the former alternative, the tilt can be reproduced at the price of an unreasonably high lower stellar mass limit, . In the latter alternative, a variation of at least is needed. Since has a non linear dependence on , one would expect a larger dispersion in for increasing , something like a cone shape distribution along the FP, which is not observed.
By considering synthetic stellar ratios for single burst stellar populations (in different photometric bands as functions of age and chemical composition), Maraston (1999) explored the dependence of on IMF slope. An important effect on metallicity results: increases as metallicity increases. This pattern is evident in U band but disappears in the near-IR. In author’s conclusion, if less bright ETGs exhibit [Fe/H], then metallicity explains approximately of the observed tilt. It is clear, however, that the above mentioned effect has no influence on near-IR passbands, and a different interpretation is needed to explain the tilt to this respect.
3.4 The role of Dark Matter
The role of DM on the FP tilt has been investigated by Ciotti et al. (1996). The investigation tried two different approaches, one ascribing the tilt to a trend in the dark-to-bright mass ratio, , at constant , and the other vice versa. Considering different combinations of empirical profiles representing D and B components, both approaches succeed in explaining the tilt, but a fine tuning is again necessary to reproduce a very small scatter in the FP. The latter alternative is preferred, being ETGs characterized by high surface brightness and stellar density in presence of low effective radii, at the faint end of the FP. Then the above mentioned galaxies show a larger concentration in B component with respect to D component, while the effect is reduced in their counterparts lying on the other end of the FP.
Studying the origin of the small scatter of ETGs around the FP, Borriello et al. (2002) claimed that inside , luminous matter must largely dominate over DM halo in order to keep objects close enough to the FP. In particular, cuspy DM distributions, as predicted by numerical simulations in CDM cosmologies, seem to be in contradiction with the existence of the FP (see section 3.6). The structural properties of dark and luminous matter are interwoven i such a way to produce a curved surface in the space (, , ), instead of a plane. In order to maintain a small scatter in the FP, it is needed either unacceptably low, total dark-to-luminous mass ratios, or DM halo concentrations within the range, , below values related to current predictions. In addition to spiral and dwarf galaxies, cored DM halos where density decreases as at larger radii, are found to be surprisingly successful in explaining ETGs structure, pointing to an intriguing homogeneous scenario of galaxy formation for all morphological types.
3.5 The role of Clausius’ virial maximum
In a series of papers (Secco, 2000, 2001; Marmo and Secco, 2003; Secco and Valentinuzzi, 2004; Secco, 2005) the role of the Clausius’ potential energy is taken into account within the framework of a dynamical explanation to the FP. The analysis has been carried out by the powerful tool of tensor virial theorem (Limber, 1959; Spitzer, 1969; Binney and Tremaine, 1987), extended to two-component systems (e.g., Chandrasekhar, 1969; Brosche et al., 1983; Caimmi et al., 1984; Caimmi and Secco, 1992; Dantas et al., 2000; Caimmi, 2004). Two-component models characterized by different power-law density profiles involving homogeneous cores, have been used for similar and similarly placed spheroids. The outputs of this kind of models were summarized and compared with some observable scaling relations for pressure-supported ellipticals and, in general, for two-component virialized systems.
In this framework, a special (virialized) configuration is identified, and its occurrence is interpreted as a physical reason for the existence of a FP for ETGs. Clausius’ virial energy is maximized by the configuration under discussion, and the related radius (tidal radius) is claimed by the authors to work as a scale length induced by the tidal action of D on B. The above mentioned choice makes a further constraint among physical parameters, and allows to reproduce the exponents, and , of the FP. In addition, the tilt () comes from the - relation linked to a fixed cosmological scenario, instead of different amount of DM from galaxy to galaxy or breaking the strict homology. For assigned values of B and D mass, the special configuration allows two-dimensionality scale relations for each of the three quantities: , , .
It is worth of note that the occurrence of a maximum in the Clausius’ virial is not an universal property of two-component systems, but depends on mass ratio and density profile. Using the model discussed above, the best fit to the FP takes place for a D to B subsystem total mass ratio of about ten. If much lower values were established or deduced from observations, the related model would provide no viable interpretation to the FP.
From the analysis of the dynamic and thermodynamic properties, the authors deduce that the above defined tidal radius works as a confinement for the stellar subsystem, similarly to the tidal radius induced on globular clusters by the hosting galaxy, as von Hoerner (1958) found for the Milky Way. The new result appears as a general extension of the old one to the case of concentric structures. It could add further insight to the fact, that different kinds of astrophysical objects, with a completely different formation history, but subjected to a tidal potential - and then characterized by a tidal radius - lie on the same FP (Djorgovski, 1995; Burstein et al., 1997; Secco, 2003). It should be noted that a tidal radius induced by a tidal potential appears to the authors very similar to the truncation, which King (1966) introduced ad hoc in his primordial models for ellipticals, extrapolating known data for globular clusters. In addition, the exponents, and , and the parameter, , related to the FP, are found to depend only on the inner, universal DM distribution, implying that other families of galaxies or, in general, astrophysical virialized objects, necessarily belong to a similar FP (as observed in the cosmic meta-plane defined by Burstein et al., 1997).
The problem of extending the results from power-law to Zhao (1996) density profiles, which provide a closer fit to elliptical galaxies, is also taken into consideration.
The dynamical approach outlined above diversifies from some other apparently similar approaches (e.g., Lima Neto et al., 1999; Márquez et al., 2000, 2001). In the latter, the stationarity of stellar “gas” entropy is assumed in a pragmatic way without trying a derivation from first principles. With regard to the former, the DM presence is fundamental on two respects. First, it provides a real scale length to the gravitational field induced by the stellar subsystem. Second, it makes possible to deduce, on the basis of mechanical and thermodynamical main principles, how the above mentioned scale length maximizes the entropy of the stellar subsystem.
3.6 The cusp/core problem
Last but not least, the problem we wish to address concerns the connection between a dynamical explanation to the FP and DM distribution within the inner part of halos (e.g., the effective radius ), where most of baryons are located. Current, high-resolution, collisionless numerical simulations both in standard CDM and concordance CDM cosmological models, yield a general consensus about a cuspy density halo profile (at the smallest radii probed by simulations) i.e. , where is close to unity. To this respect a number of discrepancies have been found (e.g., Subramanian et al., 2000; Taylor and Navarro, 2001; Ricotti, 2003), and (e.g., Fukushige and Makino, 1997, 2001; Moore et al., 1998, 1999). On the other hand, Hayashi et al. (2004); Navarro et al. (2004); Power et al. (2003), concluded, by using a suite of high resolution simulations, that remains consistent with simulated halo shapes (they found mean values [;;] respectively), while they claim that cusps as steep as are ruled out (Spekkens et al., 2005).
On the other hand, many observations, by gravitational lensing for galaxy cluster scale (e.g., Sand et al., 2004), and long-slit spectra for dwarf galaxy scale (e.g., Spekkens et al., 2005), suggest that real halos exhibit cores instead of cusps. In particular, Salucci (2001) concludes that halos have cores larger than the corresponding disk scale lengths, from a robust analysis of 137 disk-dominated galaxies.
The related, apparent contradiction makes the so called cusp/core problem. A brief, good review on these topics may be found in the introduction of Spekkens et al. (2005). The results of the theoretical approach presented in the previous section do not agree with the conclusions of Hayashi et al. (2004); Navarro et al. (2004); Power et al. (2003), but are consistent with the observations, which are seriously challenging the cuspy profile.
A recent investigation (Navarro et al., 2004) exploits the possibility of a density profile where the logarithmic slope decreases inward gradually until a minimum value is attained at the center. Accordingly, DM halos can be interpreted as Sersic models (Merritt et al., 2005).
Another enhancement to this respect comes from the papers of Garrido (2003) and Garrido et al. (2004). Using high-resolution rotation curves of spiral galaxies obtained by Fabry-Perot spectroscopy, and modeling DM halos using Zhao density profiles, the authors have shown a very strict limit for the inner slope, . Further analysis on the fit parameters of Garrido (2003) sample from a physical point of view, shows that two-component models where DM halos with different are selected, remain consistent with both CDM and CDM cosmologies (Bindoni, 2005). Preliminary conclusions for the sample considered above, agree with Salucci (2001) results (, till the disk scale length). It should be noted that the order of resolution ranges from hundredths to thousandths of DM virial radius, both for observations and the corresponding fit models, which results to be comparable to, or better than, the best resolved simulations. On the basis of pure theoretical grounds (the Jeans’ equation together with reasonable assumptions on the gravitational potential), Mücket and Hoeft (2003), claim that asymptotic inner slopes of DM halos cannot lie outside the range, . The debate is still open, and further research is needed on this subject.
4 Conclusions
We have reviewed some of the more relevant observational investigations on the FP, and summarized the most important theoretical attempts to explain its tilt and tightness by means of velocity anisotropy, DM fraction, homology, and IMF. None of the above mentioned mechanisms, by itself, is currently able to provide a complete explanation of the observed properties of the FP.
We have shown that starting from the tensor virial theorem extended to a two-component model for ETGs, more insight on the problem can be gained. If a maximum of Clausius’ virial energy is really the key for a dynamic explanation of FP, it appears surprising how the corresponding special configuration links together many of the involved parameters, in such a way that the basic two-dimensionality of the manifold of ETGs is ensured. The main observables , , and , appear to depend on cosmology via (a quantity related to the local slope of the mass variance) implying the projections of the FP (e.g. FJ, KR) also depend on it. Nevertheless, the FP equation is found to degenerate with respect to .
The debate on the origin of the FP is still currently open, but
interesting developments are to be expected as soon as larger field
surveys will be available in the near future.
Acknowledgments This work has partially been supported by Fondazione Cassa di Risparmio di Padova e Rovigo, Piazza Duomo 15, Padova (Italy). We thank an anonymous referee for critical remarks.
References
- Aragón-Salamanca et al. (1993) Aragón-Salamanca, A., Ellis, R.S., Couch, W.J., Carter, D., 1993. MNRAS 262, 764.
- Barth et al. (2003) Barth, A., Ho, L.C., Sargent, W.L.W., 2003. ApJ 583, 134.
- Bender et al. (1992) Bender, R., Burstein D., Faber, S.M., 1992. ApJ, 399, 462.
- Bender et al. (1996) Bender, R., Ziegler, B.L., Bruzual, G., 1996. ApJ 463, L51.
- Bender et al. (1998) Bender, R., Saglia, R.P., Ziegler, B., and 4 coauthors, 1998. ApJ, 493, 529.
- Bernardi et al. (2003a) Bernardi, M., Sheth, R.K., Annis, J., and 28 coauthors, 2003a. AJ, 125, 1849.
- Bernardi et al. (2003b) Bernardi, M., Sheth, R.K., Annis, J., and 28 coauthors, 2003b. AJ, 125, 1866.
- Bertin et al. (2002) Bertin, G., Ciotti L., Del Principe, M., 2002. A&A, 386, 149.
- Bindoni (2005) Bindoni, D., 2005. Master Thesis,University of Padua, Italy.
- Binney and Tremaine (1987) Binney, J., Tremaine, S., 1987. Book Review: Galactic dynamics (Princeton: Princeton Univ. Press), Nature, 326, 219.
- Blakeslee et al. (2002) Blakeslee, J.P., Lucey, J.R., Tonry J.L., Hudson, M.J., Narayanan, V.K., Barris, B., 2002. MNRAS, 330, 443.
- Borriello et al. (2002) Borriello, A., Salucci, P., Danese, L., 2002. MNRAS, 341, 1109.
- Bower et al. (1992) Bower, R., Lucey, J.R., Ellis, R.S., 1992. MNRAS, 254, 601.
- Brosche (1973) Brosche, P., 1973. A&A, 23, 259.
- Brosche and Lentes (1983) Brosche, P., Lentes, F.T., 1983. IAUS, 100, 377.
- Brosche et al. (1983) Brosche, P., Caimmi, R., Secco, L., 1983. A&A, 125, 338.
- Brosche et al. (1988) Brosche, P., Caimmi, R., Secco, L., 1988. Atti e Memorie dell’Accademia Patavina di Scienze, Lettere ed Arti, Vol.C(1987-1988), 5-39.
- Burstein et al. (1997) Burstein, D., Bender, R., Faber, S.M., Nolthenius, R., 1997 ApJ, 114, 1365.
- Busarello et al. (1997) Busarello, G., Capaccioli, M., Longo, G., Puddu, E., 1997. ASP Conf., Vol.116.
- Buzzoni (1989) Buzzoni, A., 1989. ApJS, 71, 817.
- Caimmi et al. (1984) Caimmi, R., Secco, L., Brosche, P., 1984. A&A, 139, 411.
- Caimmi and Secco (1992) Caimmi, R., Secco, L., 1992. ApJ, 395, 119.
- Caimmi (2004) Caimmi, R., 2004. AN, 325, 326.
- Caon et al. (1990) Caon, N., Capaccioli, M., Rampazzo, R., 1990. A&AS, 86, 429.
- Caon et al. (1993) Caon, N., Capaccioli, M., D’Onofrio, M., 1993. MNRAS, 265, 1013.
- Caon et al. (1994) Caon, N., Capaccioli, M., D’Onofrio, M., 1994. A&AS, 106, 199.
- Capaccioli et al. (1992) Capaccioli, M., Caon, N., D’Onofrio, M., 1992. MNRAS, 259, 323.
- Capelato et al. (1995) Capelato, H.V., de Carvalho, R.R., Carlberg, R.G., 1995. ApJ, 451, 525.
- Chandrasekhar (1969) Chandrasekhar, S., 1969. Ellipsoidal figures of equilibrium (New Haven: Yale Univ. Press).
- Chiosi et al. (1998) Chiosi, C., Bressan, A., Portinari, L., Tantalo R., 1998. A&A, 339, 355.
- Chiosi and Carraro (2002) Chiosi, C., Carraro, G., 2002. MNRAS, 335, 335.
- Ciotti et al. (1996) Ciotti, L., Lanzoni, B., Renzini, A., 1996. MNRAS, 282, 1.
- Ciotti and Lanzoni (1997) Ciotti, L., Lanzoni, B., 1997. A&A, 321, 724.
- Ciotti (1999) Ciotti, L., 1999. ApJ, 520, 574.
- Dantas et al. (2000) Dantas, C.C., Ribeiro, A.L.B., Capelato, H.V., de Carvalho R.R., 2000. ApJ, 528, L5.
- De Carvalho and Djorgovski (1992) De Carvalho, R.R. Djorgovski, S.G., 1992. ApJ, 389, L49.
- de Vaucouleurs and Olson (1982) de Vaucouleurs, G., Olson, D.W. 1982. ApJ, 230, 697.
- Djorgovski and Davis (1987) Djorgovski, S.G., Davis M., 1987. ApJ, 313, 59.
- Djorgovski (1995) Djorgovski, S.G., 1995, ApJ, 438,L29.
- de la Rosa et al. (2001) de la Rosa, I.G., de Carvalho, R.R, Zepf, S.E., 2001. AJ, 122, 93.
- Dressler et al. (1987) Dressler, A., Lynden-Bell, D., Burstein, D., Davies, R.L., Faber, S.M., Terlevich, R., Wegner, G., 1987. ApJ, 313, 42.
- Efstathiou and Fall (1984) Efstathiou, G., Fall, S.M., 1984. MNRAS 206, 453.
- Eggen et al. (1962) Eggen, O.J., Lynden-Bell, D., Sandage, A., 1962. ApJ, 136, 748.
- Faber and Jackson (1976) Faber, S.M., Jackson, R.E., 1976. ApJ, 204, 668.
- Falomo et al. (2003) Falomo, R., Kotilainen, J. K., Carangelo, N., Treves, A., 2003. ApJ, 595, 624.
- Fasano et al. (2002) Fasano, G., Bettoni, D., D’Onofrio, M., Kjærgaard, P., Moles, M., 2002. A&A, 387, 26.
- Fasano et al. (2005) Fasano, G., Marmo, C., Varela, J., D’Onofrio, M., Poggianti, B.M., and 7 coauthors, 2006. A&A, 445, 805F.
- Franx (1995) Franx, M., 1995. IAUS, 164, 269F.
- Fukushige and Makino (1997) Fukushige, T., and Makino, J., 1997. ApJ, 477, L9.
- Fukushige and Makino (2001) Fukushige, T., and Makino, J., 2001. ApJ, 557, 533.
- Garrido (2003) Garrido, O., 2003. PhD Thesis, University of Provence, France.
- Garrido et al. (2004) Garrido, O., Amram, P., Carignan, C., Marcelin, M., Balkowski, C., 2004. The many scales in the Universe, Jenam, Granada, Spain.
- Gibbons et al. (2001) Gibbons, R.A., Fruchter, A.S., Bothun, G.D., 2001. AJ, 121, 649.
- Graham (2001) Graham, A.W., 2001. AJ, 121, 820.
- Graham (2002) Graham, A.W., 2002. MNRAS, 334, 859.
- Graham and Guzmán (2003) Graham, A.W., Guzmán, R., 2003. AJ, 125, 2936.
- Guzmán et al. (1992) Guzmán, R., Lucey, J.R., Carter, D., Terlevich, R., 1992. MNRAS, 257, 187.
- Guzmán et al. (1993) Guzmán, R., Lucey, J.R., Bower, R.G., 1993. MNRAS, 265, 731.
- Hayashi et al. (2004) Hayashi, E., Navarro, J.F., Power, C., and 6 cohautors, 2004. MNRAS, 355, 794.
- von Hoerner (1958) von Hoerner, V.S., 1958. ZA, 44, 221.
- Hudson et al. (1997) Hudson, M.J., Lucey, J.R., Smith, R.J., Steel, J., 1997. MNRAS, 291, 488.
- Jørgensen et al. (1996) Jørgensen, I., Franx, M., Kjærgaard, P., 1996. MNRAS, 280, 167.
- Jørgensen and Hjorth (1997) Jørgensen, I., Hjorth, J., 1997. in L.N. da Costa and A. Renzini (eds.), ESO Workshop, p. 175, Springer.
- La Barbera et al. (2003) La Barbera, F., Busarello, G., Merluzzi, P., Massarotti, M., Capaccioli, M., 2003. ApJ, 595, 127L.
- Lentes (1983) Lentes, F.T., 1983. in ESA Statist. Methods in Astron. p 73-76.
- Lima Neto et al. (1999) Lima Neto, G.B., Gerbal, D., Márquez, I., 1999. MNRAS, 309, 481.
- Limber (1959) Limber, D.N., 1959. ApJ, 130, 414.
- Lucey et al. (1991) Lucey, J.R., Bower, R.G., Ellis, R.S., 1991. MNRAS, 249, 755.
- Maraston (1999) Maraston, C., 1999. in ASP Conf. Ser. 163.
- Marmo and Secco (2003) Marmo, C., Secco, L., 2003. NewA, 8, 629.
- Márquez et al. (2000) Márquez, I., Lima Neto, G.B., Capelato, H., Durret, F., Gerbal, D., 2000. A&A, 353, 873.
- Márquez et al. (2001) Márquez, I., Lima Neto, G.B., Capelato, H., Durret, F., Lanzoni, B., Gerbal, D., 2001. A&A, 379, 767.
- Merrit (1985) Merrit, D., 1985. AJ, 90, 1027.
- Merritt et al. (2005) Merritt, D., Navarro, J.F., Ludlow, D., Jenkins, A., 2005. ApJ, 624, L85.
- Moles et al. (1998) Moles, M,, Campos, A., Kjaegaard, P., Fasano, G., Bettoni, D., 1998. ApJ, 495, L31.
- Moore et al. (1998) Moore, B., Governato, F., Quinn, T., Stadel, J., Lake, G., 1998. ApJ, 499, L5.
- Moore et al. (1999) Moore, B., Ghigna, S., Governato, F., Quinn, T., Stadel, J., Tozzi, P., 1999. ApJ, 524, L19.
- Mücket and Hoeft (2003) Mücket, J. P., Hoeft, M., 2003. A&A, 404, 809.
- Navarro et al. (2004) Navarro, J., F., Hayashi, E., Power, C. and 6 cohautors, 2004. MNRAS, 349, 1039.
- Nipoti et al. (2002) Nipoti, C., Londrillo, P., Ciotti, L., 2002. MNRAS, 332, 901.
- Nipoti et al. (2003) Nipoti, C., Londrillo, P., Ciotti, L., 2003. MNRAS, 342, 501.
- Osipkov (1979) Osipkov, L.P., 1979, SvAL, 5, 42-44.
- Pahre and Djorgovski (1997) Pahre, M.A., Djorgovski, S.G., 1997. ASPC, 116, 154.
- Pahre et al. (1995) Pahre, M.A., Djorgovski, S.G., De Carvalho, R.R., 1995. ApJ, 453, 17.
- Pahre et al. (1998a) Pahre, M.A., Djorgovski, S.G., De Carvalho, R.R., 1998a. AJ, 116, 1591.
- Pahre et al. (1998b) Pahre, M.A., De Carvalho, R.R., Djorgovski, S.G., 1998b. AJ, 116, 1606.
- Pahre et al. (1999) Pahre, M.A., Djorgovski, S.G., De Carvalho, R.R., 1999. ASP, Confrence series, 163.
- Peletier et al. (1990) Peletier, R,F., Davies, R.L., Illingworth, G.D., Davis, L.E., Cawson, M., 1990. AJ, 100, 1091.
- Power et al. (2003) Power, C., Navarro, J., F., Jenkins, A., and 5 cohautors, 2003. MNRAS, 338, 14.
- Kauffmann et al. (1993) Kauffmann, G., Withe, S.D.M., Guiderdoni, B., 1993. MNRAS, 264, 201.
- Kauffmann (1996) Kauffmann, G., 1996. MNRAS, 281, 487.
- Kauffmann and Charlot (1993) Kauffmann, G., Charlot, S., 1998. MNRAS, 294, 705.
- Kelson et al. (1997) Kelson, D.D., van Dokkum, P.G., Franx, M., Illingworth, G.D., Fabricant, D., 1997. ApJ, 478, L13.
- Kelson et al. (2000) Kelson, D.D., Illingworth, G.D., van Dokkum, Franx, M., 2000. ApJ, 531, 184.
- Khosroshahi et al. (2000) Khosroshahi, H.G., Wadadekar, Y., Kembhavi, A., Mobasher, B., 2000. ApJ, 531, L103.
- Khosroshahi et al. (2004) Khosroshahi, H.G., Raychaudhury, S., Ponman, T.J., Miles, T.A., Forbes, D.A., 2004. MNRAS, 349, 527.
- King (1966) King, I.R., 1966, AJ, 71(1), 64.
- Kochanek et al. (2000) Kochanek, C.S., Falco, E.E., Impey, C.D., Lehár, J., McLeod, B.A., Rix, H.W., Keeton, C.R., Mu oz, J.A., Peng, C.Y., 2000. ApJ, 543, 131.
- Kormendy (1977) Kormendy, J., 1977. ApJ, 218, 333.
- Okamura et al. (1984) Okamura, S., Kodaira, K., Watanabe, M., 1984. ApJ, 280, 7.
- Renzini and Ciotti (1993) Renzini, A., Ciotti, L., 1993. ApJ, 416, L49.
- Ricotti (2003) Ricotti, M. 2003. MNRAS, 344, 1237.
- Salucci (2001) Salucci, P., 2001. MNRAS, 320, L1.
- Sand et al. (2004) Sand, D., J., Treu, T., Smith, G., P., Ellis, R.S., 2004. ApJ, 604, 88.
- Scodeggio (1997) Scodeggio, M., 1997. PhD Thesis.
- Scodeggio et al. (1997) Scodeggio, M., Giovanelli, R., Haynes, M.P., 1997. AJ, 113, 2087.
- Scodeggio et al. (1998a) Scodeggio, M., Gavazzi, G., Belsole, E., Pierini, D., Boselli, D., 1998a. MNRAS, 301, 1001.
- Searle et al. (1973) Searle, L., Sargent, W.L.W., Bagnuolo, W.G., 1973. ApJ, 179, 427.
- Secco (2000) Secco, L., 2000. NewA, 5, 403.
- Secco (2001) Secco, L., 2001. NewA, 6, 339.
- Secco (2003) Secco, L., 2003. ASPC, 296, 87.
- Secco and Valentinuzzi (2004) Secco, L., Valentinuzzi, T., 2004. The many scales in the Universe, Jenam, Granada, Spain.
- Secco (2005) Secco, L., 2005. NewA, 10, 349.
- Sersic (1968) Sersic, J., 1968. Atlas de Galaxias Australes. Córdoba Obs. Astronomico.
- Spekkens et al. (2005) Spekkens, K., Giovanelli, R., Haynes, M.P., 2005. ApJ, 129, 2119.
- Spitzer (1969) Spitzer, L., 1969. ApJ, 158, L139.
- Subramanian et al. (2000) Subramanian, K., Cen, R., Ostriker, J.P., 2000. ApJ, 538, 528.
- Taylor and Navarro (2001) Taylor, J., E., Navarro, J., F., 2003. ApJ, 563, 483.
- Terlevich et al. (1981) Terlevich, R., Davies, R.L., Faber, S.M., Burstein, D., 1981. AJ, 100, 1416.
- Tinsley (1980) Tinsley, B., 1980. A&A, 89, 246.
- Treu et al. (1999) Treu, T., Stiavelli, M., Casertano, S., Müller, P., Bertin, G., 1999. MNRAS, 308,1037.
- Treu et al. (2001) Treu, T., Stiavelli, M., Bertin, G., Casertano, S., Müller, P., 2001. MNRAS, 326, 237.
- Trujillo et al. (2004) Trujillo, I., Burkert, A., Bell, E.F., 2004. ApJ, 600, L39.
- van Dokkum and Franx (1996) van Dokkum, P.G., Franx, M., 1996. MNRAS, 281, 985.
- van Dokkum et al. (1998) van Dokkum, P.G., Franx, M., Kelson, D.D., Illingworth, G.D., 1998. ApJ, 504, L53.
- van Dokkum et al. (2001) van Dokkum, P.G., Franx, M., Kelson, D.D., Illingworth, Garth D., 2001. ApJ, 553, L39.
- van Dokkum and Stanford (2003) van Dokkum, P.G., Stanford, S.A., 2003. ApJ, 585, 78.
- Whitmore (1984) Whitmore, B.C. 1984. ApJ, 278, 61.
- Woo et al. (2004) Woo, J.H., Urry, C.M., Lira, P., van der Marel, R.P., Maza, J., 2004. ApJ, 617, 903.
- Worthey (1994) Worthey, G., 1994. ApJS, 95, 107.
- Worthey et al. (1995) Worthey, G., Trager, S.C., Faber, S.M., 1995. in ASP Conf. Ser. 86, p. 203.
- Zepf and Whitmore (1993) Zepf, S.E., Whitmore, B.C., 1993. ApJ, 418, 72.
- Zhao (1996) Zhao, H.S., 1996, MNRAS, 278, 488.
- Ziegler et al. (1999) Ziegler, B.L., Saglia, R.P., Bender, R., Belloni, P., Greggio, L., Seitz, S., 1999. A&A, 346, 13.
- Ziegler and Bender (1997) Ziegler, B.L., Bender, R., 1997. MNRAS 291, 527.