Dark Supergiant: Chandra’s Limits on X-rays from Betelgeuse
Abstract
We have analyzed Chandra calibration observations of Betelgeuse ( Ori, M2 Iab, m, 131 pc) obtained at the aimpoint locations of the HRC-I (8 ks), HRC-S (8 ks), and ACIS-I (5 ks). Betelgeuse is undetected in all the individual observations as well as cumulatively. We derive upper limits to the X-ray count rates and compute the corresponding X-ray flux and luminosity upper limits for coronal plasma that may potentially exist in the atmosphere of Betelgeuse over a range of temperatures, MK. We place a flux limit at the telescope of ergs s-1 cm-2 at MK. The upper limit is lowered by a factor of at higher temperatures, roughly an order of magnitude lower than that obtained previously. Assuming that the entire stellar surface is active, these fluxes correspond to a surface flux limit that ranges from ergs s-1 cm-2 at MK, to ergs s-1 cm-2 at higher temperatures, five orders of magnitude below the quiet Sun X-ray surface flux. We discuss the implications of our analysis in the context of models of a buried corona and a pervasive magnetic carpet. We rule out the existence of a solar-like corona on Betelgeuse, but cannot rule out the presence of low-level emission on the scale of coronal holes.
1 Introduction
| Other Names | Ori / 58 Ori / HD 39801 / HR 2061 / SAO 113271 / HIP 27989 | |
| (R.A., Dec) | (05:55:10.3053, +07:24:25.426) | ICRS 2000.0 |
| () | () | SIMBAD |
| Spectral Type | M2 Iab | SIMBAD |
| 0m.58 | SIMBAD | |
| 1m.77 | SIMBAD | |
| Teff | 3650 K | Levesque et al. (2005) |
| -1.6 | Levesque et al. (2005) | |
| Distance | pc | Hipparcos (Perryman et al. 1997) |
| ergs s-1 | ||
| Angular Diameter | mas | CHARM (Richichi & Percheron 2002) |
| Radius | R⊙ | |
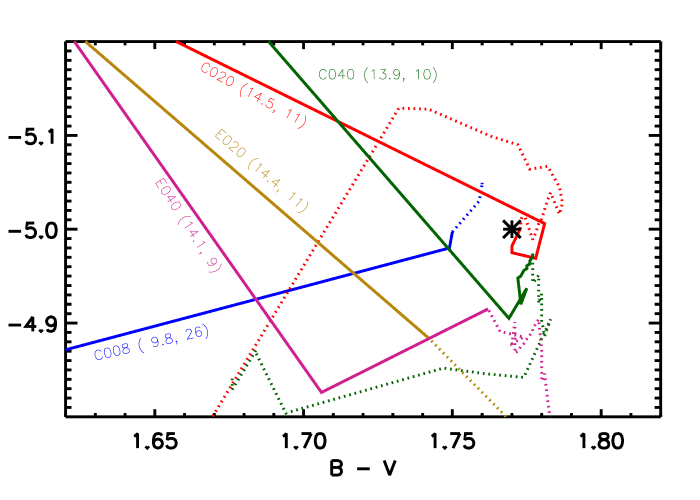
| Mass | M⊙ | Figure 1 |
| Age | Myr | Figure 1 |
| Gravity | cm s-2 | |
| Circumstellar Column | cm-2 | Hagen (1978) |
Betelgeuse (see Table 1) is a nearby (131 pc), bright () evolved red supergiant star (M2 Iab, ). It has been monitored extensively in the optical (e.g., Wilson et al. 1997, Burns et al. 1997), and displays irregular brightness variations (, Gray 2000) that have been interpreted as large-scale surface structures or activity (e.g., Lim et al. 1998 and Gray 2000). A definitive estimate of its age does not exist since it cannot be identified with nearby Orion associations (Lesh 1968), and estimates of its mass vary from M⊙ (Dorch 2004) to M⊙ (Gray 2000; also Lambert et al. 1984 and references therein). However, reasonable estimates can be obtained by comparing the evolutionary tracks of high-mass stars with the location of Betelgeuse on a color-magnitude diagram. We show such a comparison using the Geneva stellar evolutionary tracks (Lejeune & Schaerer 2001) in Figure 1. The stellar models vary in initial mass, metallicity, and mass-loss rates, and no rotation effects are included. While the systematic model uncertainties prevent a definitive assessment of the evolutionary history of Betelgeuse, note nevertheless that most of the models predict similar values of age and mass for the star, and therefore an approximate estimate of the gross properties of Betelgeuse is possible. Based on Figure 1, we adopt a current mass of M⊙ and an age of Myr for Betelgeuse. The uncertainty in these parameters do not affect our conclusions.
Betelgeuse has never been detected in X-rays, and is in a region of the H-R diagram where a stable corona is not expected to exist (Ayres et al. 1981, Linsky & Haisch 1979, Haisch, Schmitt, & Rosso 1991, Rosner et al. 1995, Hünsch & Schröder 1996, Hünsch et al. 1998). Nevertheless, there is evidence from numerical MHD simulations that dynamo action which can produce large scale magnetic fields can exist on such stars (Dorch 2004). Furthermore, chromospheric activity suggesting the presence of coronae has been detected in numerous late-type giant stars: coronal proxy lines such as Si IV and C IV have been detected in ostensibly non-coronal giants such as Arcturus and Aldebaran (Ayres et al. 2003); and forbidden coronal lines have been reported in FUSE observations of Cet by Redfield et al. (2003). Thus, while unlikely, it is plausible that hot coronal plasma may exist on supergiants like Betelgeuse.
Here we present an analysis of X-ray observations of Betelgeuse obtained as part of the science instrument calibration program of the Chandra X-Ray Observatory (Chandra). The data are described in §2. Betelgeuse is not detected in X-rays in any of our individual observations or in co-added data, and in §3 we set the most stringent upper limits to the X-ray flux determined thus far, improving upon limits obtained from the ROSAT All-Sky Survey (RASS) by two orders of magnitude. In §4, we discuss our results in the context of models of coronae on late-type stars. We summarize in §5.
2 Data
2.1 Chandra
Betelgeuse was periodically observed by Chandra from 2001 till 2007 as part of a calibration program to monitor the UV, optical, and IR response of all of the detectors. Of these, we consider the on-axis observations with the ACIS-I, HRC-I, and HRC-S detectors, for which the expected out-of-band contamination is vanishingly small and thus can be ignored (Wolk 2002 for ACIS-I; and Posson-Brown & Kashyap 2005 for HRC, see Table 3). The out-of-band leak is large for the ACIS-S detector, so we do not use any Betelgeuse ACIS-S observations in this analysis. A total of ks of exposure has been accumulated thus far with Chandra (see Table 2).
| Obs ID | Instrument | Date | Exposure (s) |
|---|---|---|---|
| RASS | ROSAT/PSPC, bands 1-7 | 1990-07-30aaStart date of RASS | 460bbEstimated from nearby sources (see §2) |
| RASS | ROSAT/PSPC, bands 1-2 | 1990-07-30aaStart date of RASS | 460bbEstimated from nearby sources (see §2) |
| 3365 | Chandra/ACIS-I | 2001-12-16 | 4897.2 |
| 2595 | Chandra/HRC-I | 2001-12-07 | 1892.1 |
| 3680 | Chandra/HRC-I | 2003-02-06 | 1893.4 |
| 5055 | Chandra/HRC-I | 2004-02-02 | 2075.9 |
| 5970 | Chandra/HRC-I | 2005-02-02 | 2129.4 |
| 2596 | Chandra/HRC-S | 2001-12-07 | 1926.7 |
| 3681 | Chandra/HRC-S | 2003-02-06 | 1819.6 |
| 5056 | Chandra/HRC-S | 2004-02-02 | 1945.3 |
| 5971 | Chandra/HRC-S | 2005-02-02 | 2140.4 |
We use level 2 photon event lists downloaded from the public archive, which have gone through the standard pipeline processing by the CXC software (ASCDS versions 6.4 and above). Further analysis was done using CIAO software (v3.2.2) and custom IDL111Interactive Data Language, ITT Visual Information Solutions software, including routines from the Package for Interactive Analysis of Line Emission (PINTofALE; Kashyap & Drake 2000).222Available from http://hea-www.harvard.edu/PINTofALE/
For both HRC detectors, we used circular source regions with , enclosing 95% of the X-ray PSF, centered on the location of the source (verified with ACIS-S data, where Betelgeuse is visible due to the optical leak). To measure the background, in the HRC-I we used annuli wide, beginning away from the source location; for the HRC-S, we used annuli wide, beginning away from the source location.
For ACIS-I, we first followed CIAO threads to reprocess the event list from level 1, removing afterglow events and rejecting events with bad grades. We then filtered the new level 2 event list to include PI, which corresponds to an energy cut of approximately keV. For the source region, we used a circle with , enclosing 99% of the ACIS X-ray PSF, and a background annulus wide, beginning away from the source location. To find the combined Chandra counts upper limit, we used circular source regions with and annular background regions with and for all three detectors (HRC-I, HRC-S, and ACIS-I). The sum of the background counts was used as the background (see Equation 1 in §3.1) when finding the combined counts upper limit, and the sum of the exposure times was used as the combined exposure time when finding the combined flux upper limit (see §3.2). Observed source and background counts for all detectors are listed in Table 4.
2.2 ROSAT
Berghöfer et al. (1999) find an X-ray count rate upper limit of ct s-1 for Betelgeuse based on ROSAT/HRI observations, and a limit of ct s-1 based on the ROSAT All-Sky Survey data (RASS). For completeness, we have included these estimates in Figure 2, and have also recalculated the limit based on RASS data. Because Betelgeuse is not detected, we estimate the upper limit (see §3) based on the high-resolution X-ray background maps derived from RASS (Snowden et al. 1997). These maps are exposure corrected images with pixels, in seven energy bands, each with a corresponding error map. We considered bands 1 and 2, spanning keV, and bands 1 through 7, spanning keV. By averaging the exposure times for eight sources in the RASS Faint Sources Catalog within of Betelgeuse, we estimated the exposure time for the local background to be s. To estimate the counts upper limit, we collected background counts within a circle with centered on the position of Betelgeuse; such a circle encloses 95% of the PSPC PSF. Observed source and background counts are listed in Table 4. We obtain a limit nearly identical to that derived by Berghöfer et al. for the RASS.
2.3 UV, Optical, and IR Leak
An important concern when optically bright sources are X-ray weak is that counts that may be detected in the instrument could be due to its so called out-of-band response to UV, optical, and IR photons. It is therefore critical to include this leak into estimates of the background. That is, we must compute the X-ray detection limit that includes possible contributions to the observed count rate from lower energy photons.
For the PSPC, we adopt a conservative estimate of ct s-1 for the UV response as quoted in the ROSAT User’s Handbook (expected for a high-temperature star such as Vega).333http://wave.xray.mpe.mpg.de/rosat/doc/ruh/rosathandbook.html This implies that only 1 UV photon will be detected during a 460 s exposure. For Chandra, an analysis of the out-of-band response of the HRC to Betelgeuse (Posson-Brown & Kashyap 2005) shows that the UV leak from Betelgeuse is vanishingly small (Table 3) and no UV photons will be detected during the HRC observations. A similar estimate also applies to ACIS-I observations (Wolk 2002).
| Detector | Expected count rate | Accumulated | Upper Limit | Required |
|---|---|---|---|---|
| [ct s-1] | Exposure [s] | [ct s-1] | Exposure | |
| HRC-I | 7991 | s | ||
| HRC-S | 7832 | s |
3 Analysis
3.1 Counts Upper Limits
To calculate the X-ray counts upper limits, we estimate the counts that would need to be present in order to detect the source above a given background, assuming a Poisson probability distribution for background counts. The probability that at most counts would be observed as a statistical fluctuation, given a background , is
| (1) |
The background is determined locally, from an annulus around the nominal location of the source, and where applicable, an estimate of the UV leak is added to it (see §2). Note that this is a cumulative probability estimate, and uses the full Poisson likelihood in the process. For a specific probability threshold , the upper limit is . We allow for statistical variations in the background counts by doing Monte Carlo simulations where the background counts are sampled from a Poisson distribution. We typically report a “” limit, corresponding to a probability of 0.997 that matches the integrated area under a normalized Gaussian between . Note that in our case, for consistency with the Poisson distribution in the low-counts regime, the integration always starts at a counts intensity of , and the counts value at which the probability threshold is met does not coincide with the aforementioned range of a Gaussian. For a more detailed description of this approach, see Pease et al. (2006). Our results are summarized in Table 4.
| Detector | Exposure | Background Region | Source Region | Upper Limit | ||
|---|---|---|---|---|---|---|
| [s] | [arcsec2] | [ct] | [arcsec2] | [ct] | [ct] | |
| ROSAT/PSPC bands 1-2 | 460 | 4147200 | 234 | 3848 | 38 | 6 |
| ROSAT/PSPC bands 1-7 | 460 | 4147200 | 358 | 3848 | 48 | 6 |
| Chandra/HRC-I | 7791 | 14126 | 1052 | 2.66 | 0 | 2 |
| Chandra/HRC-S | 7832 | 16245 | 9340 | 2.66 | 4 | 4 |
| Chandra/ACIS-I | 4897 | 31102 | 50 | 28.27 | 0 | 2 |
| Chandra combinedaaNote that the size of the source region used when finding the combined limit is larger than the source sizes used when finding the HRC limits (see §2.1) | 20720 | 31102 | 20384 | 28.27 | 19 | 13 |
3.2 Flux Upper Limits
The counts upper limit determined above in §3.1 represents the minimum counts that Betelgeuse must have in the source aperture in order to be detected. If it were observed with the same instrumental sensitivity a large number of times, and if it had a true flux intensity that produces, on average, the same number of counts in the source aperture as the quoted counts limit, then it would be detected in half the observations and not detected in the other half. A simple multiplicative transformation of the counts limit to the flux limit can therefore be performed under these conditions by computing a counts-to-energy conversion factor for various putative plasma temperatures.
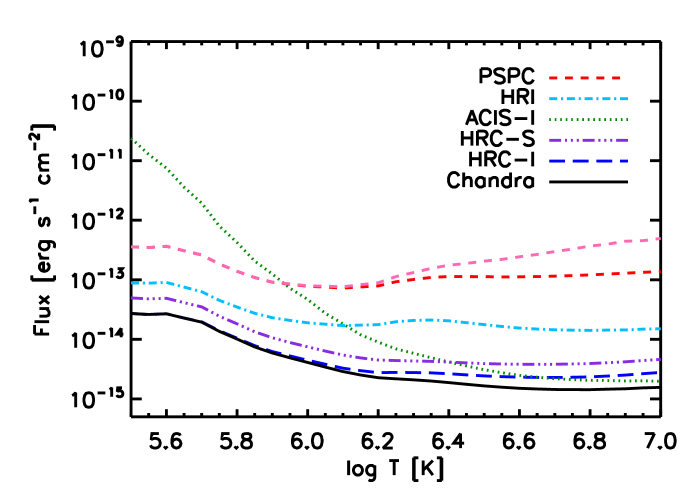
For each instrument, we generate spectra for isothermal plasma at a given emission measure over a range of temperatures, MK, using PINTofALE (Kashyap & Drake 2000). We use the CHIANTI database of atomic emissivities (Dere et al. 1997, Young et al. 2003) with solar abundances (Grevesse et al. 1992) and ion balances from Mazzotta et al. (1998). These spectra, which define the incident intensity at the telescope, are multiplied by the appropriate effective areas and convolved with the instrument response matrices to obtain the counts predicted in a given passband. The ratio of the incident flux to the derived counts gives a counts-to-flux conversion factor for each temperature, which then allows us to convert the counts upper limits to flux upper limits. These upper limits are shown in Figure 2.
In addition to considering the Chandra instruments separately, we also combine them to achieve a more stringent upper limit on Betelgeuse’s X-ray flux. We do this by constructing a virtual observation that is essentially the sum of the individual observations, weighted by the appropriate effective areas and exposure times. For a nominal incident flux from a plasma at a given temperature, we compute the counts predicted for the specific combinations of Chandra instruments and exposures in Table 2, and compute the sum of these counts. Because the relative fractions of the counts remain unchanged as the nominal flux changes, the ratio of the summed counts and the input flux gives the counts-to-flux conversion factor for this virtual observation. We thus obtain the most stringent limits on the X-ray flux from Betelgeuse obtained thus far, which ranges from ergs s-1 cm-2 at MK to as low as ergs s-1 cm-2 at MK.
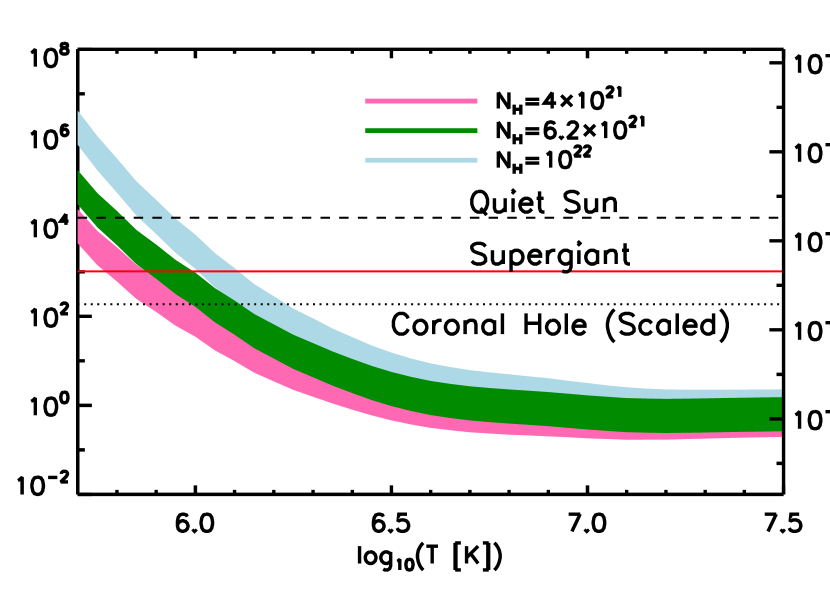
The flux limits at Earth can also be converted to intrinsic X-ray luminosity limits at the star after a suitable absorption column density is adopted. The circumstellar shell surrounding Betelgeuse has a column density estimated to be cm-2 (Hagen 1978), and an additional column of approximately the same magnitude can be present due to chromospheric material that extends above a conjectured “buried corona” (see Ayres et al. 2003). We also consider a smaller value of since part of the circumstellar column is likely to be in dust and grains, which will effectively reduce the absorption column. The ratio and the corresponding average surface X-ray flux are shown in Figure 3. The implications of the derived upper limits to the surface flux are discussed in §4.2. Throughout this paper, we adopt ergs s-1 for Betelgeuse, calculated from the observed visual magnitude.
4 Discussion
4.1 Magnetic Fields
If any coronal plasma exists on the surface of Betelgeuse, it is likely confined in place by magnetic fields. From numerical studies (see §4.2 below), we expect fields of strength approaching 500 G. How does it compare to the observational limit? Here we estimate the magnetic field strength required to confine plasma, assuming that there does exist coronal plasma emitting at a level just below the derived flux upper limit (§3.2), and further assuming equipartition of thermal and magnetic energy densities in the corona, i.e., , and hence
| (2) |
where is the assumed plasma temperature, is the power emitted from a unit volume of the plasma, is the effective mass of an average particle ( for fully ionized plasma), is the stellar radius, is Boltzmann’s constant, is the filling fraction of the X-ray active region on the surface of the star, and is the height of the corona. Note that , i.e., it is only weakly dependent on the X-ray luminosity and the filling fraction.
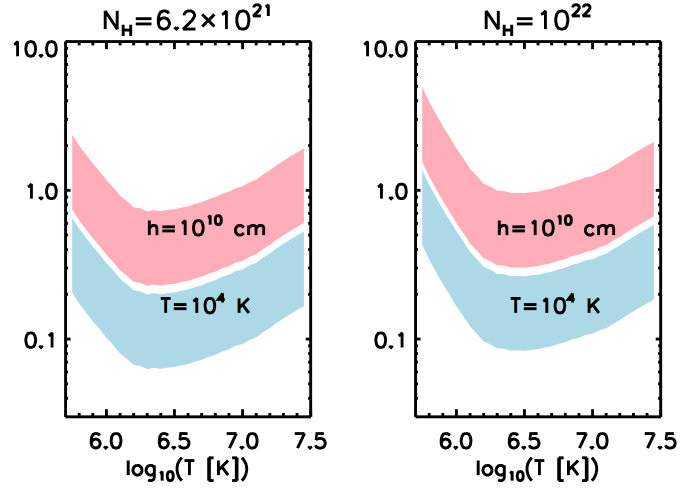
In Figure 4, we show the required field strength , for a range of filling fraction , for different estimates of the height of the corona. We obtain estimates both for a corona that is approximately the same height as the solar corona ( cm) and for one that extends as high as the chromospheric scale height ( cm). The latter is relevant in the context of a “buried corona” scenario expounded by Ayres et al. (2003). We find that the required ranges from G up to G, considerably less than the field strength expected from modeling (Dorch 2004). Weaker fields are sufficient for lower levels of X-ray emission. (Note that our calculation of is not a limit, and we cannot rule out the presence of a stronger magnetic field. However, we can say that a stronger magnetic field is not required.) We thus conclude that sustaining a weak corona on Betelgeuse is feasible, and such coronae cannot yet be ruled out based on the X-ray flux limits.
4.2 Magnetic Carpet
Numerical MHD simulations of stars such as Betelgeuse have shown that a highly structured magnetic dynamo may operate on them (Dorch 2004, Freytag et al. 2002), with field strength as high as G. The energy spectra of the magnetic energy density peaks cascade to small scales, with a preponderately high contribution at scales . This is very similar to the magnetic activity in the quiet Sun, where for comparison, field strengths reach up to G (Cerdeña et al. 2006), and the magnetic structures of mixed polarity emerge uniformly over the surface on timescales approximately the same as the convective cells. This is the so-called ‘magnetic carpet’ (Schrijver et al. 1997, Title 2000) which pervades the surface of the Sun away from active regions.
If red supergiants are magnetically active in a similar manner, the total energy dumped into the corona, and the resulting plasma temperatures and X-ray luminosities, are similar in scope to that seen in the quiet Sun and in coronal holes, scaled only by the energy densities and volumes involved. We assess the feasibility of this scenario by computing the expected surface flux upper limit for Betelgeuse. Figure 3 shows bands corresponding to the surface flux limits, calculated assuming a variety of plausible absorbing column densities, cm-2 (see §3.2). Here we assume that the entire surface is covered by magnetic structures that contribute to the X-ray emission, i.e., that the filling fraction . However, supergiant stars like Betelgeuse possess very large convection cells (Lim et al. 1998) which suggests that . Smaller values of imply that the surface flux upper limit will be correspondingly higher. We show the effects of smaller filling fractions in Figure 4.
The X-ray luminosity of the quiet Sun is ergs s-1 (Golub & Pasachoff 1997) corresponding to a surface flux of ergs s-1 cm-2. If similar processes to those on the Sun operate on Betelgeuse, it is reasonable to expect that the energy flux deposited into the corona will be similar, scaled by the available magnetic energy density. Thus, we expect a surface X-ray flux of ergs s-1 cm-2 on Betelgeuse. Note however that the surface flux on Betelgeuse could be lower if it were dominated by features similar to the solar coronal holes. The X-ray flux from coronal holes on the Sun is much lower, ergs s-1 cm-2 (Vernazza & Smith 1977, Schrijver et al., 2004), and again scaling it to the expected magnetic field energy density present on Betelgeuse, we obtain a possible X-ray surface flux of ergs s-1 cm-2 (see Figure 3).
The upper limit on is strongly dependent on the temperature of the plasma because of the sensitive dependence of the observable spectrum on the absorption column. We find that the limit is as low as ergs s-1 cm-2 () at high temperatures, but cannot be reduced below ergs s-1 cm-2 for MK () for the sensitivity achieved thus far with Chandra. While the upper limit at low temperatures still lies above the flux expected from the solar analogy, this calculation does rule out the existence of pervasive quiet Sun type emission at high temperatures, since a surface flux of ergs s-1 cm-2 from plasma at MK would have been easily detected. Note however that this does not preclude patchy and highly localized regions of magnetic activity that produces high temperature plasma, or more pervasive low-temperature plasma emission arising from this mechanism: plasma at MK will remain undetected at the sensitivity limit of our observations. Since the quiet Sun and coronal hole plasma is at MK, this further suggests that even if hot plasma at lower temperatures is present on Betelgeuse, it will bear little resemblance to the solar case.
4.3 Coronal Proxies
Numerous UV and FUV chromospheric lines have been identified as proxies for coronal activity in normal and giant stars. Note that the physical relationship between the mechanisms that generate coronal and chromospheric line emission is poorly understood, and the proxy lines are often formed at temperatures very different from those that characterize coronae. However, assuming that similar processes occur on Betelgeuse as on coronally active giants and main sequence stars, we investigate whether our derived flux upper limits (see §3.2) are consistent with observations of coronal proxy lines on Betelgeuse. Based on known correlations between X-ray flux and proxy lines such as C IV, Si IV, etc., we can estimate the X-ray luminosity that can be expected from Betelgeuse.
For main sequence stars, Redfield et al. (2003) find a strong correlation between the soft X-ray flux and the Fe XVIII flux (see their Figure 7) from FUSE (Far Ultraviolet Spectroscopic Explorer) spectra of main sequence and late-type stars. Fe XVIII forms above MK, and has a peak response at MK, and is thus sensitive to plasma temperatures similar to that on active binaries such as Capella. Redfield et al. place an upper limit of ergs s-1 cm-2 on the Fe XVIII flux from Betelgeuse () which implies a value for the unabsorbed X-ray luminosity if supergiants such as Betelgeuse follow the correlation seen in their Figure 7. The flux upper limit we calculate (§3.2, Figure 3) corresponds to for MK, well below the value predicted by the main sequence correlation. Conversely, assuming that the correlation is valid for supergiants, our X-ray upper limit implies a stronger constraint on the Fe XVIII emission, .
Similarly, there exists a clear correlation between C IV and X-ray luminosities for giant stars (see, e.g., Ayres et al. 1997, especially their Figure 2). Even though there is evidence for considerable scatter for different types of stars, one can establish a general correspondence that is valid to within an order of magnitude. Based on IUE ultraviolet spectra, Basri et al. (1981) place a upper limit of ergs s-1 cm-2 on the C IV flux from Betelgeuse, and this translates to an unabsorbed X-ray luminosity limit of . In the temperature range MK (which matches the sensitivity range of X-ray measurements from Einstein and ROSAT, on which this correlation is based), this limit is comparable to our observational limit determined above.
Lastly, from FUSE spectra of Betelgeuse published by Dupree et al. (2005; see their Figure 4), we estimate an upper limit of ergs s-1 cm-2 on its Si IV flux. If the correlation found by Ayres et al. (2003, see their Figure 4) for giant stars applies to supergiants like Betelgeuse, then the limit of corresponds to an expected X-ray unabsorbed flux of which is again comparable to the observed limit we obtain.
Note that previous studies of Betelgeuse in the optical and UV have seen no evidence for chromospheric temperatures above 6000 K (e.g. Lobel et al. 2000 & 2001 and Carpenter et al. 1994) and our observations are consistent with those findings.
From the comparisons above, we conclude that we have now achieved a sensitivity in the X-ray regime that is comparable to the sensitivity achieved in the far UV with coronal proxy lines, especially at temperatures MK. In combination with the surface flux limit arguments made above (§4.2) and the stringent upper limit on obtained here, we conclude that any high-temperature plasma will have to arise from a mechanism other than that which normally operates on the Sun.
Finally, note also that if the hot plasma is “buried” in the highly extended chromospheric material (as suggested by Ayres et al. 2003), then both the chromospheric proxies and the coronal X-ray flux will be subject to significant absorption, and our placement of Betelgeuse on these flux-flux correlation diagrams will be systematically low. In such a case, the limit on will be less restrictive, but will not affect our conclusions.
5 Summary
We have carefully analyzed over 20 ks of Chandra observations of Betelgeuse in an effort to detect X-ray emission from the massive red supergiant. However, Betelgeuse remains undetected, and we derive an upper limit to the X-ray count rate by calculating the rate that would have resulted in a detection given the extant background. We have converted this count rate limit to a flux limit at the telescope by computing the response of ROSAT and Chandra instruments to isothermal plasma producing optically-thin thermal emission, and thereby derive the most stringent upper limits to the X-ray flux from Betelgeuse obtained thus far. We find a limit for the flux from Betelgeuse at the telescope of ergs s-1 cm-2 for temperatures MK. At lower temperatures, we place a limit of ergs s-1 cm-2 on the flux.
The flux limit at Earth can be converted to a stellar surface flux upper limit and to an limit using the known distance and size of Betelgeuse. We compare the surface flux limits with the flux expected from a solar like emission mechanism, where a pervasive magnetic field maintains a low-level corona, as in the quiet Sun or solar coronal holes. We rule out such emission at temperatures MK, but such emission is still feasible at lower temperatures. The minimum magnetic field necessary to maintain such a corona is G, well within theoretical expectations.
We compare the upper limit we derive with the limits obtained from non-detections of coronal tracer lines such as C IV, Si IV, and Fe XVIII and find that we achieve sensitivities in the X-ray comparable to that in the coronal proxies. These limits reinforce the conclusions arrived at above, that high-temperature plasma, even at levels expected in the presence of stellar coronal holes, is absent on Betelgeuse, but the existence of low-temperature plasma cannot be ruled out.
References
- (1)
- (2) Ayres, T.R., Brown, A., & Harper, G.M. 2003, ApJ, 598, 610
- (3) Ayres, T.R., et al. 1997, ApJ, 491, 876
- (4) Basri, G.S. Linsky, J.L., & Eriksson, K. 1981, ApJ, 251, 162
- (5) Berghöfer, T.W., Schmitt, J.H.M.M., & Hünsch, M., 1999, A&A, 342, L17
- (6) Burns, D., Baldwin, J. E., Boysen, R. C., Haniff, C. A., Lawson, P. R., Mackay, C. D., Rogers, J., Scott, T. R., Warner, P. J., Wilson, D. M. A., Young, J. S., 1997, MNRAS, 290, 11
- (7) Carpenter, K.G., Robinson, R.D., Wahlgren, G.M., Linsky, J.L., & Brown, A., 1994, ApJ, 428, 329
- (8) Cerdeña, I.D., Almeida, J.S., & Kneer, F., 2006, ApJ, 636, 496
- (9) Dere, K.P., Landi, E., Mason, H.E., Monsignori Fossi, B.C., Young, P.R. 1997, A&AS, 125, 149
- (10) Dorch, S.B.F. 2004, A&A, 423, 1101
- (11) Dupree, A.K., Lobel, A., & Young P.R. 2005, ApJ, 622, 629
- (12) Freytag, B., Steffen, M., & Dorch, B., 2002, AN, 323, 213
- (13) Golub, L., & Pasachoff, J.M., 1997, The Solar Corona, Cambridge University Press
- (14) Gray, D.F. 2000, ApJ, 532, 487
- (15) Grevesse, N., Noels, A., & Sauval, A.J. 1992, in Coronal Streamers, Coronal Loops and Coronal and Solar Wind Composition, Proc. 1st SOHO Workshop, ESA SP-348, ESA Publ. Div., ESTEC, Noordwijk, p.305
- (16) Hünsch, M., Schmitt, J.H.M.M., Schröder, K.-P., & Zickgraf, F.-J., 1998, A&A, 330, 225
- (17) Hünsch, M., & Schröder, K.-P., 1996, A&A, 309, L51
- (18) Hagen, W., 1978, ApJS, 38, 1
- (19) Haisch, B.M., Schmitt, J.H.M.M., & Rosso, C., 1991, ApJ, 383, L15
- (20) Harper, G.M., Brown, A., & Lim, J., 2001, ApJ, 551, 1073
- (21) Kashyap, V. & Drake, J. J. 2000, Bull.Astr.Soc. of India, 28, 475
- (22) Lambert, D.L., Brown, J.A., Hinkle, K.H., Johnson, H.R., 1984, ApJ, 284, 223
- (23) Lesh, J.R., 1968, ApJ, 152, 905
- (24) Levesque, E.M., Massey, P., Olsen, K.A.G., Plez, B., Josselin, E., Maeeder, A., Meynet, G., 2005, ApJ, 628, 973
- (25) Lim, J., Carilli, C.L., White, S.M., Beasley, A.J., & Marson, R.G. 1998, Nature, 392, L575
- (26) Lobel, A. & Dupree, A.K., 2000, ApJ, 545, 454
- (27) Lobel, A. & Dupree, A.K., 2001, ApJ, 558, 815
- (28) Mazzotta, P., Mazzitelli, G., Colafrancesco, S., & Vittorio, N., 1998, AASS, 133, 403
- (29) Pease, D.O., Drake, J.J., & Kashyap, V.L., 2006, ApJ, 636, 426
- (30) Perryman, M.A.C., et al., 1997, A&A, 323, L49
-
(31)
Posson-Brown, J. & Kashyap, V. 2005, 2005 Chandra Calibration Workshop
http://cxc.harvard.edu/ccw/proceedings/05_proc/index.html - (32) Posson-Brown, J., Kashyap, V.L., Drake, J.J., & Pease, D.P., 2005, at Six Years of Chandra Symposium
- (33) Redfield, S., et al. 2003, ApJ, 585, 993
- (34) Richichi, A., & Percheron, I., 2002, A&A, 386, 492
- (35) Rosner, R., Musielak, Z.E., Cattaneo, F., Moore, R.L., & Suess, S.T., 1995, ApJ, 442, 25
- (36) Schrijver, C.J., Sandman, A.W., Aschwanden, M.J., & DeRosa, M.L., 2004, ApJ, 615, 512
- (37) Schrijver, C.J., Title, A.M., van Ballegooijen, A.A., Hagenaar, H.J., & Shine, R.A., 1997, ApJ, 487, 424
- (38) Simon, T., Linsky, J.L., & Stencel, R.L., 1982, ApJ, 257, 225
- (39) Snowden, S. L., Egger, R., Freyberg, M. J., McCammon, D., Plucinsky, P. P., Sanders, W. T., Schmitt, J. H. M. M., Trümper, J., Voges, W., 1997, ApJ, 485, 125
- (40) Title, A.M., 2000, Phil.Trans.R.Soc.Lond.A, 358, 657
- (41) Vernazza, J.E., & Reeves, E.M., 1978, ApJS, 37, 485
- (42) Wilson, R. W., Dhillon, V. S., & Haniff, C. A., 1997, MNRAS, 291, 819
-
(43)
Wolk, S. 2002, 2002 Chandra Calibration Workshop
http://cxc.harvard.edu/ccw/proceedings/02_proc/index.html - (44) Young, P.R., del Zanna, G., Landi, E., Dere, K.P., Mason, H.E., & Landini, M., 2003, ApJS, 144, 135
- (45)