SPITZER SPACE TELESCOPE INFRARED IMAGING AND SPECTROSCOPY OF THE CRAB NEBULA
Abstract
We present 3.6, 4.5, 5.8, 8.0, 24, and 70 images of the Crab Nebula obtained with the Spitzer Space Telescope IRAC and MIPS cameras, Low- and High-resolution Spitzer IRS spectra of selected positions within the nebula, and a near-infrared ground-based image made in the light of [Fe II]1.644 . The 8.0 image, made with a bandpass that includes [Ar II]7.0 , resembles the general morphology of visible H and near-IR [Fe II] line emission, while the 3.6 and 4.5 images are dominated by continuum synchrotron emission. The 24 and 70 images show enhanced emission that may be due to line emission or the presence of a small amount of warm dust in the nebula on the order of less than 1% of a solar mass. The ratio of the 3.6 and 4.5 images reveals a spatial variation in the synchrotron power law index ranging from approximately 0.3 to 0.8 across the nebula. Combining this information with optical and X-ray synchrotron images, we derive a broadband spectrum that reflects the superposition of the flatter spectrum jet and torus with the steeper diffuse nebula, and suggestions of the expected pileup of relativistic electrons just before the exponential cutoff in the X-ray. The pulsar, and the associated equatorial toroid and polar jet structures seen in Chandra and HST images (Hester et al., 2002) can be identified in all of the IRAC images. We present the IR photometry of the pulsar. The forbidden lines identified in the high resolution IR spectra are all double due to Doppler shifts from the front and back of the expanding nebula and give an expansion velocity of km s-1.
1 INTRODUCTION
In their seminal paper “Synthesis of the Elements in Stars,” E. M. Burbidge, G. R. Burbidge, W. A. Fowler, and F. Hoyle (1957) described how primordial hydrogen is converted into the other elements by nucleosynthesis in stellar interiors and stellar explosions. Massive stars play a particularly important role in the production of nuclei up to the iron peak during main sequence and post main sequence nucleosynthesis. The Type II Supernova (SN) explosions that result from the collapse of the their iron cores produce the rest of the heavy elements by rapid neutron capture in the expanding ejecta. Thus, SN ejecta enrich the chemical content of the interstellar clouds from which new stars continually form, and it is believed that the contents of the pre-solar nebula were profoundly affected by one or more such events (see Clayton , 1982).
In particular, the ability of SN explosions to eject copious quantities of carbon and other condensable metals has long led to speculation that SNs are capable of producing vast quantities of stardust as their ejecta cool (Clayton , 1982; Gehrz & Ney, 1987; Dwek, 1988; Gehrz, 1988). Clayton has proposed that such grains may survive today in meteorite inclusions. The infrared (IR) is an ideal spectral region in which to test these theories, because dust grains emit strongly in the IR as do forbidden emission lines from condensable metals that remain in the gas phase. On the other hand, previous IR studies that have failed to reveal evidence for any large amount of dust in SN remnants (SNRs) have provided us with somewhat of a mystery (Gehrz & Ney, 1990; Arendt et al., 1999; Douvion et al., 2001; Dwek, 2004; Green et al., 2004).
We have used Guaranteed Observation Time (GTO) on NASA’s new Spitzer Space Telescope (Werner et al., 2004) to obtain IR images and spectroscopy of the Crab Nebula, formed by a supernova explosion in 1054 AD. It is one of the youngest known SNRs and is one of the most studied objects in the Galaxy. The SN ejecta in the Crab are concentrated in filaments of ionized gas that produce emission line spectra (see Davidson & Fesen, 1985). One long-standing puzzle regarding the Crab is the lack of a visible blast wave expected from a massive star explosion (Seward et al., 2006). Previous IR observations have indicated that there is a paucity of dust in the Crab. Infrared Astronomical Satellite (IRAS) observations revealed an IR excess at wavelengths longer than 12 that was attributed to thermal emission from 0.005-0.03 M⊙ of dust (Marsden et al., 1984). Further evidence for dust in the Crab Nebula was found in the form of optical extinction in the filaments (Hester et al., 1990; Fesen & Blair , 1990; Blair et al., 1997; Sankrit et al., 1998). In more recent studies using the Infrared Space Observatory (ISO), Douvion et al. (2001) report no evidence of spectral features from dust emission in the ISOCAM spectra, while Green et al. (2004) calculate an upper limit of 0.02 M⊙ of warm dust from the far-IR excess seen by ISOPHOT.
The Crab Nebula is one of the brightest synchrotron sources in the Galaxy. It is a prototype of a class of SNRs called the filled-center SNRs or “plerions,” that are powered by a central pulsar. A large fraction of the Crab pulsar’s spin down luminosity is converted into the nebular synchrotron luminosity, from radio through gamma-rays. The details of this conversion are quite uncertain. The Kennel & Coroniti (1984) steady-state spherical MHD model still provides the best description of the optical and X-ray profiles, but cannot tie them together with the radio synchrotron emission.
The unprecedented sensitivity of the IR imagers and spectrometers of the Spitzer Space Telescope present us with an unparalleled opportunity to search for dust and forbidden line emission in the Crab Nebula and study in detail the spatial variations of synchrotron emission across the remnant. In this paper, we present 3.6, 4.5, 5.8, 8.0, 24, and 70 images of the Crab Nebula obtained with the Spitzer Space Telescope IRAC and MIPS cameras, IRS spectra of selected positions within the nebula, and a near-IR ground-based image made in the light of [Fe II]1.644 .
2 OBSERVATIONS AND DATA REDUCTION
Observations of the Crab Nebula were made using the Infrared Array Camera (IRAC) aboard the Spitzer Space Telescope (Werner et al., 2004) at 3.6, 4.5, 5.8 and 8.0 and the Multiband Imaging Photometer for Spitzer (MIPS) at 24 and 70 as part of the Gehrz Guaranteed Time Observing Program (GGTOP, Program ID: 130). High and low resolution Spitzer 5-40 spectra of selected regions of the Crab Nebula were made using the Infrared Spectrometer (IRS) under the Roellig Guaranteed Time Observing Program (RGTOP, Program ID: 24).
2.1 IRAC IMAGES
The IRAC (Fazio et al., 2004) observations were made on 2004 March 6, under the AORKey 6588928, using 12 second exposures and the High Dynamic Range (HDR) mode at 4 dither positions obtained in a cycling dither pattern. The Basic Calibrated Data (BCD) products from the Spitzer Science Center (SSC) pipeline version S11.0.2, calibrated in units of MJy per steradian, were used in our post pipeline processing.
Post BCD processing was conducted using the 101504 version of the SSC Legacy MOPEX software. The reduction with MOPEX consisted of three steps: Cosmetic Fix, Background Matching, and Mosaicker. The field of view of the final mosaics is approximately 6.0′ 6.0′with a final pixel scale of 0.86 per pixel.
2.2 MIPS IMAGES
The MIPS (Rieke et al., 2004) 24 and 70 observations of the Crab Nebula were carried out on 2004 March 14, under the AORKey 6588672, using an exposure time of 3 seconds and 10 seconds, respectively. The data was processed with the SSC pipeline version S11.4.0. The 24 BCD data was corrected for image distortions caused by the focal plane and mosaicked with Image Reduction and Analysis Facility (IRAF)111IRAF is distributed by the National Optical Astronomy Observatories, which are operated by the Association of Universities for Research in Astronomy, Inc., under cooperative agreement with the National Science Foundation. The 70 images were mosaicked with MOPEX and have a pixel scale of 4.0 per pixel. The pixel scale of the final MIPS 24 mosaic is 2.5 per pixel. The summary of the IRAC and MIPS data is listed in Table 1.
2.3 IRS SPECTRA
Observations of the Crab nebula were obtained with all four modules of the IRS instrument (Houck et al., 2004) on 2004 March 5, under the AORKey 3857664. The IRS observations were taken in staring mode centered at the position RA 5h34m31.02s, Dec 22d01′10.1″(J2000). This position, designated as IRS-Tgt-Cntr in the discussions below, is located in the center of the nebula, near but not coincident with the pulsar position located at RA 5h34m31.97s, Dec 22d00′52.1″(J2000). Since the four IRS modules all have different slit sizes and orientations, this position in the nebula was the only one in common to all the modules. For the two low-resolution IRS modules the long slits allowed sampling of other regions of the nebula, as shown in Figure 1. Integration times, wavelength coverage, and the spectral resolution for each IRS module is given in Table 2. We also report data from other locations in the nebula sampled by the long slits in the low-resolution modules. Since the IRS staring mode involves nodding between two positions in each slit, some of these regions have the same integration times as those reported above, while others have half the time. Further explanation of how nodding along the slits is implemented in the IRS staring mode can be found in the relevant section of the Spitzer Observers Manual222See http://ssc.spitzer.caltech.edu/documents/SOM / for the most current version of the Spitzer Observers Manual.
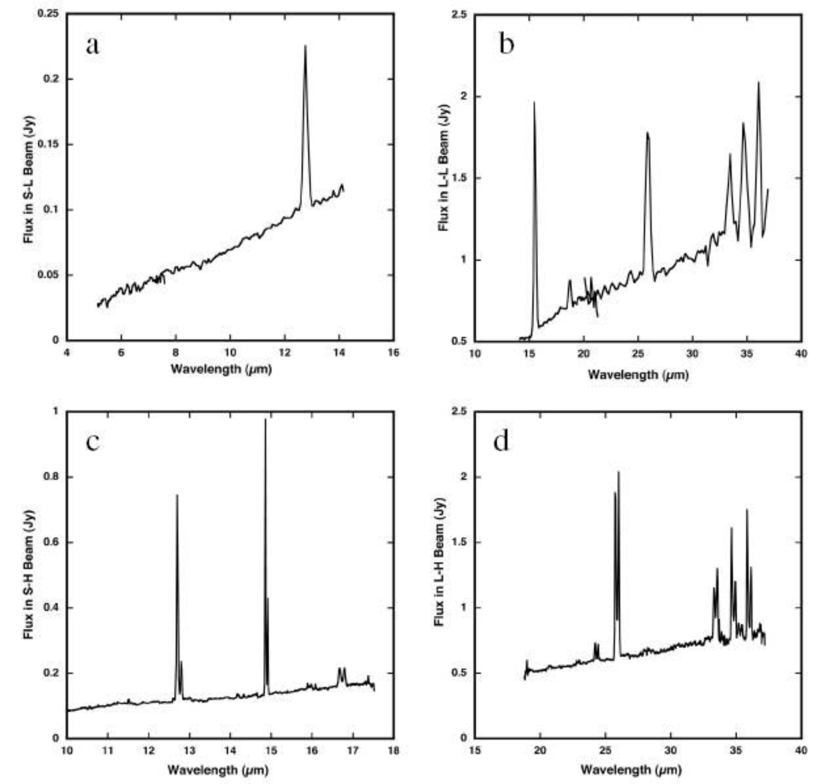
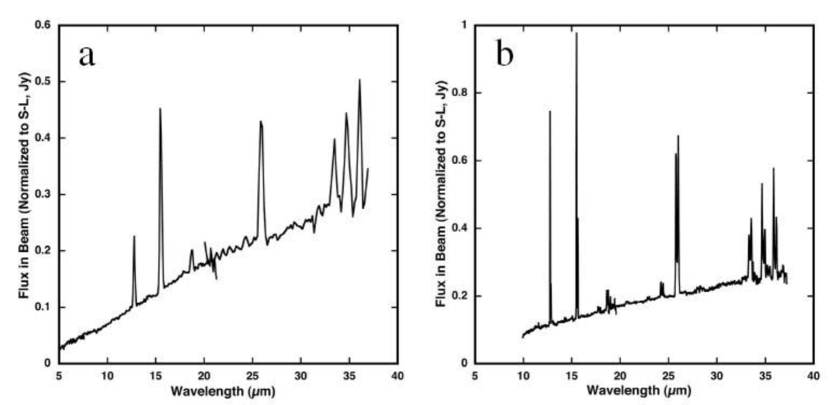
The IRS data were reduced using the SMART data reduction package described in Higdon et al. (2004). Due to the large spatial extent of the Crab nebula with respect to the IRS slit dimensions there was no blank sky available for zodiacal light subtraction. In this region of the sky the zodiacal sky background levels are roughly one-fourth of the combined emission from the Crab Nebula and zodiacal light at the worst-case wavelengths around 15 . As a result, the data reported here have a small contribution from the Zodiacal background that must be accounted for. The observed spectra from each of the IRS modules for the IRS-Tgt-Cntr position are shown in Figure 2. In these spectra the high-resolution module extractions were both full-aperture, while for the low-resolution module’s long slits the extractions were performed in 5 pixel wide sub-slits centered at the location of IRS-Tgt-Cntr. The effects of the different slit widths and extraction aperture sizes are immediately noticeable in the relative strengths of the emission baselines in the spectra in Figure 2.
2.4 NEAR-IR IMAGING
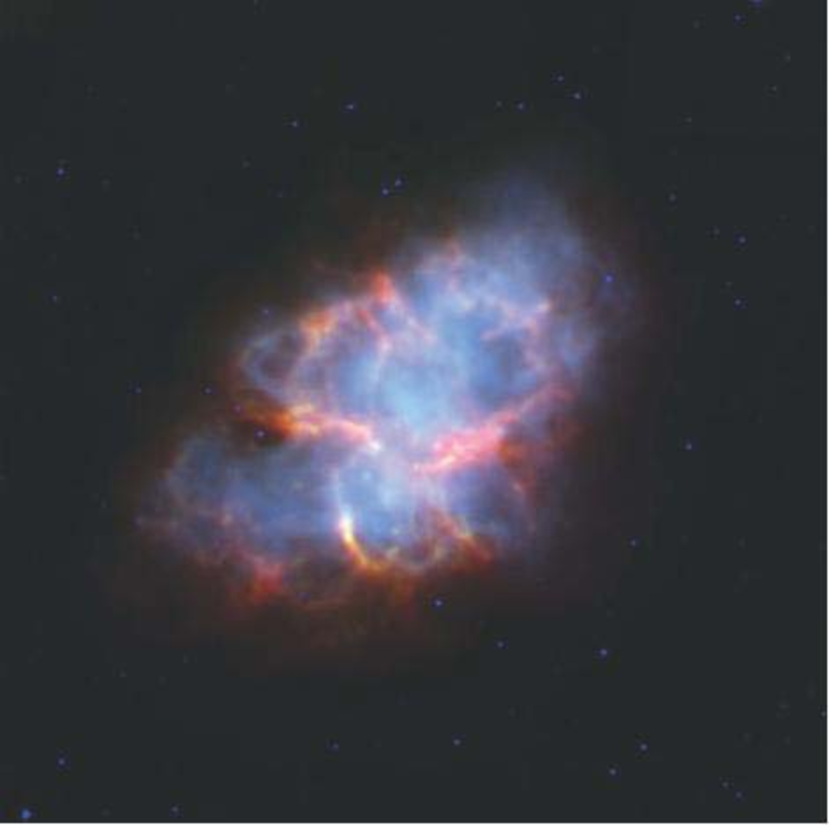
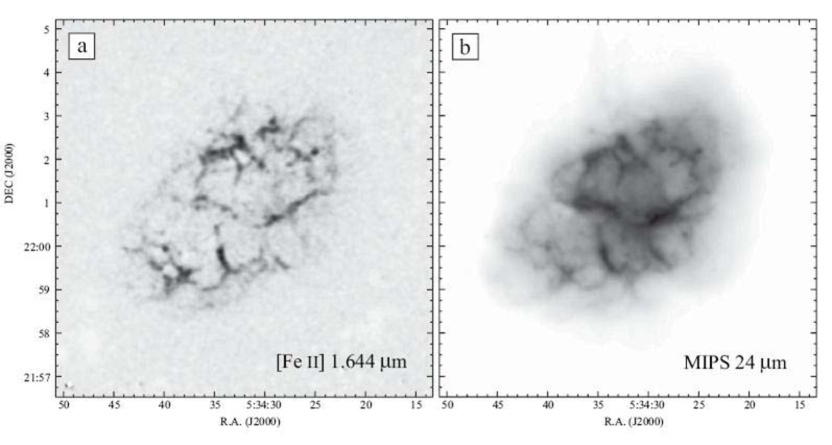
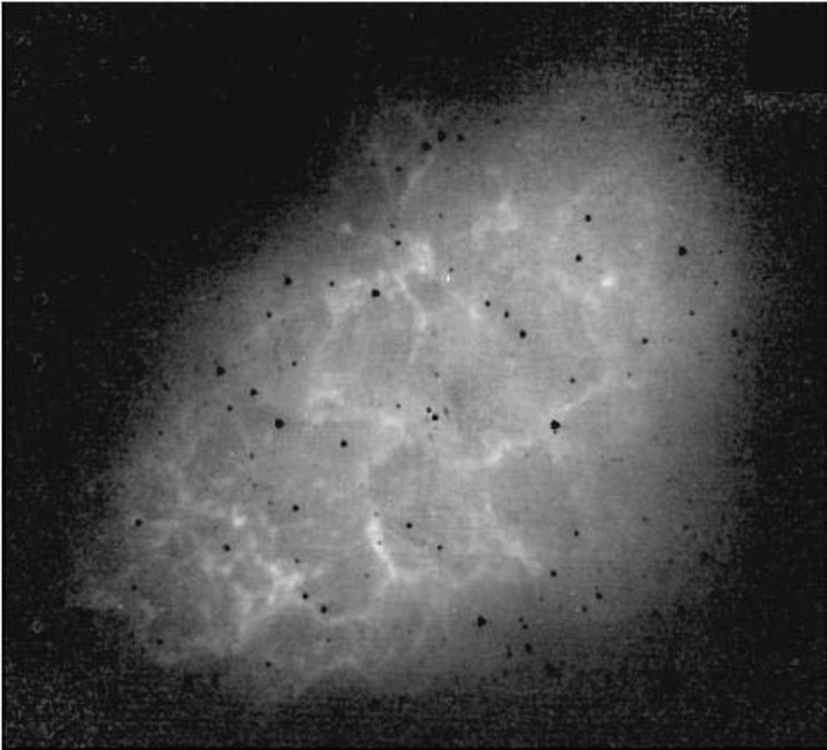
Since [Fe ii] 25.99 emission may contribute to the emission morphology at 24 (see below), it will be useful to compare MIPS to a ground-based image of the [Fe ii] 1.644 emission line. We obtained images of the Crab Nebula on 2001 March 9 using the Ohio State IR Imaging Spectrometer (OSIRIS)333OSIRIS is a collaborative project between the Ohio State University and Cerro Tololo Inter-American Observatory (CTIO) and was developed through NSF grants AST 90-16112 and AST 92-18449. CTIO is part of the National Optical Astronomy Observatory (NOAO), based in La Serena, Chile. NOAO is operated by the Association of Universities for Research in Astronomy (AURA), Inc. under cooperative agreement with the National Science Foundation mounted on the NOAO Cerro Tololo Inter-American Observatory (CTIO) 1.5 m telescope (see panel (a) of Figure 11). OSIRIS has a 10241024 NICMOS3 array, with a pixel scale of 1153 arcsec using the f/2.8 camera. Only a portion of the array is illuminated, yielding a field of view of 11. We used a narrow (/1%) filter to image the extended [Fe ii] 1.644 line emission from the Crab. Six individual exposures of 120 s each were sky subtracted using a median of similar images centered at a position 10 south of the Crab (with slight positional offsets between each), and then shifted and co-added.
We used H-band fluxes from the 2MASS point source catalog for several stars in the field in order to flux calibrate the resulting [Fe ii] image. We also used the H-band image from the 2MASS survey to subtract the continuum emission from the synchrotron nebula that is included in the [Fe ii] filter, in order to produce a true image of the line emission. While the H-band image is not a pure continuum image (the [Fe ii] 1.644 line is included in the H band), the broadband image is dominated by synchrotron continuum and the thermal filaments are barely seen; based on the flux of the [Fe ii] line, we estimate that it contributes only 2–3% of the total flux in the broad H-band filter.
3 ANALYSIS AND RESULTS
3.1 MULTI-WAVELENGTH MORPHOLOGY
3.1.1 IRAC and MIPS morphology
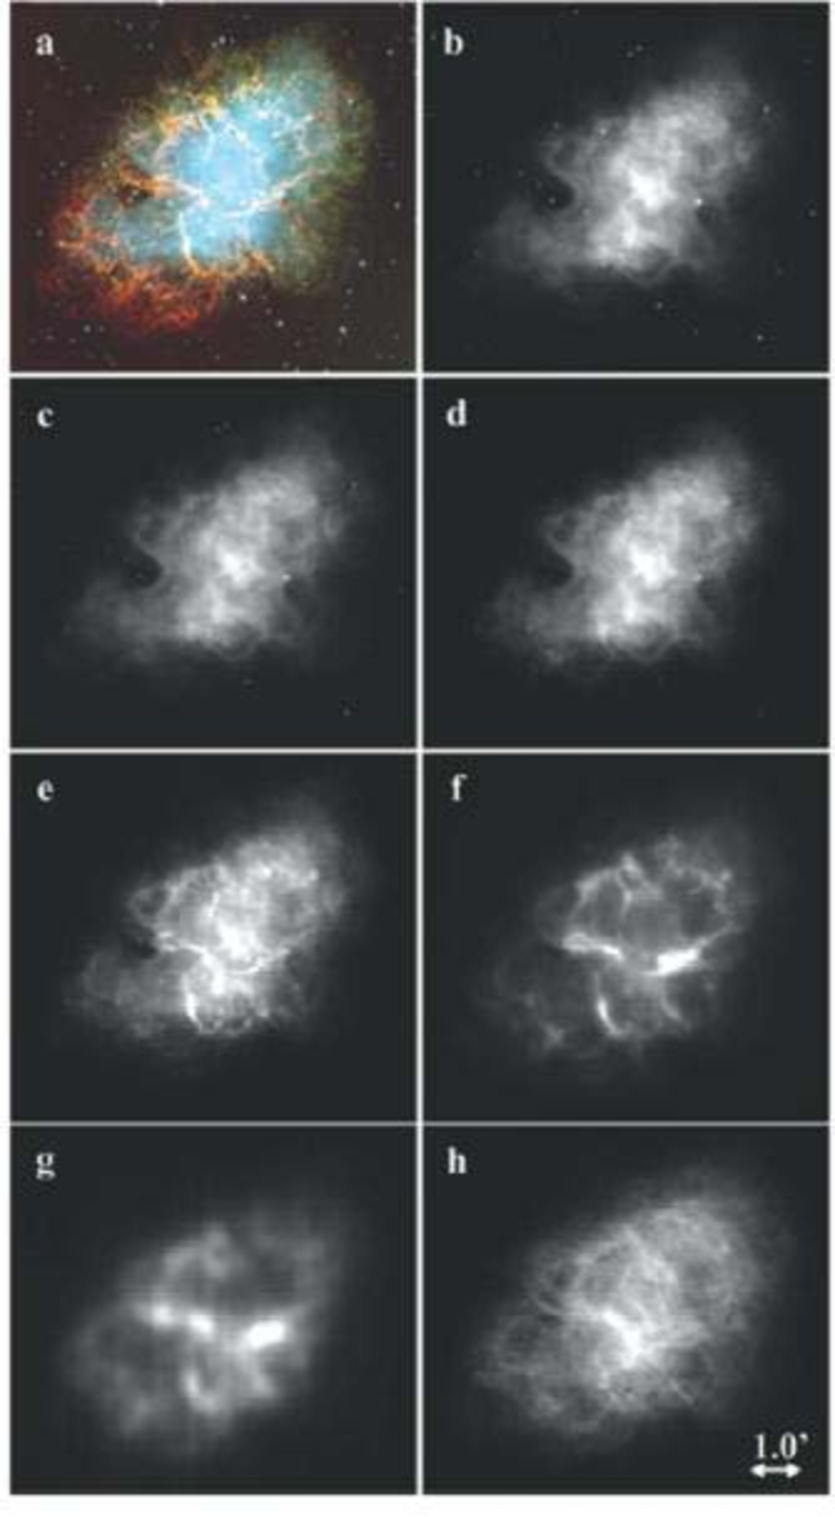
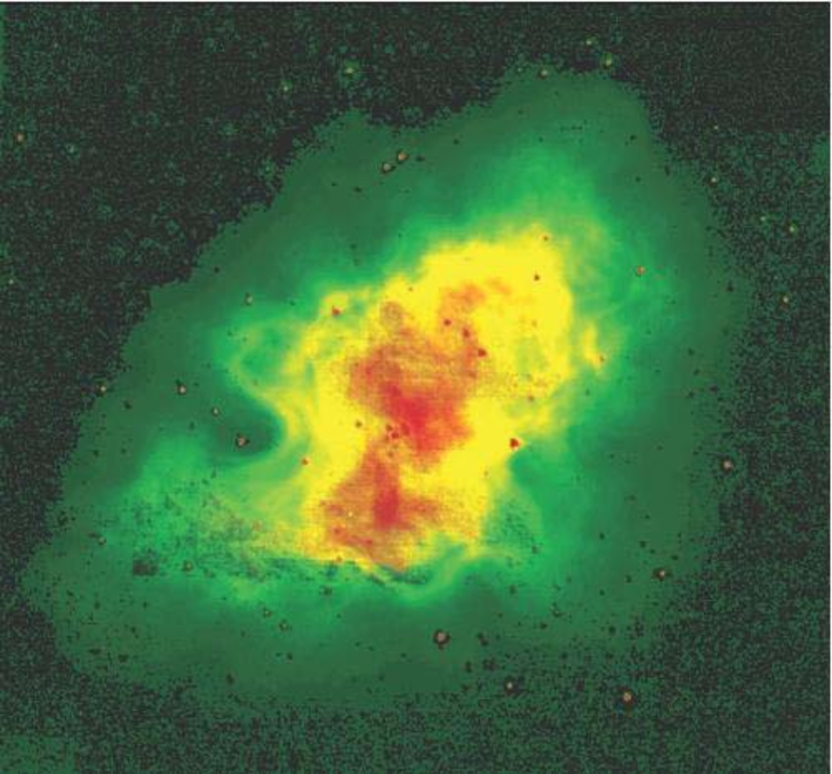
IRAC and MIPS images of the Crab Nebula are displayed in Figure 3. Panel (a) is a three color visual press release image reproduced courtesy of the European Southern Observatory, showing the H filaments that trace out regions of strong hydrogen recombination line emission. The smooth blue background is due to synchrotron radiation from relativistic electrons ejected by the neutron star central engine. Panels (b), (c), and (d) of Figure 3 show IRAC 3.6 , 4.5 , and 5.8 images whose emission is dominated by synchrotron emission. Panel (e) of Figure 3 shows the IRAC 8.0 image, and panels (f) and (g) are MIPS 24 and 70 images. Images in panels (e), (f), and (g) all show filamentary structure that is dominated by strong forbidden line emission and correlates very strongly with the recombination line filaments traced out in the visual H image of panel (a). The NRAO 5 GHz radio image (Bietenholz et al., 2001) is displayed in panel (h) for comparison and it shows both the smooth synchrotron component and the thermal bremsstrahlung in the filaments. The IRAC and MIPS three-color composite image is displayed in Figure 4. Blue represents the IRAC 3.6 morphology that traces out the synchrotron emission, while the green (8.0 ) and red (24 ) map out the [Ar ii] 7.0 and [O iv] 26 (see Section 3.3) emission respectively and trace the filamentary structure seen in H. While the south filament is bright in both green and red, the equatorial filament is dominated by MIPS 24 emission which may suggest the presence of large dust grains (see Section 4.2).
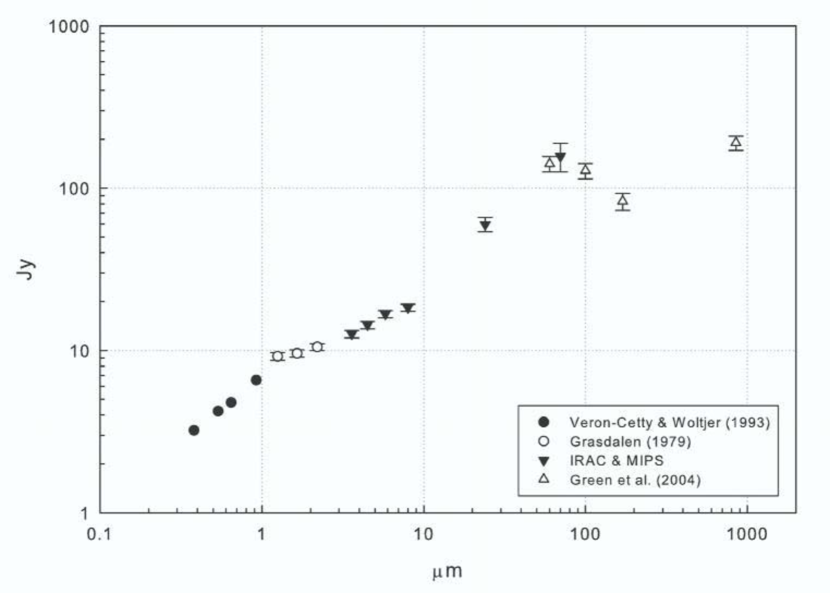
The IRAC and MIPS integrated flux densities of the Crab Nebula are displayed in Figure 5 and listed in Table 1. Uncertainties in the table do not reflect IRAC and MIPS calibration uncertainties. Extended emission correction was applied to the IRAC integrated flux densities of the nebula based on Reach et al. (2005). Figure 5 also includes fluxes in the visible and near IR wavelengths for comparison (Veron-Cetty & Woltjer, 1993; Grasdalen, 1979; Green et al., 2004). It can be seen from the plot that the IRAC and MIPS fluxes agree well with previous data. The IRAC points trace the synchrotron continuum with a spectral index of 0.5, as derived by Douvion et al. (2001). The excess radiation seen at 24-100 above the synchrotron continuum may indicate the presence of a small amount of warm dust in the form of relatively large grains. The excess at 24 may also partly be due to forbidden line emission from [O iv]. Some of the excess in the MIPS 70 filter may be due to [O i] 63 , [O iii] 52 and [O iii] 88 (Green et al., 2004).
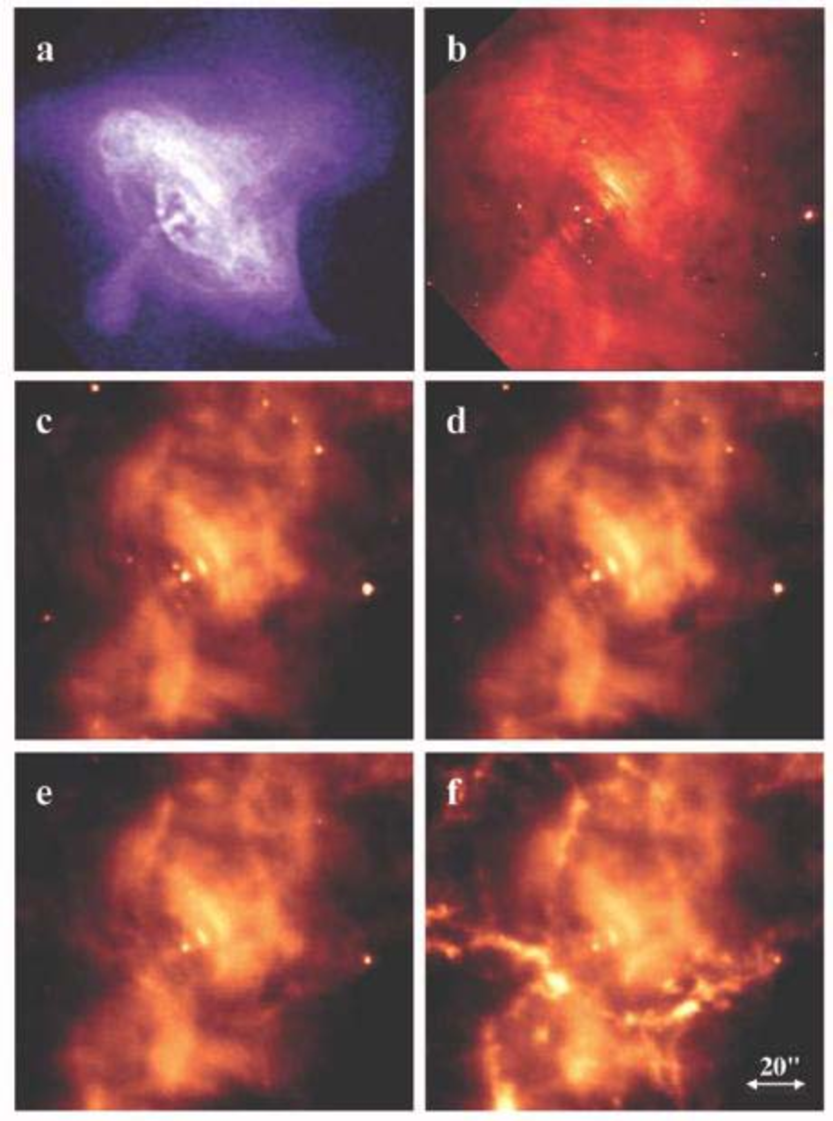
3.1.2 Central Nebula and the Crab Pulsar
Close up IRAC images of the central part of the Crab Nebula are shown in Figure 6. Panel (a) is the CHANDRA X-ray Observatory ACIS-S image (Hester et al., 2002), panel (b) is the HST optical image (Hester et al., 1995), and panels (c) through (f) are IRAC images in order of increasing wavelength. The equatorial torus and polar jets of the X-ray image are clearly visible at all IRAC wavelengths. The position of the point source in the center of IRAC images is coincident with the position of the Crab pulsar in the HST image. The pulsar is not detected in the MIPS images. Additional features identified in the HST image by Hester et al. (1995) are also visible at IRAC wavelengths, including the knot located 38 southeast of the pulsar, aligned with the jet, and the bright arcs (wisps) located 73 northwest of the pulsar.
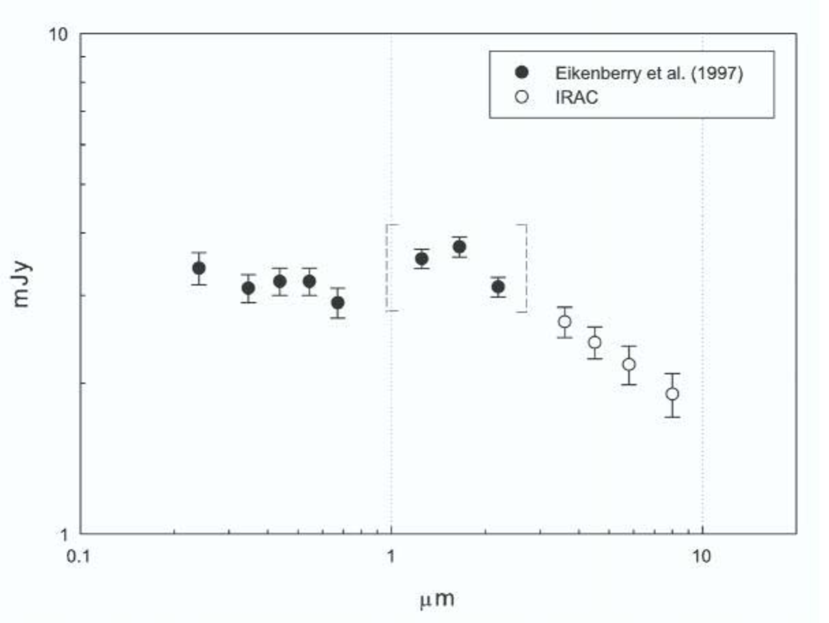
The spectral energy distribution (SED) of the pulsar is shown in Figure 7. The aperture photometry was performed on Spitzer images using an aperture radius of three pixels, a background anulus of 3-7 pixels, and median sky subtraction. The appropriate aperture correction was applied to the resulting fluxes (see The Spitzer Observers Manual). The fluxes likely have additional uncertainties due to high nebular emission around the pulsar, including the IR knot located 06 from the pulsar identified by Hester et al. (1995) and discussed by Sollerman (2003). Visible and near IR points from Table 5 of Eikenberry et al. (1997), in which the visible data comes from Percival et al. (1993), are included in Figure 7 for comparison. While the spectrum of the pulsar in the UV and optical bands remains flat, the IRAC data show a falloff in the IR with a spectral index of -0.4 0.1. Sollerman (2003) found a spectral slope of -0.31 0.02 in the near-IR, consistent with the expected index of -1/3 in the low frequency region of the pulsar spectrum. O’Connor et al. (2005) discuss a possible rollover due to synchrotron self-absorption in the near IR spectrum of the Crab pulsar, but it is still unclear if this is the cause of the falloff seen in in the IRAC data. Table 1 summarized the pulsar measurements and does not include calibration uncertainties of roughly 5% at each IRAC wavelength.
3.1.3 IRS line emission/IRAC image morphology comparisons
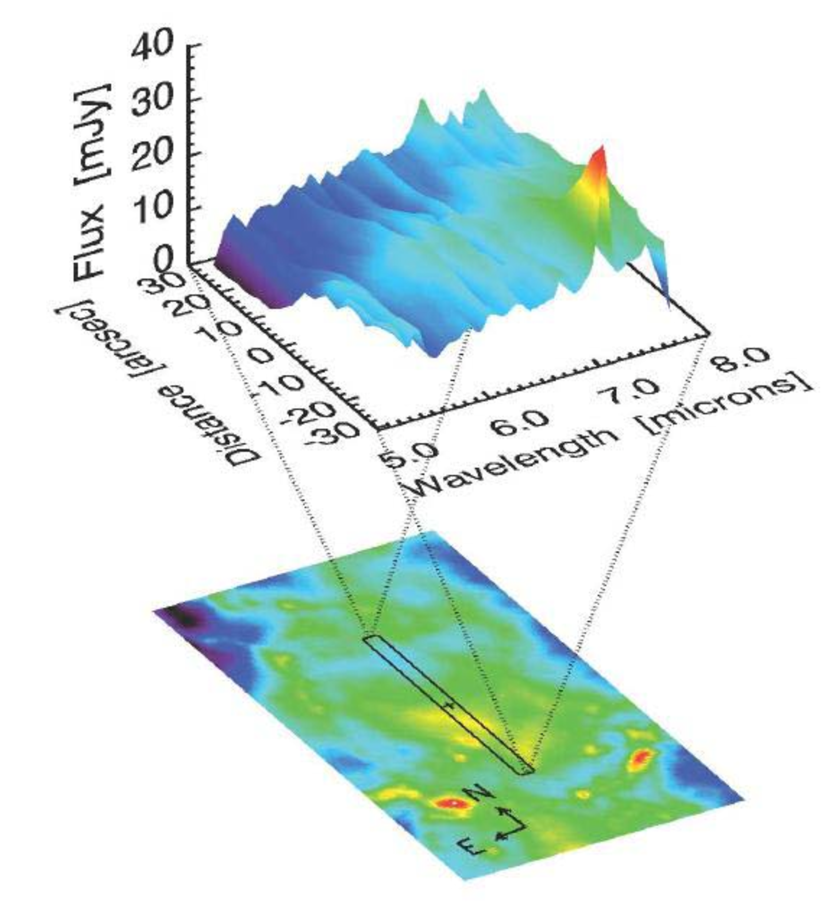
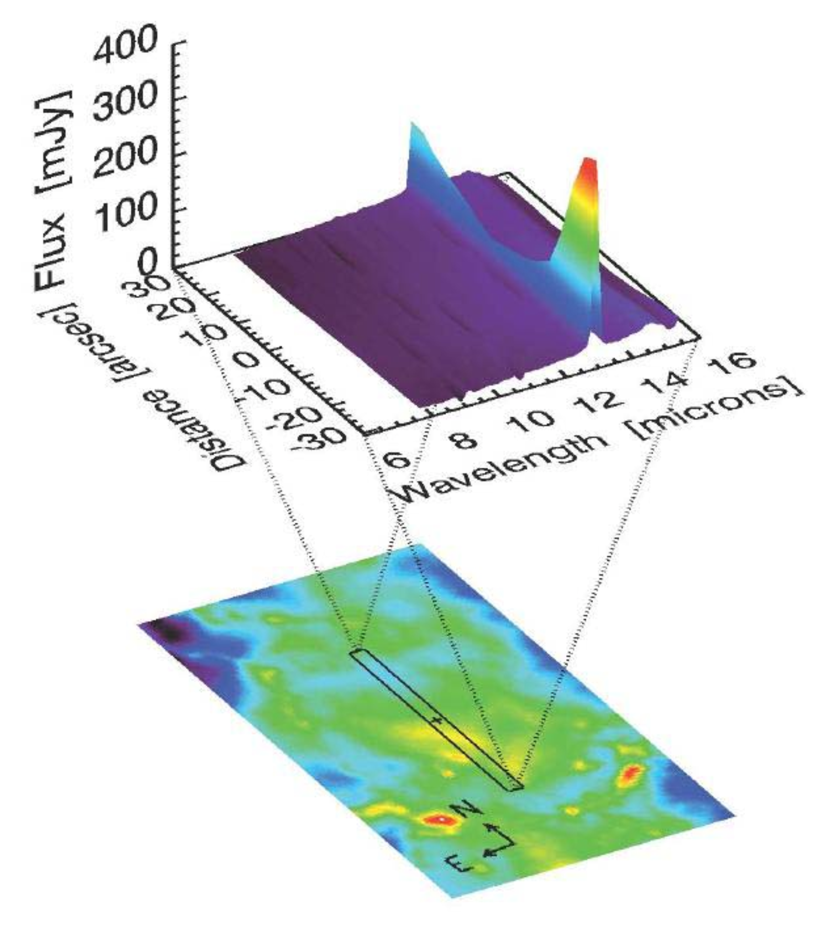
With the long IRS slits in the low-resolution modules it is possible to observe variations in the emission line strengths over the different regions within the nebula sampled by the slits. In general, the IRS long-slit spectra show a relatively spatially smooth synchrotron continuum with much more pronounced spatial structure in the emission line fluxes. These line emission spatial variations can be quite strong and are shown in Figures 8 and 9, which show the correlation between the emission line strength and the observed IRAC 8 spatial structure. It is tempting to infer that the IRAC 8 image spatial structure is due to the 7.0 [ArII] line emission. As can be seen in the figures, there definitely is some spatial correlation, but compared to the integrated synchrotron emission within the IRAC band the flux in the [ArII] line is relatively low and the variation in the line intensity by itself would not be enough to account for all the observed 8 structure. Emission lines at other wavelengths are not necessarily correlated with the structure observed by IRAC. For example Figure 9 shows that although the 12.8 [NeII] line emission has a peak in the region of strong IRAC 8 emission, it also rises in strength in an 8 “hole”. In addition, the region of strongest IRAC emission corresponds to the lowest [NeII] emission.
3.2 IRS Spectra
The IRS modules’ slits are of different sizes and had different orientations on the Crab (see Fig. 1). In order to compare the spectra for the different IRS modules, we have used the smoothness of the synchrotron continuum emission as observed in the IRAC images to calculate scaling factors – in the analysis below the IRS observed data were scaled so that their synchrotron continua were in agreement with the levels seen from the Short-Low module. The scaling factors that were employed to achieve this agreement were 0.24 for the Long-Low module, 1.0 for the Short-High module, and 0.33 for the Long-High module. These scaling factors are all larger by approximately a factor of two compared to the ratio of the beam sizes, which indicates that the nebular emission is not completely smooth over these spatial dimensions. Figure 10 shows the low and high-resolution spectra after this scaling, with the short and long modules’ data combined. The reasons for the slight difference between the synchrotron continuum slopes in the high and low-resolution modules is due to residual uncorrected diffraction effects. The IRS data from the SSC data pipeline is flux-calibrated with point sources. Although corrections have been applied to account for the relatively uniform extent of the synchrotron emission compared to the point-source calibrators, this correction is not perfect.
The fine structure lines observed with the IRS high-resolution modules were fit with Gaussian curves and converted into line strengths. The resultant line identifications, line heights, and line fluxes are given in Tables LABEL:sh and LABEL:lh. As mentioned above, the synchrotron baseline was used to renormalize the Long-High module line strengths to correspond to the Short-High module.
The observed spectra show a steadily-rising continuum due primarily to synchrotron emission, and to a lesser extent to the zodiacal background, with various fine-structure emission lines superimposed. As was discussed above, the strength of the fine structure emission lines varies strongly with position within the nebula – for example, the spectrum at the IRS-Tgt-Cntr position does not show the 7.0 [ArII] emission line that is seen strongly in other positions in the nebula. In the high-resolution spectra the emission lines are observed to be split due to Doppler shifts in the front and back sides of the expansion envelope. The average / difference between the front and back shell emission line wavelengths is 0.00843, which corresponds to a shell expansion velocity of 1264 km s-1.
The IRS fine structure emission lines show evidence of high excitation that may be caused by photoionization by synchrotron radiation. For example, we observe emission from [NeV] which has an ionization energy of 97 eV. Given the violence of the Crab expansion, shocks sufficient to excite forbidden lines are also not unexpected. With the large number of fine structure emission lines observed by the IRS, it should be possible in principle to derive electron temperatures and densities from the line ratios. Unfortunately, for all of the lines coming from the same ion, the line pairs appear in different IRS modules. Modules’ different aperture sizes, different slit position angles, coupled with the observed spatial structure in the emission line emission regions, result in line ratios that have large and unquantifiable uncertainties. For example, in comparing the measured 15.5 /36 line ratio for [NeIII], we find ratios of 3.3 for the red-shifted lines, and 5.6 for the blue-shifted lines. For temperatures around 10,000K the predicted ratio for these lines ranges from 11 to 38 for electron number densities ranging from 10 to 107 cm-3. Similarly for the 18.7 / 33.4 line ratio for [SIII] we find that the measured values for both the red and blue lines are less than the predicted level even for the lowest electron densities. This indicates that there is more line flux entering the Long-High IRS aperture than is expected, even after normalization using the synchrotron continuum baseline. Given the spatial structure that can be seen in the images of the IRS high-resolution module slits this is not surprising – the larger Long-High slit must contain more bright emission knots than does the Short-High slit.
3.3 Line emission or Dust in the MIPS 24 Image?
IRS spectra of the Crab discussed above show that a bright emission feature — either [Fe ii] 25.99 or [O iv] 25.89 — contributes significantly to the MIPS 24 image. Both lines have been observed in young supernova remnants and the Crab (e.g., Arendt et al., 1999; Oliva et al., 1999; Green et al., 2004). In Figure 11 we compare the MIPS 24 image to our ground-based near-IR image of the Crab taken through a narrow filter that isolates [Fe ii] at 1.644 , with continuum emission subtracted. The major difference between the two images in Figure 11 is in the filaments that run east to west across the middle of the remnant; while these filaments appear thin and rather faint compared to some of the brighter [Fe ii] 1.644 filaments in the north and south of the remnant in Figure 11, they are by far the brightest emission features in the 24 MIPS image in Figure 11. Why are these filaments so much brighter in the MIPS 24 image?
An issue of potential concern is whether the narrow bandpass of the 1.644 filter cuts-out some of the emission from fast moving filaments that may be Doppler shifted to extreme velocities, because this could cause spurious differences between the MIPS image and the [Fe ii] 1.644 emission map. However, the observed velocities from the brightest filaments are actually at relatively low velocities in the pinched waist of the Crab. The Doppler shifts are in the range of 500 to 1200 km s-1, with most filaments moving at 800 to 900 km s-1 (Smith 2003). These velocities are well within the 1% (1500 km s-1) FWHM bandpass of the [Fe ii] filter. Even if some of the fainter and faster filaments are lost due to their Doppler shifts, it is reassuring that the relative brightness distribution of the filaments is similar to that in previous [Fe ii] and other IR emission-line images of the Crab (e.g., Hester et al., 1990; Graham et al., 1990).
Thus, the striking differences in brightness between the various filaments of the Crab in the [Fe ii] 1.644 and 24 MIPS image are real, and are due either to 1) extreme differences in physical conditions that cause very different relative strengths of [Fe ii] 25.99 and 1.644 in certain filaments, 2) differences in ionization level or chemical abundances that cause stronger [O iv] 25.89 or weaker [Fe ii] emission there, or 3) substantially more warm dust in those filaments.
The flux ratio of [Fe ii] 1.644 /25.99 depends on both electron density and temperature, in the sense that the ratio tends to be larger for higher densities and especially for higher temperatures. The relative strengths of IR lines of [Fe ii] can be predicted by quantitative models like those described by Hartigan et al. (2004). In the Crab’s filaments, typical electron densities and temperatures derived from visual wavelength diagnostics are cm-3 and K (e.g., Fesen & Kirshner, 1982; MacAlpine et al., 1989; Davidson & Fesen, 1985). Under these conditions, one would expect [Fe ii] 1.644 to be roughly 3–4 times stronger than the 25.99 line. From our flux-calibrated narrowband image, we measure a total [Fe ii] 1.644 flux for the whole Crab Nebula of 6.3(1.5)10-11 ergs s-1 cm-2. If the average physical conditions quoted above dominate throughout the filaments, the total 25.99 flux should be only 1.5–210-11 ergs s-1 cm-2. The total observed MIPS 24 flux density is about 60 Jy (310-10 erg s-1 cm-2 ), and is clearly dominated by emission from the filaments, not the synchrotron continuum (Fig. 11). Integrated over the MIPS filter bandpass, the total flux included in the 24 filter is then 1.510-9 erg s-1 cm-2. Thus, [Fe ii] 25.99 should not make much of a contribution to the MIPS 24 image (only about 1% of the total flux included in that filter).
On the other hand, if the filaments have cores that are shielded from the UV radiation field of the synchrotron nebula, then the prevailing electron temperatures traced by visual-wavelength diagnostics might not apply, and the expected [Fe ii] 1.644 /25.99 ratio could be very different. For example, if the electron temperature were as low as 1,000–2,000 K in the cores of some filaments, then at the same density of 1000 cm-3 the 25.99 line could be more than 1000 times stronger than [Fe ii] 1.644 . However, under these same conditions, [Fe ii] 5.430 would be roughly 800 times brighter than [Fe ii] 1.644 , and almost as strong as the 25.99 line. Based on the rather weak 5.34 line seen in IRS spectra, and the fact that the “equatorial” filaments are not conspicuous in the IRAC 5.8 image, it would seem that the filaments do not contain shielded cool cores at very low temperatures, and therefore, that the majority of the MIPS 24 emission is not [Fe ii].
Instead, the bright emission feature in the MIPS 24 filter is most likely dominated by the [O iv] 25.89 line. This agrees with our analysis of the IRS spectra, suggesting that those conclusions are valid across the remnant in areas not covered by the IRS aperture. In visual wavelength spectra, the [O iii] 5007 line is particularly bright in the equatorial filaments, compared to other emission lines (Smith, 2003; MacAlpine et al., 1989). Thus, it stands to reason that the much brighter emission from equatorial filaments in the MIPS 24 image is due to enhanced [O iv] there as well, either because of higher ionization or enhanced oxygen abundances compared to the other filaments in the Crab Nebula.
Another possibility is that emission from large dust grains in the filaments contributes to the excess equatorial emission seen by MIPS. Green et al. (2004) found that the gas:dust mass ratio in the Crab was comparable to the normal interstellar value, with an upper limit to the dust mass of 0.2 M⊙. However, the presence of strong line emission in the MIPS 24 image makes it difficult to put reliable constraints on the amount of dust, if any, in the Crab Nebula. The MIPS 70 image also shows enhanced emission from the same equatorial filaments, which once again, could result from a contribution of either warm dust or [O iii] 88.36 emission. However, Green et al. (2004) found that the ISO/LWS spectrum of the Crab was dominated by continuum from dust and synchrotron, not line emission. Thus, the apparent excess far-IR emission above the synchrotron continuum level in the integrated flux density of the Crab (Fig. 5) may be due to either dust or line emission.
Whether the bright MIPS emission is caused by excess dust or by stronger high-excitation emission lines, the comparison of the [Fe ii] 1.644 image and the MIPS 24 image reinforces the long-held notion that there is something very different about the “equatorial” filaments that run east–west across the middle of the Crab Nebula. These are the same filaments that are known to have different chemical abundances than the rest of the Crab – most notably a higher He/H abundance (e.g. Uomoto & MacAlpine, 1987; Fesen & Kirshner, 1982). One hypothesis is that the supernova exploded into a pre-existing circumstellar ring, much like the ring around SN 1987A (Sugerman et al., 2002) or the ring that is thought to have been swept up by the Crab-like SNR 0540-69.3 in the LMC (Morse, 2006). Indeed, the filaments that bisect the Crab seem to connect the dark bays of the synchrotron nebula, which were presumably formed as the expanding plerion was pinched by an equatorial disk or ring (Fesen et al., 1992). Additionally, the global kinematics of the Crab’s shell, traced best in [O iii] emission, seem to be bipolar, with a pinched waist coinciding with these “equatorial” filaments (MacAlpine et al., 1989; Smith, 2003). Finally, the mysterious northern “jet” or “chimney” (Chevalier & Gull, 1975; Gull & Fesen, 1982) runs along an axis perpendicular to this putative equatorial ring. Taken together, these clues may suggest that the Crab’s progenitor star had a rotation axis oriented roughly north/south, and that the axis changed dramatically during the supernova explosion to match the currently-observed axis of the pulsar’s jet at about –45.
3.4 Estimate of Dust Mass
The presence of the bump between 24 and 100 in the integrated flux density of the Crab Nebula may suggest that there is a small amount of dust present in the nebula (see Figure 5). In order to estimate a rough upper limit on the dust mass that may account for this infrared excess, we attempted to remove the contributions from line emission and synchrotron continuum.
Green et al. (2004) found that the excess in the ISOPHOT fluxes between 60 and 100 can be explained by a small amount of warm dust corresponding to 0.01–0.07 M⊙ of silicates at 45 K or 0.003–0.02 M⊙ of graphite at 50 K. We followed the method of Green et al. (2004) and subtracted the extrapolated synchrotron continuum from the MIPS 24 and 70 fluxes based on the synchrotron power law 25.9(/18.7 Thz)-0.5 given by Green et al. (2004) and derived by Douvion et al. (2001) from the ISOCAM mid-infrared spectro-imaging observations. Based on the ISO spectra, Green et al. (2004) also found that the line emission contribution to the 60 and 100 fluxes is 8 % and 7 %, respectively. Since ISO spectra show no additional emission lines centered at 70 , we approximate that the upper limit on the contribution from line emission to the 70 integrated flux is on the order of 7 %, corresponding to 11 Jy. The main difficulty arises in estimating the contribution from line emission to the 24 flux. By integrating the IRS spectrum over the MIPS 24 bandpass, we find that the contribution from line emission is approximately 5 % of the total flux in the beam. For the purpose of estimating a rough upper limit on the dust mass, we applied this ratio to the total integrated flux at 24 , which gives a line contribution of 2.8 Jy. Since the strength of line emission in the Crab has a strong spatial dependence and peaks along the filaments, we expect that this assumption significantly underestimates the amount of line emission at 24 . The IRS spectrum used for the estimate is centered on a region near the center of the nebula that does not include any filaments.
After subtracting the synchrotron continuum and line emission from the MIPS 24 and 70 data, and ISOPHOT 60 and 100 data from Green et al. (2004), we fitted a blackbody distribution to the residual flux densities. The resulting blackbody distribution peaks at a temperature of 74 K, with (Fλ)max 6.2810-9 erg s-1 cm-2. We expect that these values are highly uncertain due to the sensitivity of the blackbody fit to the 24 data point. We calculate a dust mass using the following relation
| (1) |
where is the grain size, is the grain density, is the distance to the Crab Nebula, and is the dust temperature (Gehrz et al., 1998). Assuming a grain size of 10 , graphite grains ( = 2.25 gm cm-3), and a distance of 2.1 kpc, we derive a dust mass of 0.001 M⊙. We emphasize that due to the unknown line contribution to the 24 flux, this number is only a rough estimate of the dust mass. If we assume that the excess emission at 24 is dominated by line emission and that the blackbody peaks at the 70 data point, we find a dust mass of 0.004–0.010 M⊙ for graphite grains and 0.006–0.015 M⊙ for silicates.
3.5 Synchrotron Spectra
IRAC 3.6 and 4.5 images are dominated, for the Crab, by the synchrotron emission that has been observed from radio through X-ray frequencies, with only little evidence for the filamentary line emission seen, e.g., in IRAC 8 or in the MIPS 24 images. The very hard (flat) radio spectra in plerions (i.e., filled-center supernova remnants) like the Crab imply correspondingly hard relativistic electron distributions; the origins of these are still unknown (Nodes et al., 2004). Studies of the variation of the spectral index, i.e., the local slope of the synchrotron spectrum, as a function of both frequency and position in the remnant, provide the key data necessary to understand both relativistic particle acceleration and loss processes.
We began our examination of the spectral index as a function of position using IRAC 3.6 and 4.5 images, as shown in Figure 12. Note that the emission associated with the jet and torus is flat (red) and extends far from the pulsar with little or no steepening visible. The underlying nebular emission progressively steepens with distance. This steepening away from the jet and torus is also seen in the power law indices derived by Willingale et al. (2001) from XMM-Newton observations around 2 keV. At present, it is not possible to determine whether this steepening is with distance from the pulsar or distance from the jet; this distinction is physically important for understanding the acceleration and transport of relativistic particles. The absolute values of the spectral indices would be uncertain by approximately if we estimate that the calibration uncertainties in each of the IRAC bands are approximately 5%. However, the integrated fluxes between 3.6 and 4.5 yield a spectral index similar to the derived value of 0.5 by Douvion et al. (2001), and therefore we do not include calibration errors in the discussion below. Any uncertainties in the overall spectral index do not affect the spatial variations in the indices as seen in Figure 12.
We next looked at the overall shape of the synchrotron spectrum by examining its mapping into “color-color” space, using the technique described by Katz-Stone et al. (1993). In this method, we add information at optical wavelengths, and then plot vs. for all positions in the Crab. This plot is then compared to various fiducial spectral shapes to determine the underlying broadband shape of the synchrotron spectrum. This method provides a powerful way to map out the synchrotron spectrum in detail, although measurements are available at only a small number of wavelengths. It is based on the ansatz that the shape of the relativistic electron distribution is constant throughout the nebula; spatial variations in magnetic field strength and in the degree of adiabatic and radiative losses then lead to spatial variations in the observed spectral index.
Our first “color-color” diagram is shown in Figure 13, where we have used the visual spectral indices from Veron-Cetty & Woltjer (1993), who calculated the mean spectral index in 10″boxes between 9241 Å and 5364 Å to compare with equivalent 10 box spectra calculated from IRAC 3.6 and 4.5 images. The IRAC fluxes were corrected for extinction using the interstellar extinction values from Rieke & Lebofsky (1985) and an adopted value for AV of 1.5. The combination of statistical errors of approximately 1% in each band and variations in inhomogeneities between different lines of sight together are responsible for the scatter of the data around the best fit spectral shape.
Comparison of the “color-color” data with fiducial homogeneous spectral models shows that these models are not adequate in describing the data. Two standard spectral shapes are shown for comparison – the JP (Jaffe & Perola, 1973) model in which relativistic electrons are continuously isotropized in pitch angle, leading to an exponentially cutoff spectrum at high energies, and the KP (Kardashev, 1962) model where losses lead to an anisotropic pitch angle distribution, and a high frequency power law. Each spectral model is anchored to the 0.3 spectral index observed throughout the nebula at radio frequencies (Swinbank, 1980). Here, it can be seen that both the JP exponential cutoff, and KP spectral shapes are ruled out by the relationship between the optical and IR fluxes. This conclusion is not affected by the calibration errors discussed above; these simply result in a uniform translation of the data in the color-color plane, and would still not agree with the models.
Although a completely new relativistic electron distribution could be derived to fit the data, a much simpler alternative is to explore simple combinations of the standard spectra. We show one such combination in Figure 13, a “hybrid” model representing the presence of two KP spectra at each position. The two spectra shown here have cutoff frequencies (low frequency brightnesses) in the ratios of . These particulars are not relevant, since there are a variety of spectral combinations, with different numbers of components, cutoff frequencies, normalizations, etc., that could equally well fit the data. However, they all point to some inhomogeneities along the line of sight which smear out the spectrum (reduce its curvature) in the optical-IR regime.
In the Crab, the inhomogeneity indicated by the spectral shape likely arises from the superposition of the jet and torus onto the larger nebula. This can be be seen by subtracting IRAC 3.6 image from the 5.8 image, with the resulting emission seen in Figure 16. The most striking thing in this image is the absence of the torus and jet regions that dominate the emission in both bands. This is due to the flatter nature of those regions, which extend over large distances in the nebula. Thus, our data are consistent with emission that shows little or no spectral steepening with distance from the pulsar, superposed on the rest of the nebula, which does steepen. The existence of these two components was suggested by Bandiera et al. (2002) in their comparison between 20 cm and 1.3 mm images. Green et al. (2004) disagreed with these conclusions based on their SCUBA 850 images, but their data also show excess flattening due to superposed components. The fact that the torus and jet remain flat to higher frequencies than the rest of the nebula makes them much more prominent in IR, optical and X-ray images, compared to those in the radio (Bietenholz et al., 2004). It also means that sophisticated models will be necessary to understand the acceleration and transport of relativistic particles throughout the nebula.
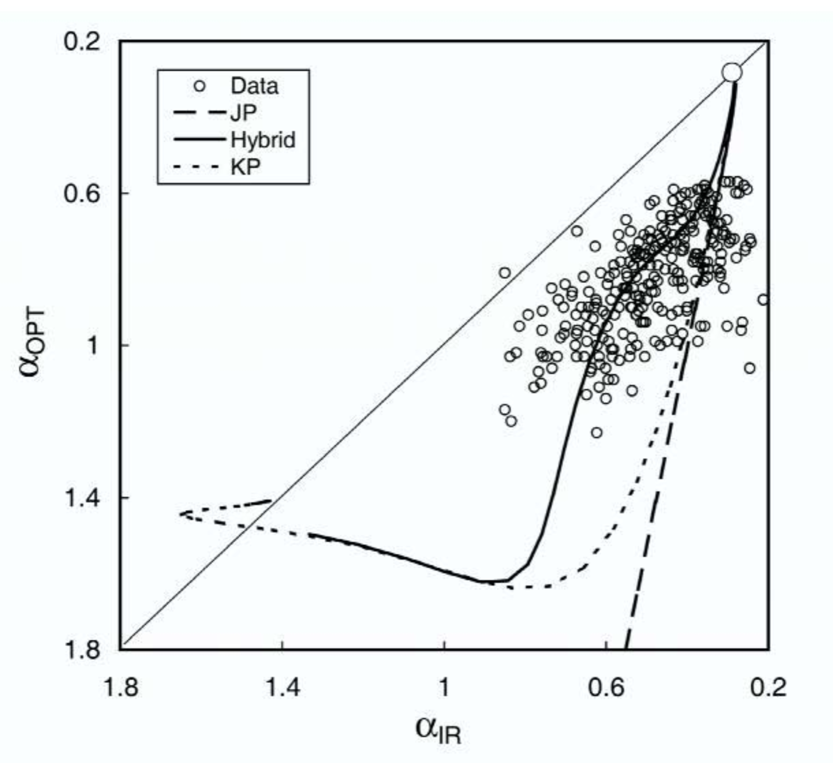
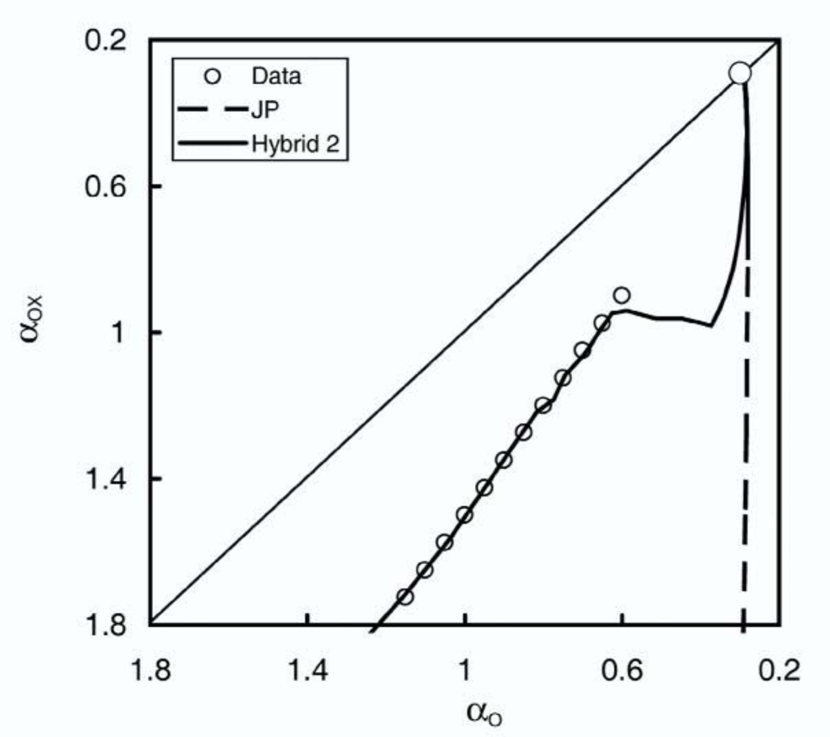
To explore the higher energy end of the spectrum, we used a second color-color diagram, now relating the optical spectral indices to those between the optical and X-ray, as presented by Bandiera et al. (1998). For the data, we took the trend line between which can be represented as . We consider the very weak X-ray data with (above line (c) in their Figure 3) to be unreliable because it shows no correlation with the optical spectral indices. Note that the detectable X-ray synchrotron nebula is considerably smaller than at lower frequencies. The vs. data line (represented by a series of open circles) and spectral shape models are shown in Figure 14.
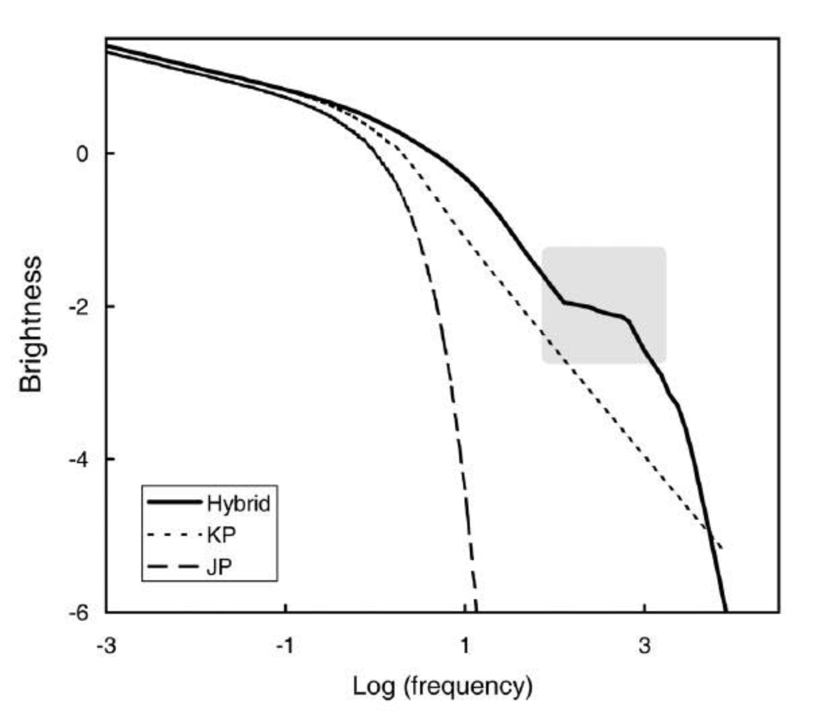
Neither the JP or KP models, nor the hybrid model developed above can explain this shorter wavelength data. The basic problem is that an exponential cutoff is needed, but it cannot follow a standard JP shape, because any spectral steepening seen in the IR would predict X-ray fluxes orders of magnitude lower than observed. So the exponential cutoff must somehow be pushed out to shorter wavelengths than expected. We empirically constructed such a model by modifying the optical/IR “hybrid” to introduce a “bump” just below the X-rays, followed by an exponential cutoff. This empirical model is labeled as hybrid 2 and shown both in color-color space (Figure 14) and in normal log(brightness) vs log(frequency) space in Figure 15. It starts at long wavelengths (low energies) with the radio spectral index and fits the variations in the IR-optical and optical-X-ray spectral indices.
Although this model is not unique, it has two characteristics that must be present in any model that fits the data. First, the spectra cut off very rapidly (possibly exponentially) in the X-ray regime, indicative of strong radiative losses. Second, there needs to be a “bump” in the spectrum somewhere in the ultraviolet. The shaded box in Figure 15 shows the region of uncertainty from our analysis; no direct measurements are available here. However, without some fairly abrupt offset to the smooth spectral shape, models including X-ray data would fail as badly as the JP and KP models shown in Figure 14. Such an offset or bump in the spectrum is expected due to the pileup of relativistic electrons that result from energy losses at higher energies (e.g. Reynolds , 2003), when the low frequency spectral index is flatter than 0.5, as is true for the Crab. To our knowledge, there has not been any previous observational evidence for this pileup.
4 CONCLUSIONS
We briefly summarize the main conclusions presented by our Spitzer Space Telescope IR imaging and spectroscopic observations of the Crab Nebula:
1. A comparison of the morphology from the x-ray to the radio shows that the synchrotron component and filaments dominate at different wavelengths.
2. We have derived a broadband shape to the synchrotron spectrum which shows evidence for multiple components along the line of sight, likely due to the torus and jet which remain flat to large distances from the pulsar, superposed on the broad nebular emission that steepens with increasing distance. At shorter wavelengths, the derived spectral shape is consistent with the expected pileup of relativistic electrons just below an exponential cutoff in X-rays.
3. We have measured the flux density of the nebula and the pulsar. The smooth background of the nebula and the pulsar are dominated by synchrotron emission and a large fraction of the emission from the filaments in the images is due to forbidden line emission from Ar, Ne, O, and Fe.
4. We find a paucity of dust. The small grain component seems to be missing entirely and we see no evidence for silicate emission. The total emission at long wavelengths from large grains implies a total dust mass in the nebula of less than 1% of a solar mass.
5. In the IRS spectra, we see Doppler shifted emission from both the front and back sides of the expanding shell, and we measure a radial expansion velocity of roughly 1264 km s-1.
References
- Arendt et al. [1999] Arendt, R. G., Dwek, E., & Moseley, S. H. 1999, ApJ, 521, 234
- Bandiera et al. [1998] Bandiera, R., Amato, E., & Woltjer, L. 1998, Memorie della Societa Astronomica Italiana, 69, 901
- Bandiera et al. [2002] Bandiera, R., Neri, R., & Cesaroni, R. 2002, A&A, 386, 1044
- Bietenholz et al. [2001] Bietenholz, M. F., Frail, D. A., & Hester, J. J. 2001, ApJ, 560, 254
- Bietenholz et al. [2004] Bietenholz, M. F., Hester, J. J., Frail, D. A., & Bartel, N. 2004, ApJ, 615, 794
- Blair et al. [1997] Blair, W. P., Davidson, K., Fesen, R. A., Uomoto, A., MacAlpine, G. M., & Henry, R. B. C. 1997, ApJS, 109, 473
- Burbidge et al. [1957] Burbidge, E. M., Burbidge, G. R., Fowler, W. A., & Hoyle, F. 1957, Reviews of Modern Physics, 29, 547
- Chevalier & Gull [1975] Chevalier, R. A., & Gull, T. R. 1975, ApJ, 200, 399
- Clayton [1982] Clayton, D. D. 1982, QJRAS, 23, 174
- Davidson & Fesen [1985] Davidson, K., & Fesen, R. A. 1985, ARA&A, 23, 119
- Douvion et al. [2001] Douvion, T., Lagage, P. O., Cesarsky, C. J., & Dwek, E. 2001, A&A, 373, 281
- Dwek [1988] Dwek, E. 1988, ApJ, 329, 814
- Dwek [2004] Dwek, E. 2004, ApJ, 607, 848
- Eikenberry et al. [1997] Eikenberry, S. S., Fazio, G. G., Ransom, S. M., Middleditch, J., Kristian, J., & Pennypacker, C. R. 1997, ApJ, 477, 465
- Fazio et al. [2004] Fazio, G. G., et al. 2004, ApJS, 154, 10
- Fesen & Blair [1990] Fesen, R., & Blair, W. P. 1990, ApJ, 351, L45
- Fesen & Kirshner [1982] Fesen, R. A., & Kirshner, R. P. 1982, ApJ, 258, 1
- Fesen et al. [1992] Fesen, R. A., Martin, C. L., & Shull, J. M. 1992, ApJ, 399, 599
- Gehrz [1988] Gehrz, R. D. 1988, Nature, 333, 705
- Gehrz & Ney [1987] Gehrz, R. D., & Ney, E. P. 1987, Proc. Nat. Acad. Sci. (USA), 84, 6961
- Gehrz & Ney [1990] Gehrz, R. D., & Ney, E. P. 1990, Proc. Nat. Acad. Sci. (USA), 97, 4354
- Gehrz et al. [1998] Gehrz, R. D., Truran, J. W., Williams, R. E., & Starrfield, S. 1998, PASP, 110, 3
- Graham et al. [1990] Graham, J. R., Wright, G. S., & Longmore, A. J. 1990, ApJ, 352, 172
- Grasdalen [1979] Grasdalen, G. L. 1979, PASP, 91, 436
- Green et al. [2004] Green, D. A., Tuffs, R. J., & Popescu, C. C. 2004, MNRAS, 355, 1315
- Gull & Fesen [1982] Gull, T. R., & Fesen, R. A. 1982, ApJ, 260, L75
- Hartigan et al. [2004] Hartigan, P., Raymond, J., & Pierson, R. 2004, ApJ, 614, L69
- Hester et al. [1990] Hester, J. J., Graham, J. R., Beichman, C. A., & Gautier, T. N. 1990, ApJ, 357, 539
- Hester et al. [1995] Hester, J. J., et al. 1995, ApJ, 448, 240
- Hester et al. [2002] Hester, J. J., et al. 2002, ApJ, 577, L49
- Higdon et al. [2004] Higdon, S. J. U., et al. 2004, PASP, 116, 975
- Houck et al. [2004] Houck, J. R., et al. 2004, ApJS, 154, 18
- Jaffe & Perola [1973] Jaffe, W. J., & Perola, G. C. 1973, A&A, 26, 423
- Kardashev [1962] Kardashev, N. S. 1962, Soviet Astronomy, 6, 317
- Katz-Stone et al. [1993] Katz-Stone, D. M., Rudnick, L., & Anderson, M. C. 1993, ApJ, 407, 549
- Kennel & Coroniti [1984] Kennel, C. F., & Coroniti, F. V. 1984, ApJ, 283, 710
- Lyubarsky [2002] Lyubarsky, Y. E. 2002, MNRAS, 329, L34
- MacAlpine et al. [1989] MacAlpine, G. M., McGaugh, S. S., Mazzarella, J. M., & Uomoto, A. 1989, ApJ, 342, 364
- Marsden et al. [1984] Marsden, P. L., Gillett, F. C., Jennings, R. E., Emerson, J. P., de Jong, T., & Olnon, F. M. 1984, ApJ, 278, L29
- Morse [2006] Morse, J.A., Smith, N., Blair, W.P., Kirshner, R.P., Winkler, P.F., & Hughes, J.P. 2006, ApJ, in press.
- Nodes et al. [2004] Nodes, C., Birk, G. T., Gritschneder, M. & Lesch, H. 2004, A&A 423, 13
- O’Connor et al. [2005] O’Connor, P., Golden, A., & Shearer, A. 2005, ApJ, 631, 471
- Oliva et al. [1999] Oliva, E., Moorwood, A. F. M., Drapatz, S., Lutz, D., & Sturm, E. 1999, A&A, 343, 943
- Percival et al. [1993] Percival, J. W., et al. 1993, ApJ, 407, 276
- Reach et al. [2005] Reach, W. T., et al. 2005, PASP, 117, 978
- Reynolds [2003] Reynolds, S. astro-ph/0308483
- Rieke et al. [2004] Rieke, G. H., et al. 2004, ApJS, 154, 25
- Rieke & Lebofsky [1985] Rieke, G. H., & Lebofsky, M. J. 1985, ApJ, 288, 618
- Sankrit et al. [1998] Sankrit, R., et al. 1998, ApJ, 504, 344
- Seward et al. [2006] Seward, F. D., Gorenstein, P., & Smith, R. K. 2006, ApJ, 636, 873.
- Smith [2003] Smith, N. 2003, MNRAS, 346, 885
- Sollerman [2003] Sollerman, J. 2003, A&A, 406, 639
- Sugerman et al. [2002] Sugerman, B. E. K., Lawrence, S. S., Crotts, A. P. S., Bouchet, P., & Heathcote, S. R. 2002, ApJ, 572, 209
- Swinbank [1980] Swinbank, E. 1980, MNRAS, 193, 451
- Uomoto & MacAlpine [1987] Uomoto, A., & MacAlpine, G. M. 1987, AJ, 93, 1511
- Veron-Cetty & Woltjer [1993] Veron-Cetty, M. P., & Woltjer, L. 1993, A&A, 270, 370
- Werner et al. [2004] Werner, M. W., et al. 2004, ApJS, 154, 1
- Willingale et al. [2001] Willingale, R. et al. 2001, A&A 365, L212
| Nebula Flux Density | Pulsar Flux Density | |||||||
|---|---|---|---|---|---|---|---|---|
| Wavelength | Exposure | Pixel | Raw | Extinction | Raw | Extinction | ||
| Time | Scale | Corrected | Corrected | |||||
| () | (s) | (″/pix) | (Jy) | (Jy) | (mJy) | (mJy) | ||
| IRAC | 3.6 | 12 | 0.86 | 11.65 0.03 | 12.63 0.22 | 2.45 0.16 | 2.66 0.19 | |
| 4.5 | 12 | 0.86 | 13.81 0.02 | 14.35 0.26 | 2.34 0.17 | 2.42 0.18 | ||
| 5.8 | 12 | 0.86 | 16.31 0.06 | 16.77 0.13 | 2.12 0.19 | 2.18 0.19 | ||
| 8.0 | 12 | 0.86 | 17.74 0.04 | 18.33 0.13 | 1.85 0.18 | 1.91 0.19 | ||
| MIPS | 24.0 | 3 | 2.5 | 59.8 0.4 | ||||
| 70.0 | 10 | 4.0 | 157 2 | |||||
| IRS Module Name | Spectral | Spectral | Integration Time at |
|---|---|---|---|
| Range | (Resolution | IRS-Tgt-Cntr | |
| () | (/) | (sec) | |
| Short-Low (SL) | 5.2 - 14.3 | 64 - 128 | 928 |
| Long-Low (LL) | 14.1 - 38.0 | 64 - 128 | 488 |
| Short-High (SH) | 9.9 - 19.6 | 600 | 1768 |
| Long-High (LH) | 18.9 - 37.2 | 600 | 1936 |
| Line | Wavelength | Measured | Line Fit Height | Line Flux |
|---|---|---|---|---|
| () | Wavelength () | (Jy) | (W/cm2/) | |
| [NeII] | 12.8135 | 12.763 0.001 | 0.6850 0.0044 | 4.386 0.043 e-20 |
| 12.862 0.001 | 0.1252 0.0038 | 8.930 0.048 e-21 | ||
| [NeV] | 14.3217 | 14.261 0.007 | 0.0123 0.0035 | 9.325 3.311 e-22 |
| 14.404 0.008 | 0.0099 0.0035 | 7.851 4.603 e-22 | ||
| [NeIII] | 15.5551 | 15.493 0.001 | 0.9434 0.0556 | 4.692 0.039 e-20 |
| 15.621 0.001 | 0.2982 0.0038 | 1.900 0.039 e-20 | ||
| [SIII] | 18.7130 | 18.648 0.001 | 0.0475 0.0025 | 2.533 0.201 e-21 |
| 18.777 0.002 | 0.0483 0.0025 | 2.452 0.197 e-21 |
| Line | Wavelength | Measured | Line Fit Height | Line Flux | Scaled Line Fluxa |
|---|---|---|---|---|---|
| Wavelength | |||||
| () | () | (Jy) | (W/cm2/) | (W/cm2/) | |
| [FeIII] | 22.9250 | 22.801 0.021 | 0.030 0.009 | 1.28 0.6 e-21 | 4.2 1.9 e-22 |
| 23.004 0.024 | 0.028 0.007 | 1.73 0.7 e-21 | 5.7 2.2 e-22 | ||
| [NeV] | 24.3175 | 24.210 0.005 | 0.140 0.007 | 9.33 0.7 e-21 | 3.1 0.2 e-21 |
| 24.420 0.006 | 0.114 0.007 | 6.26 0.6 e-21 | 2.1 0.2 e-21 | ||
| [OIV]+ | 25.8903 | 25.772 0.006 | 1.372 0.007 | 9.13 0.07 e-20 | 3.08 0.02 e-20 |
| weak [FeII] | 25.999 0.006 | 1.342 0.007 | 8.28 0.06 e-20 | 2.73 0.02 e-20 | |
| [SIII] | 33.4810 | 33.326 0.002 | 0.376 0.025 | 2.07 0.2 e-20 | 6.8 0.7 e-21 |
| 33.547 0.001 | 0.479 0.028 | 2.40 0.2 e-20 | 7.9 0.8 e-21 | ||
| [SiII] | 34.8152 | 34.675 0.001 | 0.780 0.032 | 3.24 0.2 e-20 | 1.07 0.07 e-20 |
| 34.934 0.002 | 0.383 0.033 | 1.30 0.2 e-20 | 4.3 0.6 e-21 | ||
| [FeII] | 35.3487 | 35.194 0.007 | Same as below | ||
| 35.455 0.009 | 0.093 0.015 | 3.71 2.1 e-21 | 1.2 0.7 e-21 | ||
| [NeIII] | 36.0135 | 35.852 0.001 | 0.865 0.034 | 2.50 0.2 e-20 | 8.2 0.6 e-21 |
| 36.138 0.001 | 0.513 0.031 | 1.74 0.2 e-20 | 5.8 0.6 e-21 |