Swift and infra-red observations of the blazar 3C 454.3
during the giant X-ray flare of May 2005
We present the results of a series of Swift and quasi simultaneous ground-based infra-red observations of the blazar 3C 454.3 carried out in April-May 2005 when the source was 10 to 30 times brighter than previously observed. We found 3C 454.3 to be very bright and variable at all frequencies covered by our instrumentation. The broad-band Spectral Energy Distribution (SED) shows the usual two-bump shape (in space) with the Infra-red, optical and UV data sampling the declining part of the synchrotron emission that, even during this extremely large outburst, had its maximum in the far-infrared. The X-ray spectral data from the XRT and BAT instruments are flat and due to inverse Compton emission. The remarkable SED observed implies that at the time of the Swift pointings 3C 454.3 was one of the brightest objects in the extragalactic sky with a -ray emission similar or brighter than that of 3C 279 when observed in a high state by EGRET. Time variability in the optical-UV flux is very different from that in the X-ray data: while the first component varied by about a factor two within a single exposure, but remained approximately constant between different observations, the inverse Compton component did not vary on short time-scales but changed by more than a factor of 3 between observations separated by a few days. This different dynamical behaviour illustrates the need to collect simultaneous multi-frequency data over a wide range of time-scales to fully constrain physical parameters in blazars.
Key Words.:
radiation mechanisms: non-thermal - galaxies: active - galaxies: blazars, X-rays: galaxies: individual: 3C 454.3)1 Introduction
3C 454.3 is a well known bright (Jy), moderately high redshift () Flat Spectrum Radio Quasar (FSRQ) which shows all the typical hallmarks of the class of blazars: large intensity variations at all frequencies, high radio and optical polarization, superluminal motion and a Spectral Energy Distribution (SED) showing two broad peaks attributed to synchrotron and inverse Compton radiation. The synchrotron power peaks in the Infra-red band while Inverse Compton radiation starts at soft X-ray frequencies and peaks at MeV energies (Giommi et al. 2002; Blom et al. 1995).
Because of its brightness 3C 454.3 has been extensively observed over the years in most energy bands, from radio (e.g. Bennett 1962), through microwave (WMAP Bennett et al. 2003), optical (e.g. Sandage 1966; Raiteri et al. 1998), X-ray (e.g. Worrall et al. 1987; Tavecchio et al. 2002; Marshall et al. 2005), low energy -ray (COMPTEL, Blom et al. 1995; Zhang et al. 2005) and high energy -ray (EGRET, Hartman et al. 1993, 1999).
In May 2005 3C 454.3 was reported to undergo a very strong optical flare with a remarkable flux increase of about four magnitudes compared to previous observations (Balonek 2005a, b). During the same period the RXTE all-sky monitor recorded a flux of over 10 mCrab, implying that 3C 454.3 was extremely active also at X-ray frequencies where it had become one of the brightest extragalactic sources in the sky (Remillard 2005).
The Swift satellite (Gehrels et al. 2004) pointed 3C 454.3 on four occasions in April-May 2005, initially as part of an on-going project to study the X-ray properties of a sample of blazars and then as a Target of Opportunity (ToO) following the announcement of the optical and X-ray outburst.
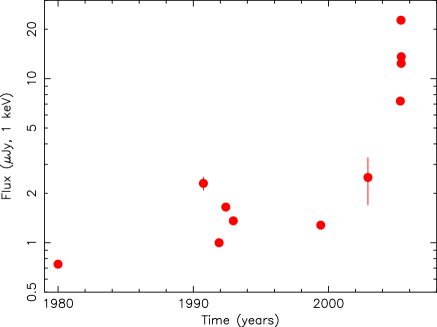
Historically, 3C 454.3 was observed on several occasions by a number of X-ray astronomy satellites, starting with the Einstein observatory in 1980 up to the recent RXTE detection and Swift detailed observations. Fig. 1 shows the long term X-ray lightcurve built using data from the Einstein, ROSAT, BeppoSAX, Chandra and Swift satellites. The unusual and very large flare of spring 2005 is readily apparent.
Because of this exceptionally high state INTEGRAL observed 3C 454.3 as a ToO in the hard-X/-ray band and detected it up to 200 keV (Foschini et al. 2005). The results of these observations are presented in Pian et al. (2006). Optical and infra-red monitoring between May and August 2005 are reported by Fuhrmann et al. (2006).
In this paper we report the results of the four Swift pointings and compare them with the results of quasi simultaneous optical and infrared observations performed with the ground-based REM telescope (Zerbi et al. 2004). We also report the hard X-ray light curve of 3C 454.3 measured by the Swift BAT instrument when the blazar was not the target of the observation but was nevertheless within its very large field of view (1.4 sr, half-coded) and was bright enough to be detected.
2 Swift observations and data analysis
Swift data have been collected using all three on-board experiments: the X-ray Telescope (XRT, Burrows et al. 2005), the UV and Optical Telescope (UVOT, Roming et al. 2005) and the Burst Alert Telescope (BAT, Barthelmy et al. 2005). These instruments, together with the observations from the ground-based REM Telescope provide a spectral coverage that ranges from the near infra-red to the hard X-rays.
2.1 XRT analysis
The XRT observations were carried out using both the Photon Counting (PC) readout mode, which provides maximum sensitivity but is affected by photon pile up for count-rates larger than cts/s, and the Windowed Timing (WT) mode which does not provide full imaging capabilities but it does not suffer from pile-up up to count-rates of cts/s (see Burrows et al. 2005; Hill 2004, for details of the XRT observing modes).
The data were reduced using the XRTDAS software (v1.4.0) developed at the ASI Science Data Center (ASDC) and distributed within the HEAsoft 6.0 package by the NASA High Energy Astrophysics Archive Research Center (HEASARC). We have selected photons with grades in the range 0-12 and used default screening parameters to produce level 2 cleaned event files.
Since the source count rate (a few counts/s) was sufficiently large to cause photon pile-up in the central pixels of the PSF, the spectral data collected in the PC mode were extracted in an annular region with inner and outer radii of 6 and 20 pixels respectively (Vaughan et al. 2005). The background was estimated in a nearby source-free circular region of 50 pixels radius.
Spectra in the data taken in WT mode were extracted in a pixel rectangular region centered on the target. The background was estimated in a nearby pixel source-free rectangular region. In order to use statistics, spectra were rebinned to include at least 20 photons in each energy channel. Due to current uncertainties in the XRT calibration at low energies photons below 0.7 keV were excluded from the analysis.
We used the XSPEC 11.3 spectral analysis package to fit the data to a simple power law spectrum. Initially, we fixed the low energy absorption () to the Galactic value estimated from the 21 cm measurements of ( cm-2 Dickey & Lockman 1990). The resulting spectra of all observations showed a systematic deviation from the best fit law in the low energy part suggesting the possibility of an additional absorption as already noticed by (Tavecchio et al. 2002) or a spectral flattening below keV. We then considered as a free parameter in the fitting and found a value systematically higher than the Galactic one by a factor of 3.5 in agreement with Tavecchio et al. (2002). The results are reported in Tab. 1 where column 1 gives the observation date, column 2 gives the power law photon index, column 3 gives the flux in the 2-10 keV band, and column 4 gives the reduced and the number of degrees of freedom.
A Chandra observation of 3C 454.3 performed on 19-21 May 2005, shortly after our XRT observations, (Villata et al. 2006) shows a similar X-ray flux level and also a low energy absorption in excess to that expected from Galactic , although lower than that observed by us.
| Date | Instrument | NH | /dof | |||
| cm-2 | erg cm-2s-1 | erg cm-2s-1 | ||||
| () | () | () | ||||
| 24 April 2005 | Swift XRT | 1.76 (0.07) | 2.3 (0.4) | 0.99/201 | ||
| 11 May 2005∗ | Swift XRT | 1.62 (0.08) | 2.3 (0.4) | 0.87/172 | ||
| 17 May 2005 | Swift XRT | 1.79 (0.10) | 2.3 (0.6) | 0.92/108 | ||
| 19 May 2005 | Swift XRT | 1.71 (0.09) | 2.4 (0.6) | 0.83/122 | ||
| 8 May 2005 | Swift BAT | 1.7 (0.2) | – | 5.91.0 | 0.68/57 | |
| 11 May 2005 | Swift BAT | – | – | 5.41.3 | ||
| 17 May 2005 | Swift BAT | – | – | 2.3 | ||
| 19 May 2005 | Swift BAT | – | – | 3.30.6 | ||
| 6 August 2005 | Swift BAT | 1.8 (0.2) | – | 1.70.3 | 1.47/57 | |
| 5 June 2000 | BeppoSAX-LECS+MECS | 1.38 (0.06) | 2.4(0.8) | 1.12/58 | ||
| ∗ Windowed timing data | ||||||
2.2 UVOT observations
The UVOT took data during all four Swift observations of 3C 454.3. The total exposure times in each of the UVOT filters is listed in Table 2.
During observations of April 24 and May 17 the UVOT obtained series of images in each of the lenticular filters (V, B, U, UVW1, UVM2, and UVW2). The UVOT was instead operated with the UV grism for the other two observations.
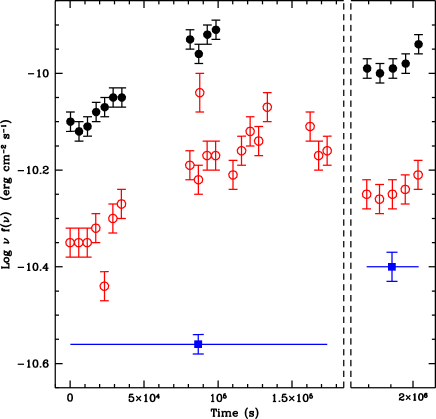
In the case of the lenticular filters, photometry was performed on the source using a standard tool (GAIA, the Starlink Graphical Astronomy and Image Analysis Tool; Draper et al. (2004)). Counts were extracted from a 6″ radius aperture (V, B and U filters) or a 10″ radius aperture (UVW1, UVM2 and UVW2 filters); a larger radius was used for the UV filters due to the wider PSF in these filters. The count rate was corrected for coincidence loss (analogous to pile-up), and the background subtraction was performed using a background count rate obtained from a 20″ radius region offset from the source. The count rates were then de-reddened using a value for of 0.107 mag (Schlegel et al. 1998) with the ratios given in Table 3, and converted to fluxes using the count rate to flux conversion factors also listed in Table 3. The resulting flux points for the V and UVW2 filters are plotted as a lightcurve in Fig. 2 where we see that variability of up to a factor of 2 is present in the first observation (April 24).
| Date | Exp. | Exp | Exp | Exp | Exp | Exp | Exp |
|---|---|---|---|---|---|---|---|
| V | B | U | UVW1 | UVM2 | UVW2 | Grism | |
| 24 Apr | 947 | 675 | 948 | 1892 | 2843 | 3926 | 0 |
| 11 May | 0 | 0 | 0 | 0 | 0 | 0 | 1941 |
| 17 May | 400 | 306 | 400 | 791 | 1197 | 1598 | |
| 19 May | 0 | 0 | 0 | 0 | 0 | 0 | 4964 |
| Filter | |||
|---|---|---|---|
| 5460 | 3.2 | (2.2 0.1) | |
| 4350 | 4.2 | (1.3 0.1) | |
| 3450 | 5.2 | (1.5 0.06) | |
| 2600 | 6.7 | (3.5 0.07) | |
| 2200 | 9.7 | (7 1) | |
| 1930 | 8.3 | (6.0 0.4) |
-
a
Effective wavelength of the filter in Å.
- b
-
c
Conversion factor from rate (Counts s-1) to flux (Erg cm-2s-1Å-1) from UVOT in-orbit calibration as of 30 June 2005 (T.S. Poole, priv. comm.).
2.3 BAT data
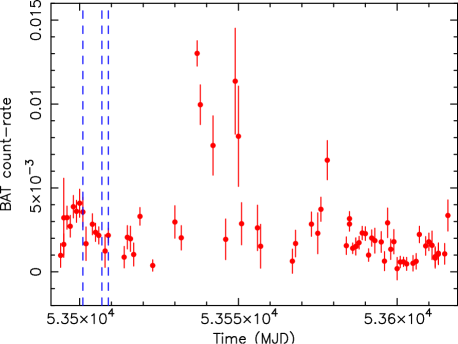
Thanks to its very large field of view (1.4 sr, half-coded), the BAT instrument was able to monitor 3C 454.3 even when it was not the target of the Swift observation. The source was in the BAT field of view on most days starting in early April 2005 and continuing beyond the XRT and UVOT observations (see BAT light curve shown in Fig. 3). The source showed considerable variation, with significant detections in at least twenty observations including two of the pointed observations (May 11 and May 19). The BAT lightcurve was accumulated for all observations in which 3C 454.3 was close enough to the field centre that it illuminated at least 10% of the BAT detectors. This corresponds to 38 degrees from the centre in the short direction and 55 degrees in the long direction of the roughly rectangular BAT field of view. The count rate for each orbit was determined from the sky images by subtracting an annular background and fitting the BAT point spread function (PSF). The orbital count rates were combined to produce daily averages. For each day on which the signal to noise ratio was at least 4.0, spectra were produced in the following analysis chain using the Swift-BAT software. The BAT survey detector plane histograms (80 energy channels, accumulated over a single spacecraft pointing) were first rebinned in energy to correct a small residual inaccuracy arising from the way the histograms are created on-board the instrument. Secondly, noisy detectors with a count rate more than twice the mean rate were removed from the analysis data set. Thirdly, the background and other bright sources (such as Cygnus X-1) in the field of view were removed by ”cleaning” in which a geometric model of the background plus extraneous sources (coded by the BAT mask) are fit to the detector array and then subtracted. Then all detectors lying on the projection of bright sources through the edge of the coded aperture were removed from the analysis data set. This step is necessary because the geometry and absorption of gaps in the coded aperture and graded-Z shield near the edges are not well known and hence cannot be well-modeled in the response function. Finally counts spectra are created using BATBINEVT by convolving the detector plane histograms with a weight map giving the fraction of each BAT detector exposed to the source through the empty cells in the BAT coded aperture. The spectra for individual pointings in an observation were combined using the MATHPHA tool. The response function was generated for each observation using the Swift BATDRMGEN routine. It correctly accounts for disabled and ignored detectors and geometric effects when 3C 454.3 is not in the centre of the BAT field of view. The spectra were then fit to a simple power law model using the XSPEC 11.3 analysis package. Only during two observations (8 May and 6 August 2005) the data were good enough to allow us to estimate the power law spectral index with a statistical error less than 0.25. On these occasions the best fit spectral indices were and , the fluxes in the 15-150 keV were erg cm-2s-1 and erg cm-2s-1 , respectively (see also Tab.1), in good agreement with the extrapolations of XRT spectra. For completeness we also report in Tab.1 BAT fluxes simultaneous with XRT observations even when no spectral fitting was possible. In these cases fluxes were calculated converting the BAT count-rate into 15-150 keV flux assuming a spectral index of 1.7 as measured during the observation of 8 May 2005.
3 A reanalysis of the BeppoSAX observation
3C 454.3 was observed by BeppoSAX in June 2000 when the source was about 20 times fainter than during the Swift observation of May 11. Despite the relatively low flux the LECS, MECS and PDS instruments provided a good quality X-ray spectrum between 0.1 to over 100 keV (see Boella et al. 1997, for a description of the instrumentation). These broad-band X-ray data (first reported by Tavecchio et al. (2002) and subsequently by Giommi et al. (2002)) are useful to compare the SED of this source in different brightness states.
| Date | Start UT | Filter | magnitude |
|---|---|---|---|
| 11 May | 21:41 | 12.73 (0.04) | |
| 11 May | 21:45 | 12.04 (0.07) | |
| 11 May | 21:50 | 13.28 (0.08) | |
| 17 May | 21:43 | 9.74 (0.04) | |
| 18 May | 09:41 | 12.56 (0.05) | |
| 18 May | 09:46 | 11.84 (0.05) | |
| 18 May | 09:51 | 13.08 (0.07) | |
| 19 May | 09:12 | 12.22 (0.07) | |
| 19 May | 09:17 | 11.58 (0.07) | |
| 19 May | 09:22 | 12.72 (0.07) | |
| 19 May | 21:12 | 9.94 (0.03) |
We present here a re-analysis of the BeppoSAX data considering a single power law model with free low energy absorption. We considered LECS, MECS and PDS data. Events for spectral analysis were selected in circular regions of 4 and 3 arcminutes and in the energy bands 0.5–2.0 keV and 2.0–10.0 keV for the LECS and MECS, respectively. PDS data in the 15-100 keV range were used. Background spectra were taken from the blank field archive at the ASI Science Data Center.
In lowest line of Table 1 we reported the best fit parameters of the BeppoSAX observation. As can be seen, the model describes well the 0.5-100 keV spectrum and the best fit column density is significantly higher than the Galactic value, confirming the early report by Tavecchio et al. (2002) and in good agreement with the XRT observations of 2005 (See tab 1).
4 REM observations
The Rapid Eye Mount (REM, Zerbi et al. 2004) is a robotic telescope located at the ESO Cerro La Silla observatory (Chile). The REM telescope has a Ritchey-Chretien configuration with a 60 cm f/2.2 primary and an overall f/8 focal ratio in a fast moving alt-azimuth mount providing two stable Nasmyth focal stations. At one of the two foci the telescope simultaneously feeds, by means of a dichroic, two cameras: REMIR for the NIR (see Conconi et al. 2004), and ROSS (see Tosti et al. 2004) for the optical. Both cameras have a 10 x 10 arcmin field of view and imaging capabilities with the usual NIR (, , and ) and Johnson-Cousins filters. Moreover, low resolution slit-less spectroscopy is also possible via an Amici prism.
All raw optical/NIR frames obtained by REM were corrected for dark, bias and flat field. Instrumental magnitudes were obtained via aperture photometry using DAOPHOT (Stetson 1988) and Sextractor (Bertin & Arnouts 1996). Calibration of the optical source magnitude was obtained by differential photometry with respect to the comparison stars sequence reported by Fiorucci et al. (1998) and Raiteri et al. (1998). For the NIR calibration we used the comparison sequence reported by Gonzalez-Perez et al. (2001).
The observed fluxes in different filters are reported in Tab. 4 where columns 1 and 2 give the data and time of the observation, column 3 gives the filter and column 5 gives the magnitude with error in parenthesis.
5 Discussion and conclusion
We have reported the results of several Swift and REM observations of the blazar 3C 454.3 taken in April-May 2005 when the source undewent an extremely large optical and X-ray outburst.
The source was found to be much brighter than in the past over the entire energy range covered by our instrumentation, from the near infra-red to the hard X-rays.
The maximum observed X-ray flux was a factor 10 larger than that measured during the ROSAT All Sky Survey and a factor 30 higher than during an early Einstein observation. Comparison with the 2002 Chandra observation is somewhat uncertain due to pile-up problems in the ACIS instrument (Marshall et al. 2005).
The time variability behaviour of the IR-optical-UV flux (thought to be due to synchrotron emission) and of the X-ray flux (attributed to the inverse Compton component) were quite different. While the X-ray flux was stable within single exposures, but varied by over a factor 3 between different Swift observations, the optical/UV flux varied by nearly a factor 2 during the observation of April 24 (see Fig. 2) but the average flux varied much less than the X-ray flux between different observations.
The X-ray spectral slope was found to be flat during all four Swift observations with some indication of spectral flattening with increasing intensity. Best fits to simple power law models give photon spectral indices of , strongly indicating that the inverse Compton component was responsible for the X-ray emission also in this very bright state (see Table 1). Similar results have been obtained with INTEGRAL observations perfomed on 15-18 May 2005 (Pian et al. 2006).
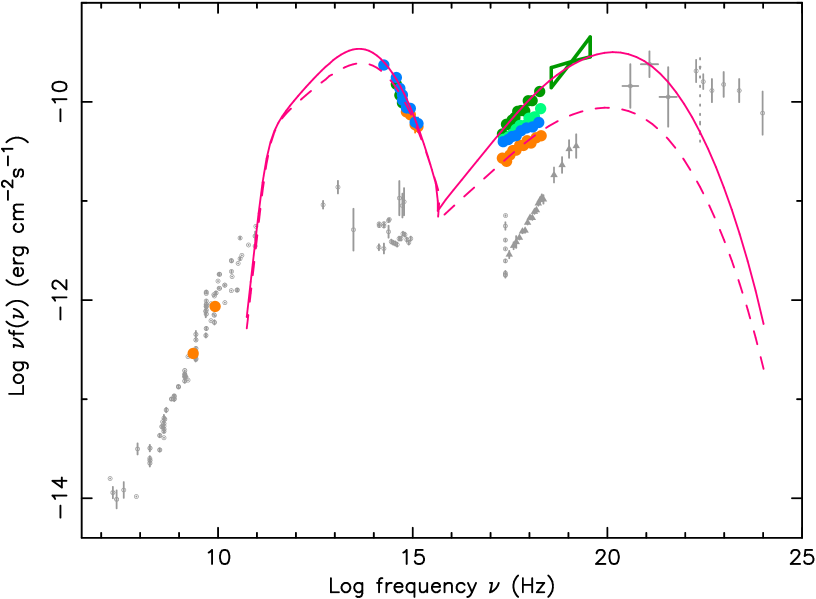
We have combined our XRT, UVOT and REM measurements with non-simultaneous multifrequency data taken form NED and the ASI Science Data Center to build the SED shown in Fig. 4. From this figure we see that the infra-red, optical and UV data points form a steep spectrum implying that the peak of the synchrotron component is located at lower energies than the near infrared even during the flare (see also Fuhrmann et al. 2006). 3C 454.3 was detected by COMPTEL and EGRET in the -ray band a few years ago when the source was much fainter in the optical band than during our observations (e.g. Raiteri et al. 1998).
The general shape of the SED clearly follows the usual two-bump synchrotron/inverse Compton scenario. We computed the expected SED from one-zone synchrotron self-Compton models from a power law distribution of relativistic electrons with energy up to followed by a log-parabolic distribution up to a Lorentz factor of (Massaro et al. 2006). We obtained reasonably good representations of the data for both the high and low intensity states (see Fig. 4) assuming magnetic field values of and Gauss, beaming factor , electrons power law slopes and and curvature parameter and (see Massaro et al. 2006, for details). However, the widely different behaviour of the apparently constant optical component and the variable X-ray flux undoubtly indicate the presence of widely different dynamical time-scales in different energy bands. Moreover, the optical light-curve reported by Villata et al. (2006) showing large variability, both on relatively long (several weeks) and short timescales (see also Fig. 2), implies an even more complex scenario. A complete understanding of the physical processes powering flares such as that observed on May 2005 require the measurement of the dynamical time-scales at different frequencies. Detailed modelling of the data presented here is beyond the scope of the present work.
Despite 3C 454.3 was about 20 times brighter than when observed with BeppoSAX the X-ray spectral shape was significantly harder when the source was fainter. This finding contrasts with what is usually seen during flares in blazars and suggests that it could be due the occurrence of a softer IC component. In fact, as apparent from Fig. 4 we cannot exclude that the peak of the SED, which can be estimated around 10 MeV in the faint state moved down to 1 MeV during the 2005 flare. Unfortunately, the lack of -ray data makes it impossible to reach a firm conclusion on this point that is crucial to model the physical conditions of 3C 454.3.
On the other hand, if the -ray flux scaled with the optical flux 3C 454.3 might have been the brightest AGN in the May 2005 -ray sky with a flux in excess of ph-2s-1 (E 100 MeV), probably brighter than 3C 279 when observed by EGRET in a high state. Differently, a spectral distribution of the flaring component with a more pronounced curvature would imply a -ray flux of the same order or even lower than that observed by EGRET. Blazars undergoing large outbursts like the one described in this paper are obvious targets for the upcoming -ray observatories AGILE and GLAST. Observations with these satellites, combined with well planned multi-frequency monitoring campaigns, will provide great new opportunities to significantly improve our understanding of the physical processes powering blazars.
Acknowledgements.
The authors acknowledge financial support from the Italian Space Agency (ASI) through grant I/R/039/04 and through funding of the ASDC. The UCL-MSSL authors acknowledge support of PPARC. This work is partly based and on data taken from the NASA/IPAC Extragalactic Database (NED) and from the ASI Science Data Center (ASDC). We thank the anonymous referee for useful suggestions.References
- Balonek (2005a) Balonek, T. 2005a, vsnet -alert 8383
- Balonek (2005b) Balonek, T. 2005b, vsnet -alert 8405
- Barthelmy et al. (2005) Barthelmy, S., Barbier, L. M., Cummings, J., et al. 2005, SSRv., 120, 95
- Bennett (1962) Bennett, A. S. 1962, MNRAS, 68, 163
- Bennett et al. (2003) Bennett, C. L., Hill, R. S., Hinshaw, G., et al. 2003, ApJS, 148, 97
- Bertin & Arnouts (1996) Bertin, E. & Arnouts, S. 1996, A&AS, 117, 393
- Blom et al. (1995) Blom, J., Bloemen, H., Bennett, K., et al. 1995, A&A, 295, 330
- Boella et al. (1997) Boella, G., Butler, R. C., Perola, G. C., et al. 1997, A&AS, 122, 229
- Burrows et al. (2005) Burrows, D., Hill, J. E., Nousek, J. A., et al. 2005, SSRv., 120, 165
- Conconi et al. (2004) Conconi, P., Cunniffe, R., D’Alessio, G., & et al. 2004, SPIE, 5492, 1602
- Dickey & Lockman (1990) Dickey, J. & Lockman, F. 1990, ARA&A, 28, 215
- Draper et al. (2004) Draper, P. W., Gray, N., & Berry, D. S. 2004, starlink User Note 214.15
- Fiorucci et al. (1998) Fiorucci, M., Tosti, G., & Rizzi, N. 1998, PASP, 110, 105
- Foschini et al. (2005) Foschini, L., Di Cocco, G., Malaguti, G., et al. 2005, aTel, 497
- Fuhrmann et al. (2006) Fuhrmann, L., Cucchiara, A., Marchili, N., Tosti, G., & et. al. 2006, A&A, 445, L1
- Gehrels et al. (2004) Gehrels, N., Chincarini, G., Giommi, P., et al. 2004, ApJ, 611, 1005
- Giommi et al. (2002) Giommi, P., Capalbi, M., Fiocchi, M., et al. 2002, in Blazar Astrophysics with BeppoSAX and Other Observatories, ed. P. Giommi, E. Massaro, & G. Palumbo, 63
- Gonzalez-Perez et al. (2001) Gonzalez-Perez, J. N., Kidger, M., Martin-Luis, F., & et al. 2001, AJ, 122, 2055
- Hartman et al. (1999) Hartman, R. C., Bertsch, D. L., Bloom, S. D., et al. 1999, APJS, 123, 79
- Hartman et al. (1993) Hartman, R. C., Bertsch, D. L., Dingus, B. L., et al. 1993, ApJ, 407, L41
- Hill (2004) Hill, J.E., e. a. 2004, SPIE, 5165, 217
- Marshall et al. (2005) Marshall, H. L., Schwartz, D. A., Lovell, J. E. J., et al. 2005, ApJS, 156, 13
- Massaro et al. (2006) Massaro, E., Tramacere, A., Perri, M., Giommi, P., & Tosti, G. 2006, A&A, 448, 861
- Pian et al. (2006) Pian, E., Foschini, A., Beckmann, V., et al. 2006, A&A, 449, L21
- Raiteri et al. (1998) Raiteri, C. M., Ghisellini, G., Villata, M., et al. 1998, A&AS, 127, 445
- Remillard (2005) Remillard, R. 2005, aTel, 484
- Roming et al. (2005) Roming, P. W. A., Kennedy, T. E., Mason, K. O., et al. 2005, SSRv, 120, 143
- Sandage (1966) Sandage, A. 1966, ApJ, 144, 1234
- Schlegel et al. (1998) Schlegel, D. J., Finkbeiner, D. P., & Davis, M. 1998, ApJ, 500, 525
- Seaton (1979) Seaton, M. J. 1979, MNRAS, 187, 73
- Stetson (1988) Stetson, P. 1988, PASP, 99, 191
- Tavecchio et al. (2002) Tavecchio, F., Maraschi, L., Ghisellini, G., et al. 2002, ApJ, 575, 137
- Tosti et al. (2004) Tosti, G., Bagaglia, M., Campeggi, C., & et al. 2004, SPIE, 5492, 689
- Vaughan et al. (2005) Vaughan, S., Goad, M. R., Beardmore, A. P., et al. 2005, submitted to ApJ
- Villata et al. (2006) Villata, M., Raiteri, C., Balonek, T., & the WEBT collaboration. 2006, A&A, in press, astro-ph/0603386
- Worrall et al. (1987) Worrall, D. M., Tananbaum, H., Giommi, P., & Zamorani, G. 1987, ApJ, 313, 596
- Zerbi et al. (2004) Zerbi, F., Chincarini, G., Ghisellini, G., & et al. 2004, SPIE, 5492, 1590
- Zhang et al. (2005) Zhang, S., Collmar, W., & Schon̈felder. 2005, A&A, 444, 767
- Zombeck (1990) Zombeck, M. V. 1990, Handbook of Astronomy and Astrophysics (Cambridge, UK: Second edition, Cambridge University Press)