Simulation studies of CZT Detectors as Gamma-Ray Calorimeter
Abstract
Several astrophysics and nuclear physics applications require the detection of photons in the energy range of keV up to several MeV with good position and energy resolution. For certain applications Cadmium Zinc Telluride (CZT) detectors might be the detector option of choice. Up to now, CZT detectors have mainly been used in the energy range between a few keV and 1 MeV. They operate at room temperature and achieve excellent position resolution and substantially better energy resolution than scintillation detectors. Furthermore, they can be built more compact and more economically than Ge detectors and do not require cryogenic cooling.
In this paper, we describe the results of 3-D Monte Carlo simulations of a “CZT calorimeter” that can be used to detect photons in the keV to several MeV range. The main objective of these studies is to evaluate the feasibility of CZT calorimeters, to study their performance and detect and understand performance limiting factors. Such a calorimeter consists of many layers of closely packed pixellated CZT detector units.
Our simulations of single detector units reproduce experimental results, indicating that our simulations capture the main factors that limit the performance of a detector unit.
For a full calorimeter the limiting factors within a range from 20 keV to 10 MeV are: a) the fact, that the incident energy is not totally deposited
within the detector area because secondary particles leave the detector against the direction
from which the incident radiation enters, b) signal loss when the interaction is near the pixel edges and near the anodes. In this case signals which are
induced in neighboring pixels are discarded when their intensities lie below the trigger threshold. c)
the steep weighting potential gradient close
to the anodes, which affects about 0.25 cm next to the anode and impairs there
the correction of the depth of interaction (DOI). This effect dominates in thin detectors (0.5 cm).
Understanding the limiting factors we come to the conclusion that 1 cm to 1.5 cm thick detector units can be used to build a calorimeter with good performance over the energy range from 20 keV to 10 MeV .
keywords:
CdZnTe, CZT detectors, astronomy, nuclear physics, MeV -ray astronomyPACS:
95.55.Ka1 Introduction
Cadmium Zinc Telluride (CZT) has emerged as the detector material of choice for the detection of hard X-rays and soft -rays when excellent position and energy resolution is needed and cryogenic cooling is impractical. Most commonly, CZT detectors are employed to detect photons in the 10 keV to 1 MeV energy range where its high density ( 5.76 g/cm3) and high average atomic number (50) result in high stopping power and a large cross section for photoelectric interactions. Several astrophysical, nuclear physics, and homeland security applications require the detection of photons with energies of several MeV with good position and energy resolution and with a detection efficiency close to 100%. A detector built from closely packed CZT detectors units may perform substantially better than a scintillation detector and may be more compact and more economic than a cryogenically cooled Ge detector. So far CZT detectors have mainly been studied in the photoelectric regime (10 keV-300 keV). Two different designs have been widely used, pixellated detectors and single sided strip detectors [1, 2, 3, 4]. Excellent energy resolutions have been achieved with both designs. For a pixellated detector with 11 11 pixels and a steering grid Zhang et al. [1] reported 0.8% (full width half maximum, FWHM) at 662 keV for single pixel events and 2.3% at 662 keV (FWHM) for three pixel events. The detector size was 1.5 1.5 1 cm3. For a single sided charge-sharing CZT strip detectors FWHM energy resolutions of 19.5 keV at 662 keV and 23.7 keV ar 1333 keV were reported [4].
Whereas detectors with N N pixels require N2 readout channels CZT cross-strip detectors require 2 N channels. The penalty for this advantage are ambiguities in matching strips with the right cross-strip counterparts in case of multiple interactions in one detector. In order to achieve good detector efficiency, energy resolution and imaging properties in the “Compton” regime of several hundred keV requires to take multiple pixel or multiple strip events into account. Strategies exist to ameliorate this problem somewhat, for further details [4]. This paper deals with pixellated CZT detectors only. We use the Geant 4.0 code [5] to study the performance of very thick detectors ( 10 cm) built from closely packed CZT detector units with the objective of evaluating the theoretically achievable performance of such CZT calorimeters given the electronic properties of present-day CZT substrates. As we will describe further below, the main thrust of our study is to evaluate general performance limitations arising from the combination of the location and spatial extent of the charge clouds below individual detector pixels, trapping of electrons and holes and the influence of the weighting potential. We neglect the performance limitations arising from Te-precipitates and other crystal defects. The good agreement of the simulated detector response and the one experimentally measured shows that electron and hole trapping and the detectors weighting potential indeed limits the performance of current CZT detectors. Te-precipitates and other crystal defects seem to be only important for underperforming detector areas.
The calorimeter performance depends on the shape of the 3-D weighting potential and on the number, energy and distribution of secondary particles produced in the calorimeter. Simulations with a particle interaction code like Geant 4 and a device simulation code is the most efficient and most accurate way to estimate the performance of such calorimeters.
This paper is structured as follows. In Section 2, we give a brief description of astrophysics and nuclear physics experiments that may use CZT calorimeters. Subsequently, in Section 3 we describe the simulations and present their results for single detector units and for full CZT calorimeters. In Sect. 4 the results are discussed.
In the following all energy resolutions are given as Full-Width-Half-Maximum energy resolutions.
2 Applications in Astrophysics and Nuclear Physics
2.1 Astrophysics
From several hundred keV to 10 MeV the dominant interaction process of
photons in matter is Compton scattering. At lower energies the
photo effect dominates and at higher energies pair production. The sensitivity of past, present and upcoming
hard X-ray-
and telescopes shows a gap in the “Compton” energy range
from a few 100 keV up to several tens of MeV.
This energy range is highly interesting from the astrophysical point of view.
Some of the scientific objectives are: the study of nucleosynthesis in
core-collapse, type Ia supernovae and classical novae,
the search for “intermediate“ blazars with peak emission of
about 1 MeV and ray lines from nuclear interactions of
cosmic rays with the interstellar medium [6], and the
study of the 511 keV emission from sources like the galactic center
[7].
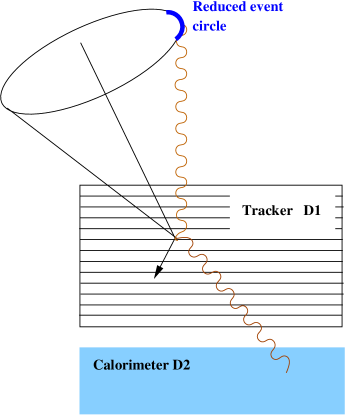
Figure 1 shows the basic detector principle used in both the TIGRE (tracking and imaging ray instrument) [8] and the MEGA (medium energy ray astronomy) designs [6]. The design uses two detectors: first, a tracker (D1) where Compton scattering and pair conversion takes place and where the trajectories, energies, and momenta of secondary electrons are measured; second, a calorimeter (D2) to determine the location and energy of scattered photons (see Figure 1). The Compton equation can be used to calculate the energy and incident direction of the primary photon from the combined information from the D1 and D2 detectors. Depending on the knowledge of the momentum and energy of the scattered electron, the direction of the incident photon is given either as an arc or a circle. Usually a low-Z material is used for the D1 detector to maximize the probability of a single Compton scattering. For D2 a high-Z material is the preferred choice to maximize the probability for photon absorption in photo effect events.
In the specific case of MEGA, the tracker
consists of 32 layers of double-sided silicon strip detectors
(6 6 cm2 each, 500 m thick, with
a pitch of 470 m). The calorimeter consists of CsI slabs,
5 5 cm2 cross section, 4-8 cm deep.
Each slab is read out by a Si PIN diode.
Over the energy range from 511 keV to 1.274 MeV,
the CsI calorimeter
achieves an energy resolution of about 8% FWHM and
a spatial resolution of 2 cm [9, 10].
Ge calorimeters could in principle be used to improve the performance of Compton telescopes like TIGRE and MEGA, however, the costs of constructing
such a calorimeter and the cryogenic cooling
system, and lifting it into an orbit are very high.
CZT with excellent spatial resolution and good energy resolution
might be a better choice for D2 to improve on
the performance of Compton telescopes.
2.2 Nuclear Physics
Another application for CZT calorimeters lies in the detection of MeV photons in nuclear physics experiments that use “fast beams” ( 0.2). Presently, Ge detectors are used to measure the energy and location of rays emitted by excited nuclei. However, Ge detectors are expensive and require cryogenic cooling that makes them bulky, and complicates the use with auxiliary detectors or spectrometers. In the case of “fast beams”, the effective energy resolution of the experiment (the accuracy of the energy reconstruction in the rest frame of the emitting particle) is mainly limited by the spatial resolution with which the ray can be localized, owing to the Doppler effect.
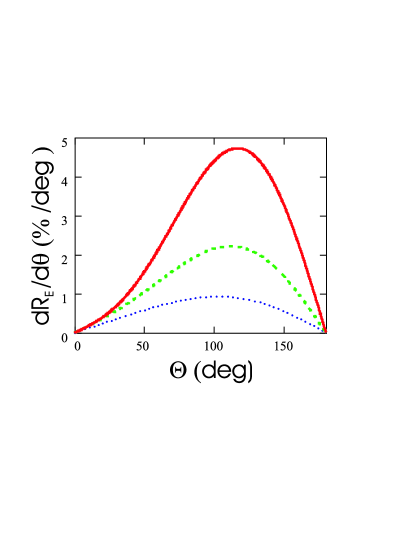
Figure 2 shows the differential energy change
as a function of
the angle between emitter and photon momenta for = 0.25, 0.50
and 0.75, dotted, dashed and solid line, respectively. For an angle
of 50∘ the differential energy change is 0.5%/degree,
1%/degree and 1.4%/degree for
= 0.25, 0.50 and 0.75, respectively.
Thus, in fast beam experiments the effective energy resolution of the experiment
is limited by the spatial resolution of the
detectors.
The Ge detector GRETA (Gamma-Ray Energy Tracking Array)
is the next generation ray detector for
nuclear structure research.
GRETA will use a two-dimensionally segmented Ge detector along with
pulse-shape analysis
to determine the three-dimensional position and the energy of
the interaction. The prototype GRETINA of GRETA
[11, 12]
consists of a cluster of three tapered HP-Ge n-type crystals
with a hexagonal
shape. The crystal length
is 9 cm, the diameter at the back is 8 cm.
The outer electrode is divided into 36 parts,
6 longitudinal and 6 transverse segments.
GRETINA achieves laboratory frame energy resolutions of 1.15 keV at 60 keV and 2.35 keV at 1.3332 MeV. The position resolution
is 2 mm RMS in three dimensions111://.
For a CZT detector,
the theoretical limit of the
position resolution is the distance electrons produced
in photo effects or Compton events travel before transferring their energy
to the valence band electrons.
At 1 MeV 80% of the electrons stay within 0.18 mm from the point where they are generated.
For real pixellated detectors the position
resolution is limited further by pixel size, timing and possibly
cathode signal resolution. Zhang et. al [1] reported position resolution
of 1.27 1.27 0.2 mm for a 1.5 1.5 1.0 cm3 CZT detector with 11 11 pixels. Despite the clearly better energy resolution of a Ge calorimeter low cost small volume CZT calorimeters can therefore achieve comparable overall effective energy resolution in fast beam experiments.
3 Simulation Study of a CZT Calorimeter
In the recent years the performance of pixellated CZT detectors has been dramatically improved. Energy resolution at 662 keV of 0.8% for single pixel readout and 2.3% for combined signals of three anode pixels were reported for a CZT detector of dimension 1.5 1.5 1.0 cm3 with 11 11 pixels [1]. For the detection of higher energies it is necessary to combine the signals of several pixels because the dominant interaction process, the Compton effect, tends to spread the interaction over adjoining pixels. Even at lower energies integrating over all pixel signals has a large impact on detector efficiency, because the incidents of Compton events is not negligible.
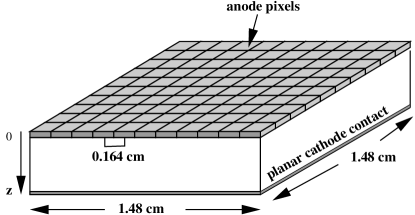
To gain a better understanding of the behavior of pixellated CZT calorimeters, detailed three dimensional simulations of a large volume calorimeter have been performed. Our main objective is to derive theoretical limits for currently used CZT detectors and electronics. Therefore we have chosen to use a CZT calorimeter constructed out of 1.48 1.48 cm2 single pixellated CZT detector units with 9 9 pixels and a pitch of 0.164 cm. Reported pixel pitches vary between 0.11 cm and 0.25 cm. The pixels are held at ground and the cathode bias is -1500 V per 0.5 cm. The thickness of the detector units was varied: 0.5 cm, 1.0 cm and 1.5 cm. All these sizes are commercially available. The overall size of the calorimeter considered in the following was chosen to be 10.33 10.33 45 cm3. This choice ensures that almost all interactions take place inside the detector volume. The results are not limited to this particular design but apply to to all calorimeters as long as they are large enough to fully stop incoming rays.
The output of our simulations are electron drift times and signals on all pixels. By “signal” we understand the integrated charge over 1 s. If not stated otherwise, we assume electronic noise of 4.5 keV and a pixel trigger threshold of 13.5 keV. These values are typical for state-of-the-art readout systems [1]. We did not simulate passive material (printed circuit boards, ASICs) between the CZT detector units.
The simulations can be separated in three parts. First the three dimensional electric field and the weighting potential are calculated with a finit-difference method. The electric field is calculated at the nodes of a 3-dimensional grid with the grid size s. If the coordinates of the nodes are given by (is, js, k s), the Laplace equation for each node with unknown potential can be approximated by the central point finite difference scheme:
| (1) | |||||
After specifying the “boundary conditions”, by setting the potential of the contact nodes to the applied bias potential, one gets a system of linear equations of the form
| (2) |
where the index l runs over the remaining N nodes where the potential
has yet to be determined.
We use the
steepest descent method, to solve this system of linear equations numerically.
This iterative method minimizes the difference
until it becomes smaller than a certain preset value.
To determine the weighting potential of pixel i, the potential of the contact
node of i is set to 1, for the rest to 0.
Second, for the interaction of incident rays and secondary particles
with the detector material the low-energy extension of
the Geant 4.0 code [5] is used. For each interaction the electrons
and holes are
tracked in 1 ns steps through the detector. For each step, the
induced charge at the anodes is calculated. The rise time of each pixel
and the charge accumulated in 1 s are the resulting signal values.
The electron mobility is set to
cm2/V/s with a lifetime of s and the
hole mobility to cm2/V/s with a lifetime of
s [13].
The simulations neglect any effect of material non uniformity.
3.1 Results for a single detector unit
For the understanding of a complex system it is often useful to study first a small part instead of the full system. Thus we begin with the discussion of a single CZT detector unit.
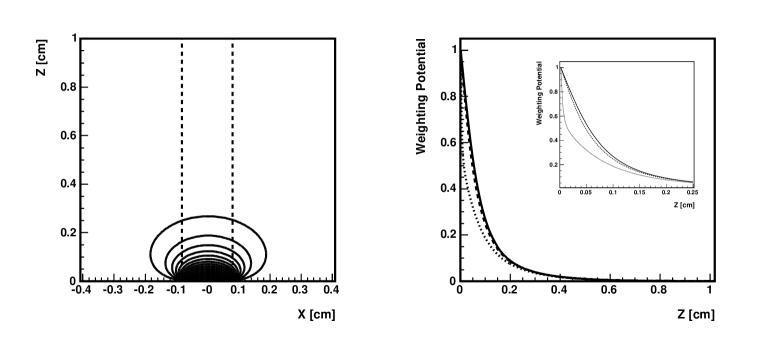
Figure 4 left panel shows the potential distribution of the central pixel for a 1 cm thick detector. The weighting potential distribution for three different lateral positions as a function of z (equal depth of interaction (DOI) ) is given in Figure 4 right panel. One can see, that most of the signals are induced near the anode contacts (so called small pixel effect) [14, 15], and the anode signal depends only weakly on the depth of interaction (DOI), if the interaction takes place less than 0.6 cm away from the cathode. The residual DOI dependence is caused by small changes of the weighting potential far away from the pixels and by electrons getting trapped as they drift to the anode. Near the anode the weighting potential rises steeply. This causes a strong dependence of the induced charge in this region. Interactions closer to the anode induce less charge than interactions closer to the cathode. It can be also seen, that the dependence in x-y direction increases near the anodes too. The cathode behaves differently since it does not exhibit the small pixel effect.
CZT is a single charge carrier, therefore it is necessary to correct for the DOI. For single-pixel events, one can derive the depth of interaction by using the cathode-to-anode signal ratio. This approach does not work for multi-pixel events. In this case, the signal rise time (proportional to the electron drift time) can be used [1]. This is the approach we used in our simulations.
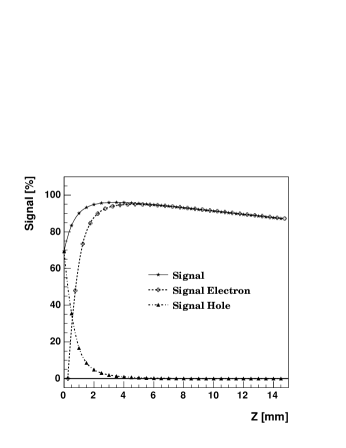
Figure 5, shows the anode signal as the percentage of the energy of the incident gamma as a function of DOI. The behavior can easily be understood based on the charge transport properties of CZT and the weighting potential (Figure 4). The gradient of the weighting potential is very steep close to the anodes and flattens with increasing z. For interactions close to the anodes, electrons drift only small distances before they impinge on the anodes. Holes contribute up to 70% of the total signal by moving through the steep gradient of the weighting potential. For interactions closer to the cathode side, electrons induce charge as they move towards the pixels. Holes induce relatively little charge, as they are trapped within s (0.12 cm) of being generated, and move towards the cathode through a region of rather constant weighting potential.
The relative signal contribution of electrons and holes depends on the charge integration window. If the integration time is shorter the holes travel less distance and thus their contribution is smaller.
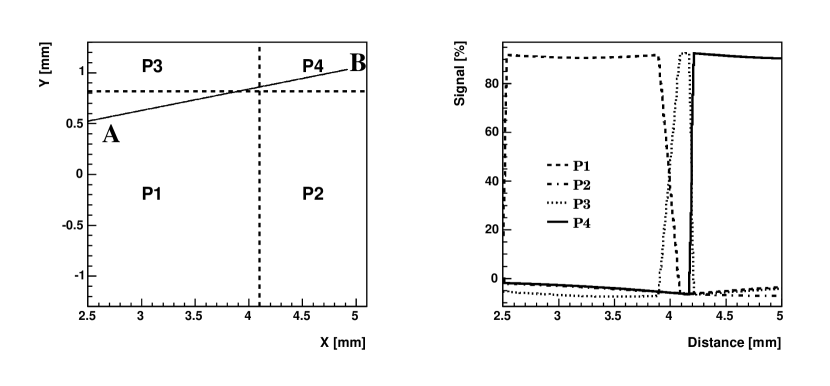
The weighting potential is not confined to the volume of the primary affected pixel. (see Figure 4) Therefore neighboring pixels measure signals, when an interaction takes place. The amount of induced charge depends on the point of interaction. The closer it occurs to the pixel edges and to the anodes the larger is the signal in the neighboring pixel. To explore this effect in more detail, Figure 6, right panel, presents the signals induced in four adjacent pixels as a function of the point of interaction which is indicated as a line on the left panel. One can nicely see how the signal is spread over adjacent pixels when charge is deposited close to the pixel boundaries.
Current experiments with pixellated CZT detector report energy resolution of 0.8% for single pixel [1] and 2.3% for the combined signals of three pixels at 662 keV. The detector size was 1.5 1.5 1 cm3 with 11 11 pixels and a steering grid. The electronic noise was in the range of 4.5 keV. For comparison we have simulated the energy resolution of a single detector unit, 1 cm thick, both for single-pixel events and for combining all anode signals. DOI correction is applied. The spectra obtained are given for 662 keV in Figure 7.
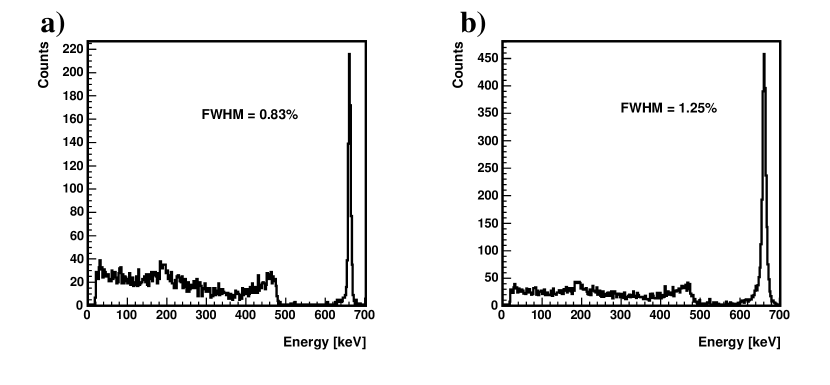
The energy resolution of single-pixel events
is 0.83% while for all events including multiple-pixel events,
it is 1.25%.
For single-pixel events the peak to Compton ratio is about 20
and for the full detector 25. These results are in good agreement
with the data reported by Zhang et al.
This comparison shows us, that the detector performance is
determined by CZT general properties and detector design and not by the incidental quality of the CZT material of a specific detector.
Currently commercially available detectors are 0.5 cm, 1.0 cm or 1.5 cm thick. The results of our simulations for 662 keV incident energy are given in Table 1.
| thickness cm | FWHM % | FWHM % |
| single-pixel events | multi-pixel events | |
| 0.5 | 1.12 | 1.34 |
| 1.0 | 0.83 | 1.25 |
| 1.5 | 0.80 | 1.25 |
For 0.5 cm and 1.5 cm thick detectors we obtained single-pixel energy resolutions of 1.12% and 0.80%, respectively and multiple pixel energy resolutions of 1.34% and 1.25%. While 1.0 cm and 1.5 cm thick CZT detector units show almost identical behavior, the energy resolution of a 0.5 cm thick detector drops to 1.12%.
In the following we will discuss how
the energy resolution depends on a number of different effects.
We begin with an effect which results from the application of
a trigger threshold.
When all DOI-corrected signals of all triggered pixels
are summed up to calculate the total energy deposition,
signals below the trigger threshold will be discarded,
diminishing the summed signal. This threshold effect becomes more
prominent the closer the energy is deposited to the anode.
Therefore, the energy resolution depends on the DOI and thus on the
z-coordinate.
Furthermore, there exists a strong xy-dependence too, caused by the steep x- and y-components of the weighting potential gradient
near the anode pixels.
To study these two effects, we simulated charge deposition at specified z
positions and random (x,y)-positions under one pixel. After applying the
DOI correction we added all signals
which exceed the trigger threshold (three times electronic noise).
The results at 662 keV are presented in Figure
8 for the 1.5 cm thick detector.
On the left side, the energy resolution
of a central pixel is shown as a function of the depth of
interaction.
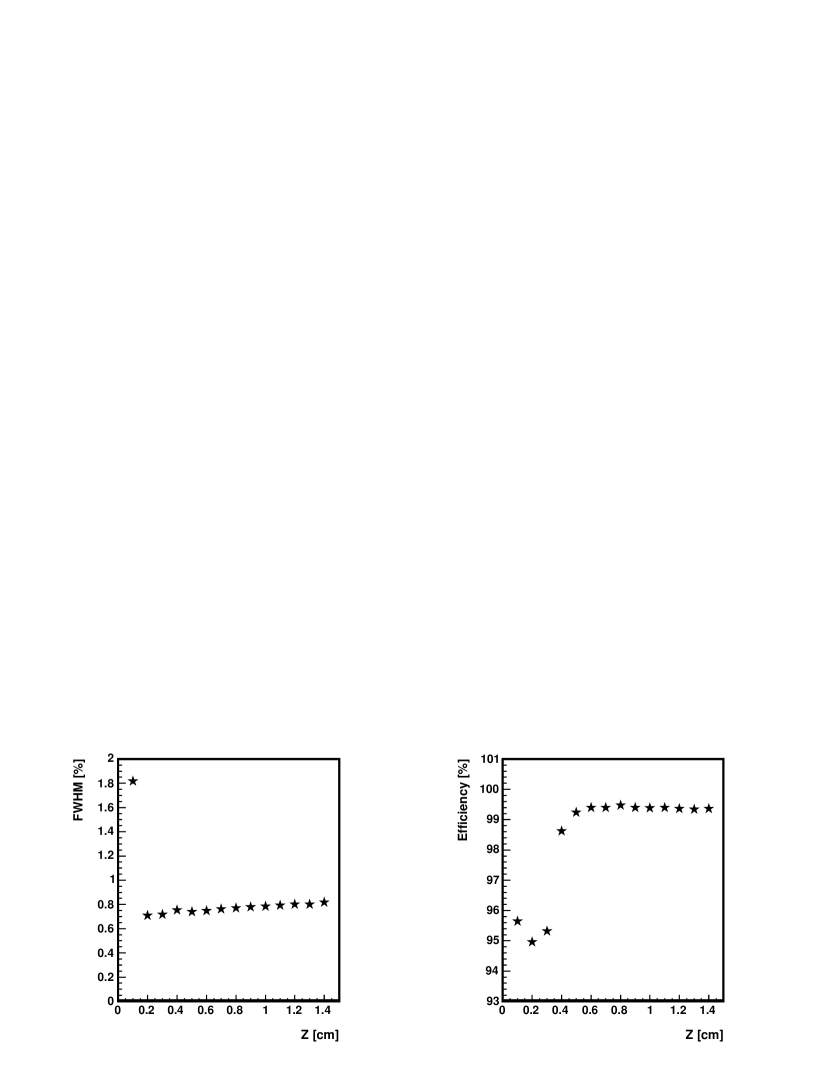
On the right side, the percentage of events within the photo peak () is shown. The energy resolution stays at about 0.8% at distances between 0.2 to 1.5 cm from the pixel side. Closer to the anode, the resolution deteriorates to 1.8%. The fraction of events within the photo peak is 100% for large z values whereas it drops to about 95% for events close to the pixel anode.
Energy spectra of events close to the anodes have a low energy tail. Depending on the exact location below one pixel, a variable amount of charge is induced on adjacent pixels. The charge is lost, if the adjacent pixel signal does not surpass the trigger threshold.
The results for 0.5 cm and 1.0 cm thick detectors are virtually the same as the corresponding region of the 1.5 cm thick detector, if one uses charge integration windows of the same duration.
From Figure 8 we see that the 0.25 cm region just below the anodes gives very poor energy resolution. This for 0.5 cm thick detectors, 50% of the detector volume performs very poorly. For 1 cm and 1.5 cm thick detectors, the fraction of poorly performing volume decreases to 25% and 16%, respectively.
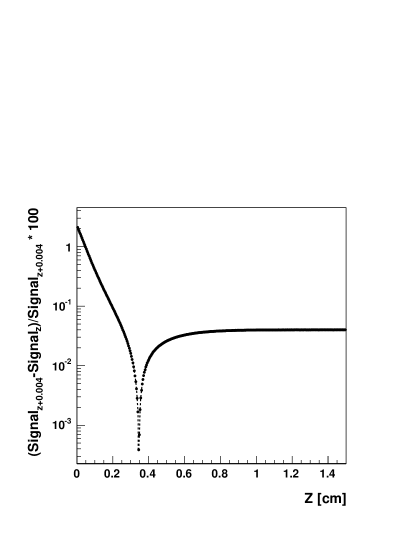
The energy resolution is also limited by the fact that an incident ray can generate multiple energy depositions below one single pixel. As multiple charge depositions under one pixel cannot be separated, the depth of interaction correction corresponds to the interaction with the longest drift time (closest to the cathode). However this correction is applied to the full signal. At 662 keV the median of the RMS values of the interaction region below one pixel with a thickness of 1.5 cm is 0.004 cm in z-direction. We calculated the relative difference between the signals induced by a interactions at point z and at point z+0.004 with x- and y-coordinates set to 0. The result is shown in Figure 9 as a function of z, which gives the error in the DOI correction if one corrects for a DOI of z instead of z+0.004 cm. Close to the pixel anode the charge spreading effect becomes more important because of the strong gradient of the weighting potential. The effect contributes considerably to the energy resolution below cm. At higher energies the spreading effect is more pronounced and its influence on the energy resolution increases.
To summerize the results above, the deterioration of the energy resolution for thinner CZT detector units is due to a) the steep gradient of the weighting potential close to the anodes, b) the induced signals in neighboring pixels below the trigger threshold and c) multiple interactions below one pixel.
3.2 Results for a full calorimeter
In this section we study the performance of a full calorimeter built out of several single detector units. The overall calorimeter size is cm3. This calorimeter is made of several layers of CZT detectors. Each layer contains of an array of detector units, each with pixels. As before, simulations were made varying the detector thickness (0.5, 1.0 and 1.5 cm). The overall size of the calorimeter was kept constant, therefore the number of layers was changed depending on thickness (90, 45 and 30 for 0.5 cm, 1.0 cm and 1.5 cm).
As before, we determine energy spectra by applying a DOI correction to each individual pixel signal satisfying the trigger criteria. Afterwards all signals are summed up to obtain the reconstructed energy.
The energy resolution is limited by several effects. Those which are due to the properties of the single detector units have been discussed in the previous section in some detail. Therefore we will limit the discussion here to effects which are peculiar to the full calorimeter.
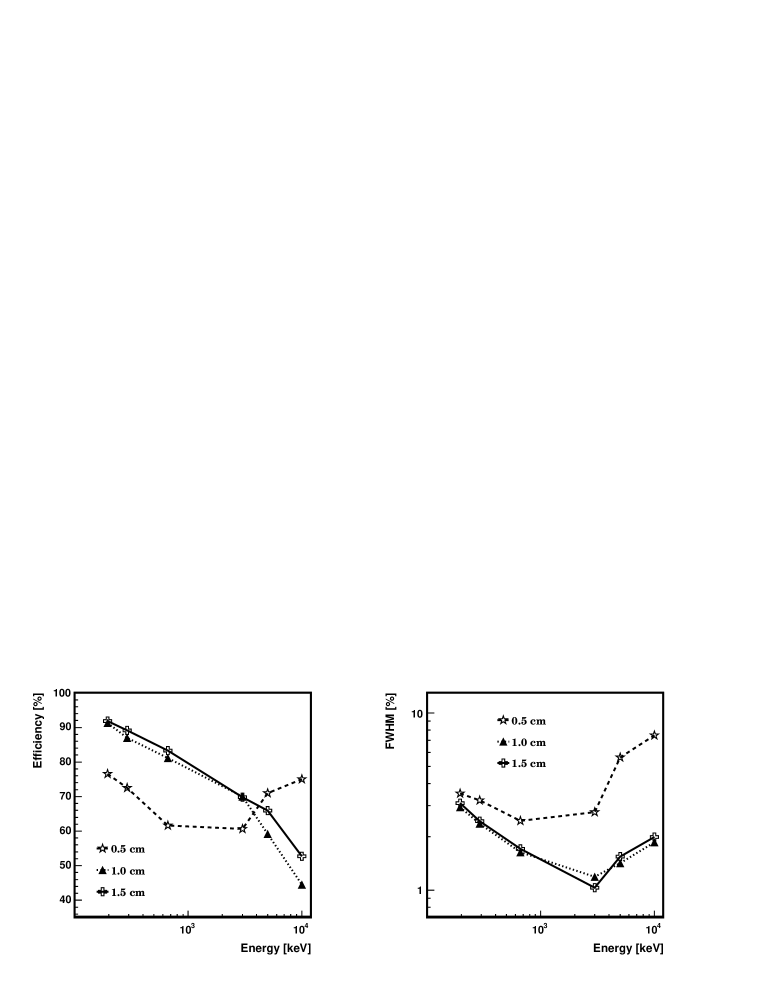
The energy resolution of the full calorimeter as a function of incident energy are given on the right side of Figure 10 for detector designs with base units of 0.5 cm, 1.0 cm and 1.5 cm thickness.
On the left side, the detector efficiency is given, which we define as the fraction of events being reconstructed within of the peak of the energy spectra. Below 1 MeV a calorimeter made out of 0.5 cm thick detector units shows resolutions between 2% and 5%. Above 1 MeV, the value steadily increases to 7.5% at 10 MeV. The efficiency lies between 76% and 60%. Calorimeters made of 1 cm and 1.5 cm thick detector units perform markedly better. The energy resolution of both calorimeters improve from 3% at 200 keV to 1% at 3 MeV. At higher energies, the resolutions increase somewhat up to 1.9% at 10 MeV. The efficiency drops from 94% at 200 keV to 43% at 10 MeV.
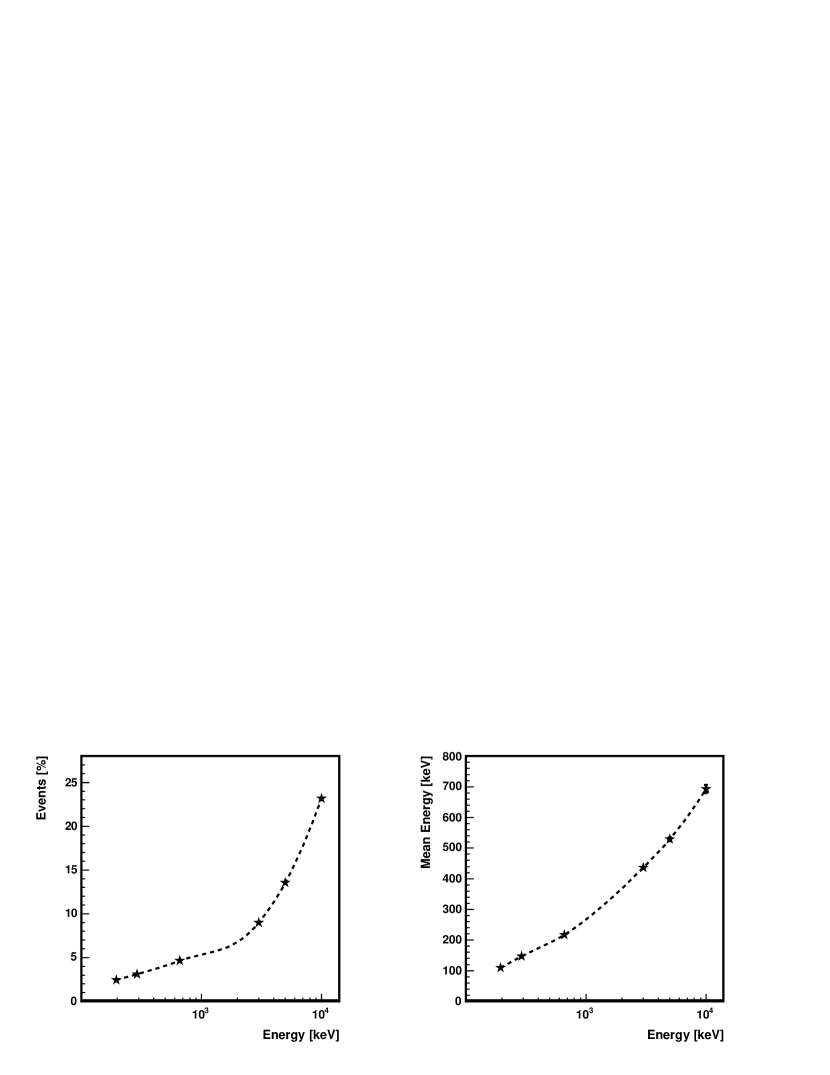
To understand the influence of unit thickness, it is important to understand that secondary particles do leave the detector and therefore the energy of the incident ray is not fully deposited in the detector region. There exist two different classes of secondary particles. First those that are detectable by an active shield surrounding the detector. Usually a shield covers sides and bottom, but not the surface through which photons enter the detector because such a shield would interact with incoming photons. The direction in which the incoming photons stream we will call the ”forward direction”. Secondary particles leaving the detector in the direction of the shield can excluded from the analyses, when the shield is able to detect them or they can be included in the analyses if the shield gives sufficient energy information. Thus in principle these events do not reduce energy resolution, but, they reduce the efficiency. The second class are secondary particles which leave against the stream of incoming photons. We call this the ”upward direction”. Since there is no way to detect these photons these events are lost for analyses. The drop in the efficiency at higher incident energy is mainly due to the fact that the energy of the incident ray is not fully deposited in the detector region. Therefore the reconstructed energy is lower than the incident energy. Figure 11 shows the percentage of events leaving the detector in the upward direction. These are mainly caused by pair production events. The right side shows the mean energy lost in this way. At 662 keV 5% of the events loose on average 217 keV. At higher energies the importance of this effect increases. At 10 MeV 23% of events loose on average 700 keV. As already mentioned, there is no remedy for this and it is the main cause of the efficiency drop in calorimeters at high energies. For 0.5 cm thick detectors the energy resolution degrades at higher energies. The increase of multiple interactions together with the steep weighting potential gradient close to the anodes which affects about 50% of the volume of 0.5 cm thick detectors reduces the energy resolution significantly.
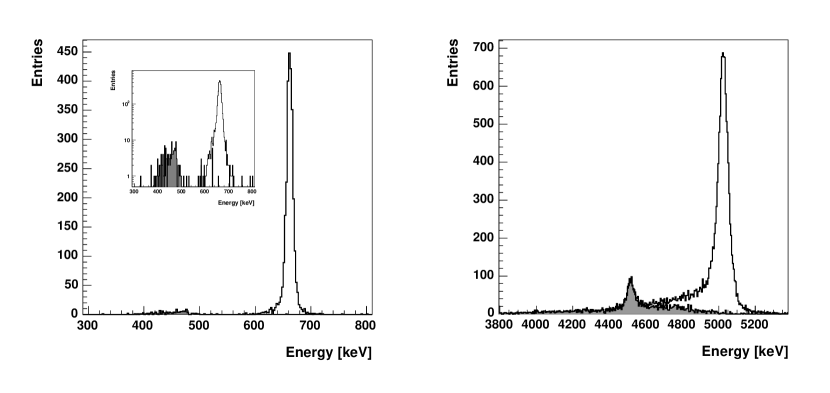
In Figure 12, an energy spectrum is shown for a full calorimeter with single detector units of 1.5 cm thickness for 5 MeV incident energy. The shaded area marks events where secondary particles leave the detector in upward direction.
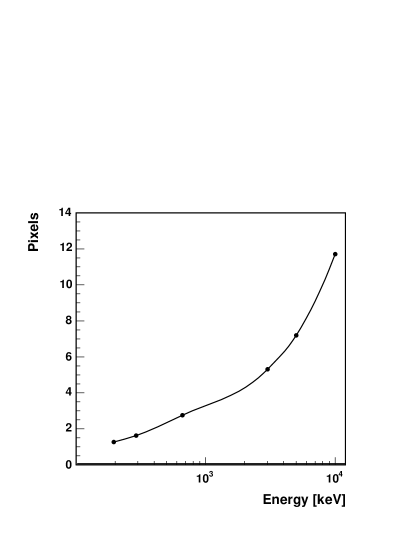
With increasing energy the number of interactions increases and the readout noise increases proportional to where is the number of triggered pixels. In Figure 13 the mean number of triggered pixels per incident gamma is shown as a function of incident energy for a 1.5 cm thick detector. From 200 keV to 10 MeV the mean number of pixels increases from around 1 to about 12. For 0.5 cm and 1.0 cm thick detectors, these values change by less than 2.5%.
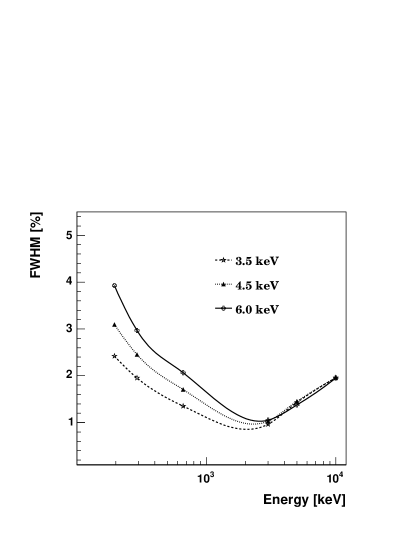
Finally, Figure 14 shows the energy resolution of a full calorimeter (1.5 cm thick detector units) for single channel noise levels of 3.5 keV, 4.5 keV and 6 keV. Above 2 MeV the contribution of single-channel noise is not anymore significant while at lower energies the the overall performance can be improved by reducing single-channel noise.
Summarizing it can be said that the efficiency of a full calorimeter is mainly limited by secondary particle leaving the detector in the upward direction while energy resolution is limited by the steep weighting potential near the anode pixels and the signal loss caused by the trigger threshold.
4 Conclusion
In our simulations we have considered weighting potential, electron and hole trapping. The results of a single detector unit are in good agreement with experimental data. Therefore, precipitates and crystal inhomogeneities play a major role only for underperforming detector regions.
The studies in this paper show, that CZT has to be seriously considered as a detector material for the design of future calorimeters which operate in the range from several keV up to several MeV. We have simulated three different calorimeter designs varying the thickness of the individual detector and the number of layers, keeping constant the size of the full calorimeter constant (10.33 10.33 45 cm3).
Calorimeters built out of 1.0 cm and 1.5 cm thick units exhibit almost identical performance with energy resolutions of about 1.7% at 662 keV and about 1.9% at 10 MeV. The energy resolution is mainly limited by the energy loss owing to secondary particles leaving the detector upward against the direction from which the incident radiation enters the detector and by the effects of the steep change of the weighting potential close to the anode. Going to higher energies the resolution is also negatively influenced by the increasing number of events which have several interactions below one pixel because in these cases DOI corrections are not well defined.
The principal result of our study is the fact that a 0.25 cm thick region below the anodes of the detector units exhibits a substantially poorer energy resolution than the rest of the detector volume. Reducing the portion of this low resolution volume increases the overall performance. A good calorimeter requires that the single detector unit is much thicker than the pixel pitch and of course much thicker than passive material. (mounting, cables and front-end electronics).
Therefore, calorimeters built with 1.0 cm or 1.5 cm thick CZT crystals have significantly better resolution than those with 0.5 cm thin detector units.
The energy resolution of a CZT calorimeter is shown in Figure 10. The resolution is limited a) by the steep weighting potential gradient close to the anodes, which dominates in thin detectors and impairs the correction of the depth of interaction (DOI), b) by the fact, that the incident energy is not totally deposited within the detector area because secondary particles leave the detector upward against the direction from which the incident radiation enters the detector c) because signals induced in neighboring pixels when the interaction is near the pixel edges and near the anodes with intensity below the trigger threshold are lost for signal reconstruction leading to systematically reduced signals.
We found that the energy resolution of a CZT calorimeter will lie between that of CsI-detectors and Ge detectors. In terms of spatial resolution solid state Ge and CZT detectors are of course much better than scintillation detectors. Where compactness and weight are issues as in a next generation space-born -ray telescope, Cadmium Zinc Telluride (CZT) detectors might be the detector option of choice.
References
- [1] F. Zhang, Z. He, G. Knoll, D. Wehe, J. Berry, 3D Position Sensitive CdZnTe Spectrometer Performance Using Third Generation VAS/TAT Readout Electronics, IEEE Transactions on Nuclear Science, Vol. 52, No. 5, October 2005
- [2] J. Matteson, CZT detectors with 3-D readout for gamma-ray spectroscopy and imaging, Proc. SPIE Vol. 4784 (2002)
- [3] J. R. Macri, B. Donmez, M. Widholm, L.-A. Hamel, M. Julien, T. Narita, J. M. Ryan and M. L. McConnell, Single-Sided CZT Strip Detectors Proc. SPIE, 5501, 208 (2004).
- [4] B. Doenmez, J. R. Macri, M. L. McConnell, J. M. Ryan, M. Widholm, T. Narita, and L.-A. Hamel, Proc. SPIE, 5922, 62 (2005).
- [5] S. Agostinelli et al., Geant4–a simulation toolkit, NIM A506, 250-303,2003
- [6] G. Kanbach et al., The MEGA project, New Astronomie Reviews 48, 275-280, 2004.
- [7] J. Knoedleseder, P. Jean, V. Lonjou et al. 2005, A&A, in press
- [8] T.J. O’Neill et al., Development of the TIGRE Compton Telescope for Intermediate-Energy Gamma-Ray Astronomy, IEEE Trans. Nucl. Sci. 50 2 , 251, 1999.
- [9] R. Andritschke et al., The calibration setup of the MEGA prototype at the high intensity c-ray source, New Astronomie Reviews 48, 281-285, 2004.
- [10] F. Schopper et al., CsI calorimeter with 3-D position resolution, NIM A442, 394-399, 2000.
- [11] K. Vetter, Performance of the GRETA prototype detectors, NIM A452, 105-114, 2000.
- [12] K. Vetter, Three-dimensional position sensitivity in two-dimensionally segmented HP-Ge detectors, NIM A452, 223-238, 2000.
- [13] eV Products, 373 Saxonburg Boulevard, Saxonburg, PA 16056
- [14] W. Shockley, Currents to conductors induced by a moving point charge, J. Appl. Phys. 9 (1938) 635 I.R.E., September 1939, 584
- [15] S. Ramo, Current induced by electron motion, Proceedings of the I.R.E., September 1939, 584